A Minisforum elsősorban arról ismert, hogy mini PC-ket kínál minden teljesítményosztályban. A legtöbb mini PC gyártó inkább távol tartja magát a hagyományos asztali számítógépek piacától, de mint kiderült, a Minisforum ezen a területen is meg meri vetni a lábát. Nemrégiben fedezhettük fel a jó teljesítményű Minisforum BD770i amely a AMD Ryzen 7 7745HX-re épülő. Az AMD Ryzen APU-val szerelt csúcsmodellként a Minisforum BD790i alaplapja egy még erősebb modell a gyártó portfóliójában, amelyet ebben az ismertetőben részletesen megvizsgálunk.
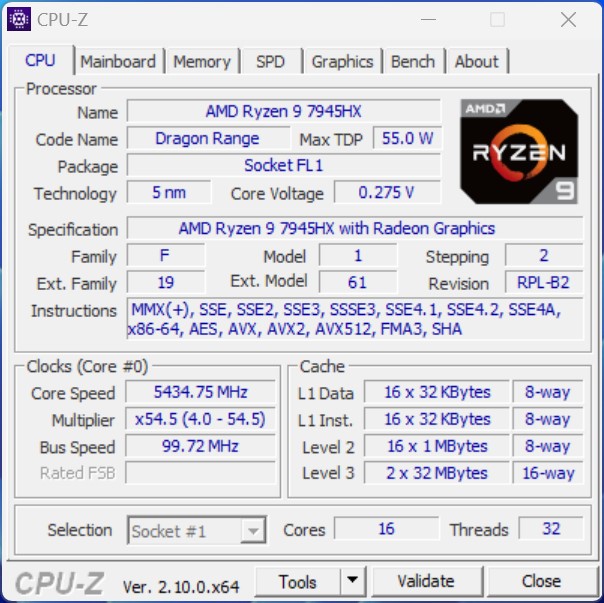
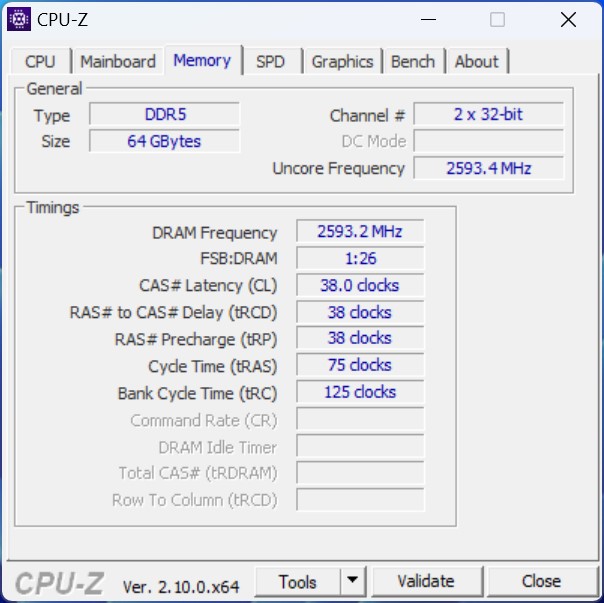
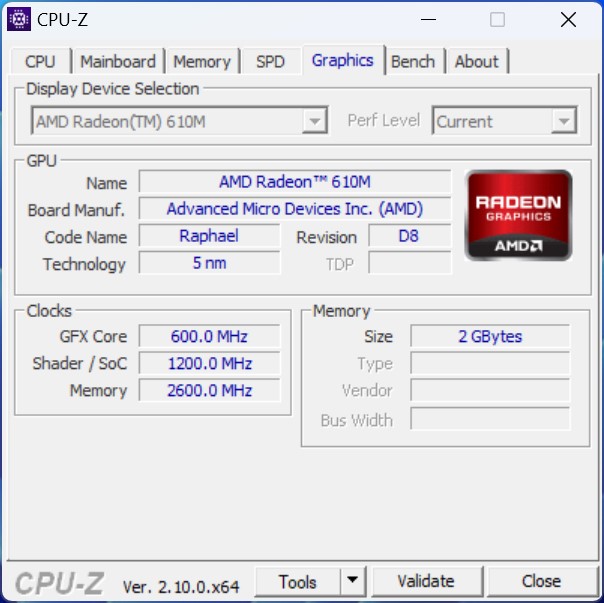
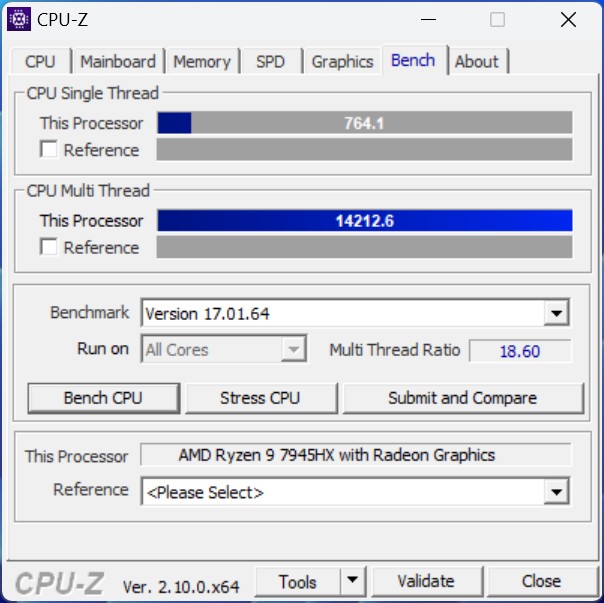
A Minisforum egy AMD Ryzen 9 7945HX processzort épített a BD790i modellbe, amely 16 Zen4 maggal van felszerelve. Ez azt jelenti, hogy a mobilszektorból érkező SoC jelenleg az egyik leggyorsabb, amit az AMD jelenleg kínál. Annak érdekében, hogy értékelni tudjuk a játékteljesítményét, megnéztük, hogy egy Nvidia GeForce RTX 4090. A teljes PCIe x16-os foglalatnak köszönhetően a grafikus kártyát teljes teljesítményével lehetett csatlakoztatni.
Minisforum alaplapok összehasonlításban
| Név | BD790i | BD790i SE | BD770i | AR900i |
| CPU | AMD Ryzen 9 7945HX | AMD Ryzen 9 7940HX | AMD Ryzen 7 7745HX | Intel Core i9-13900HX processzor |
| Magok / szálak | 16 / 32 | 8/16 | 8/16 | 24/32 |
| GPU | AMD Radeon 610M | AMD Radeon 610M | AMD Radeon 610M | Intel UHD Graphics |
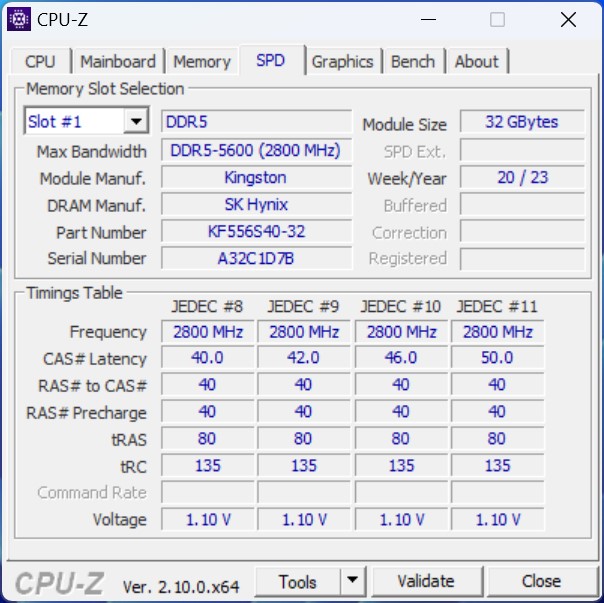
| Memóriatípusok | DDR5-5200 SODIMM | DDR5-5200 SODIMM | DDR5-5200 SODIMM | DDR5-5600 SODIMM |
| Maximális memóriaméret | 96 GB | 64 GB | 64 GB | 64 GB |
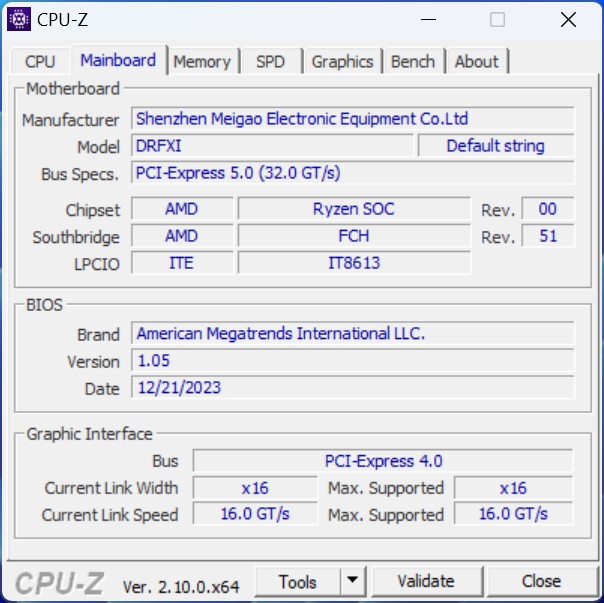
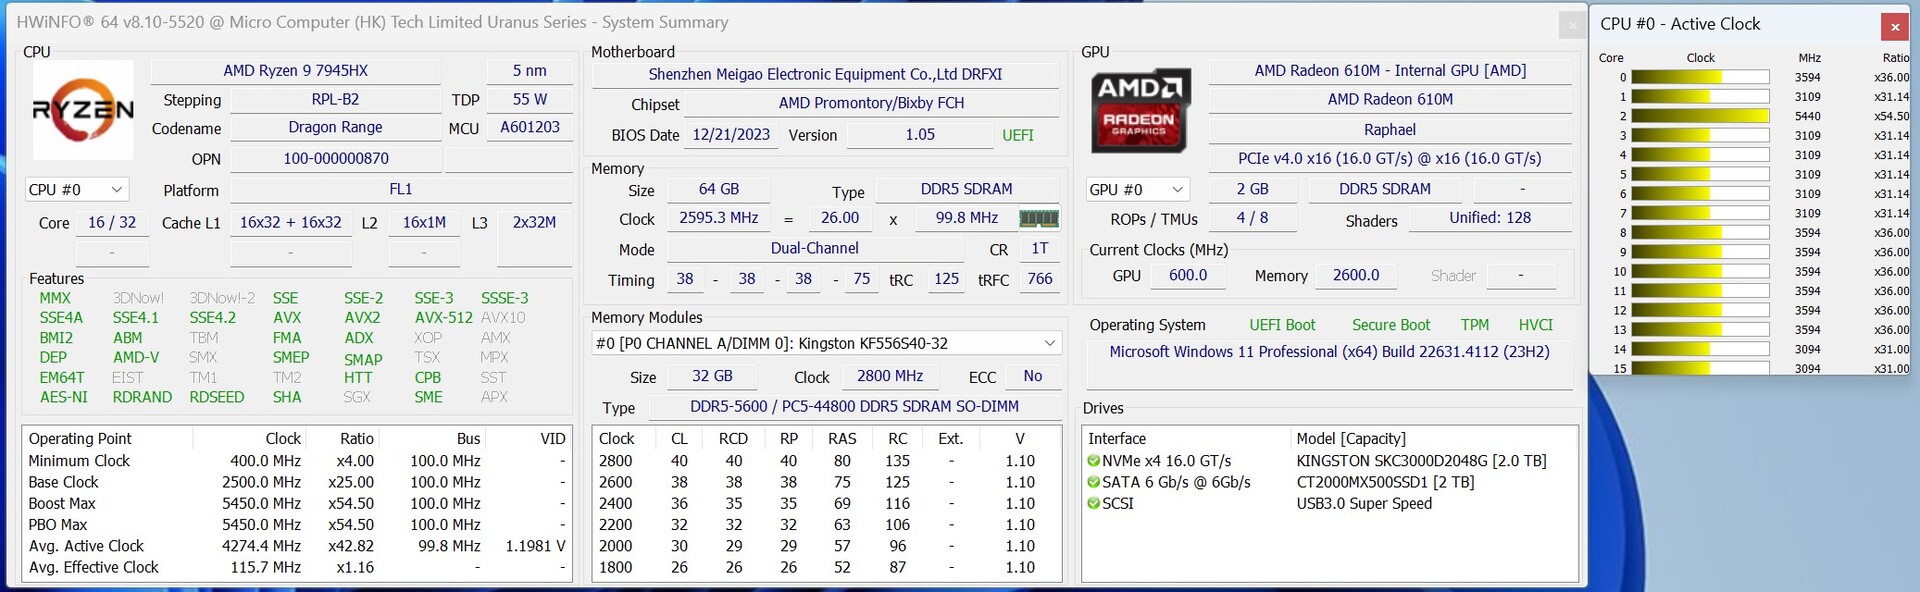
A Minisforum BD790i és a tesztrendszer részleteiben


Eset és tesztelési beállítás
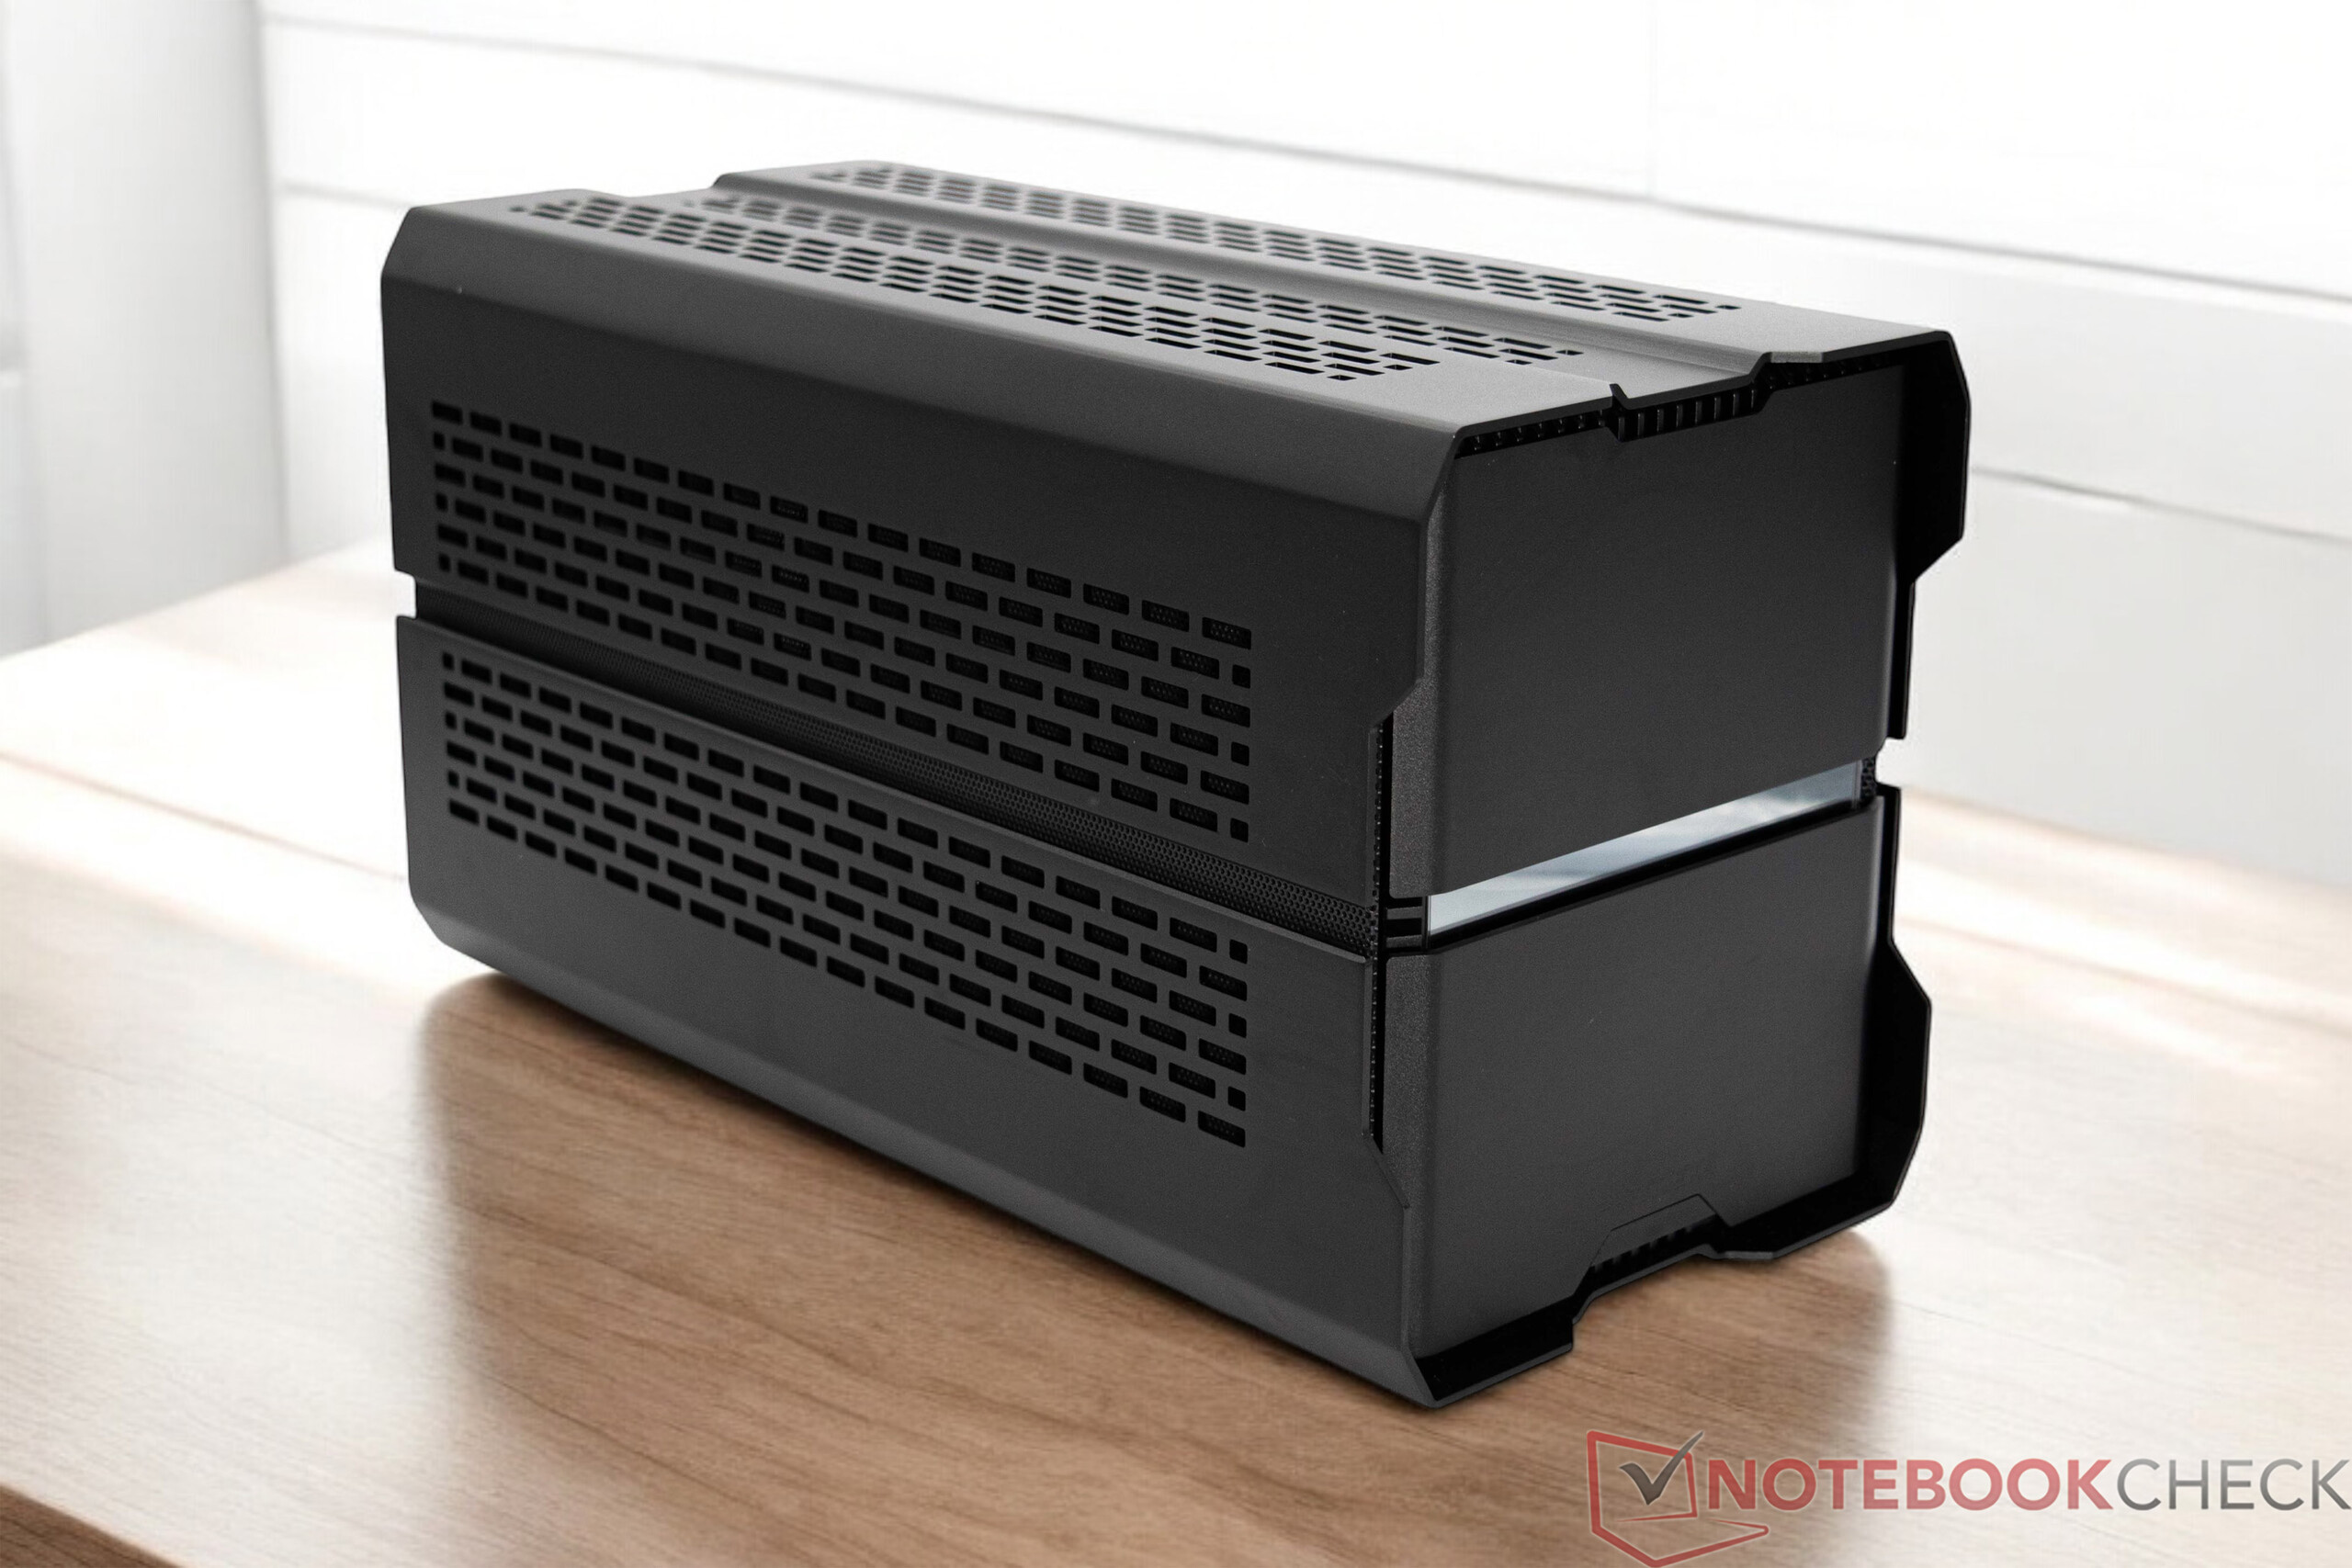
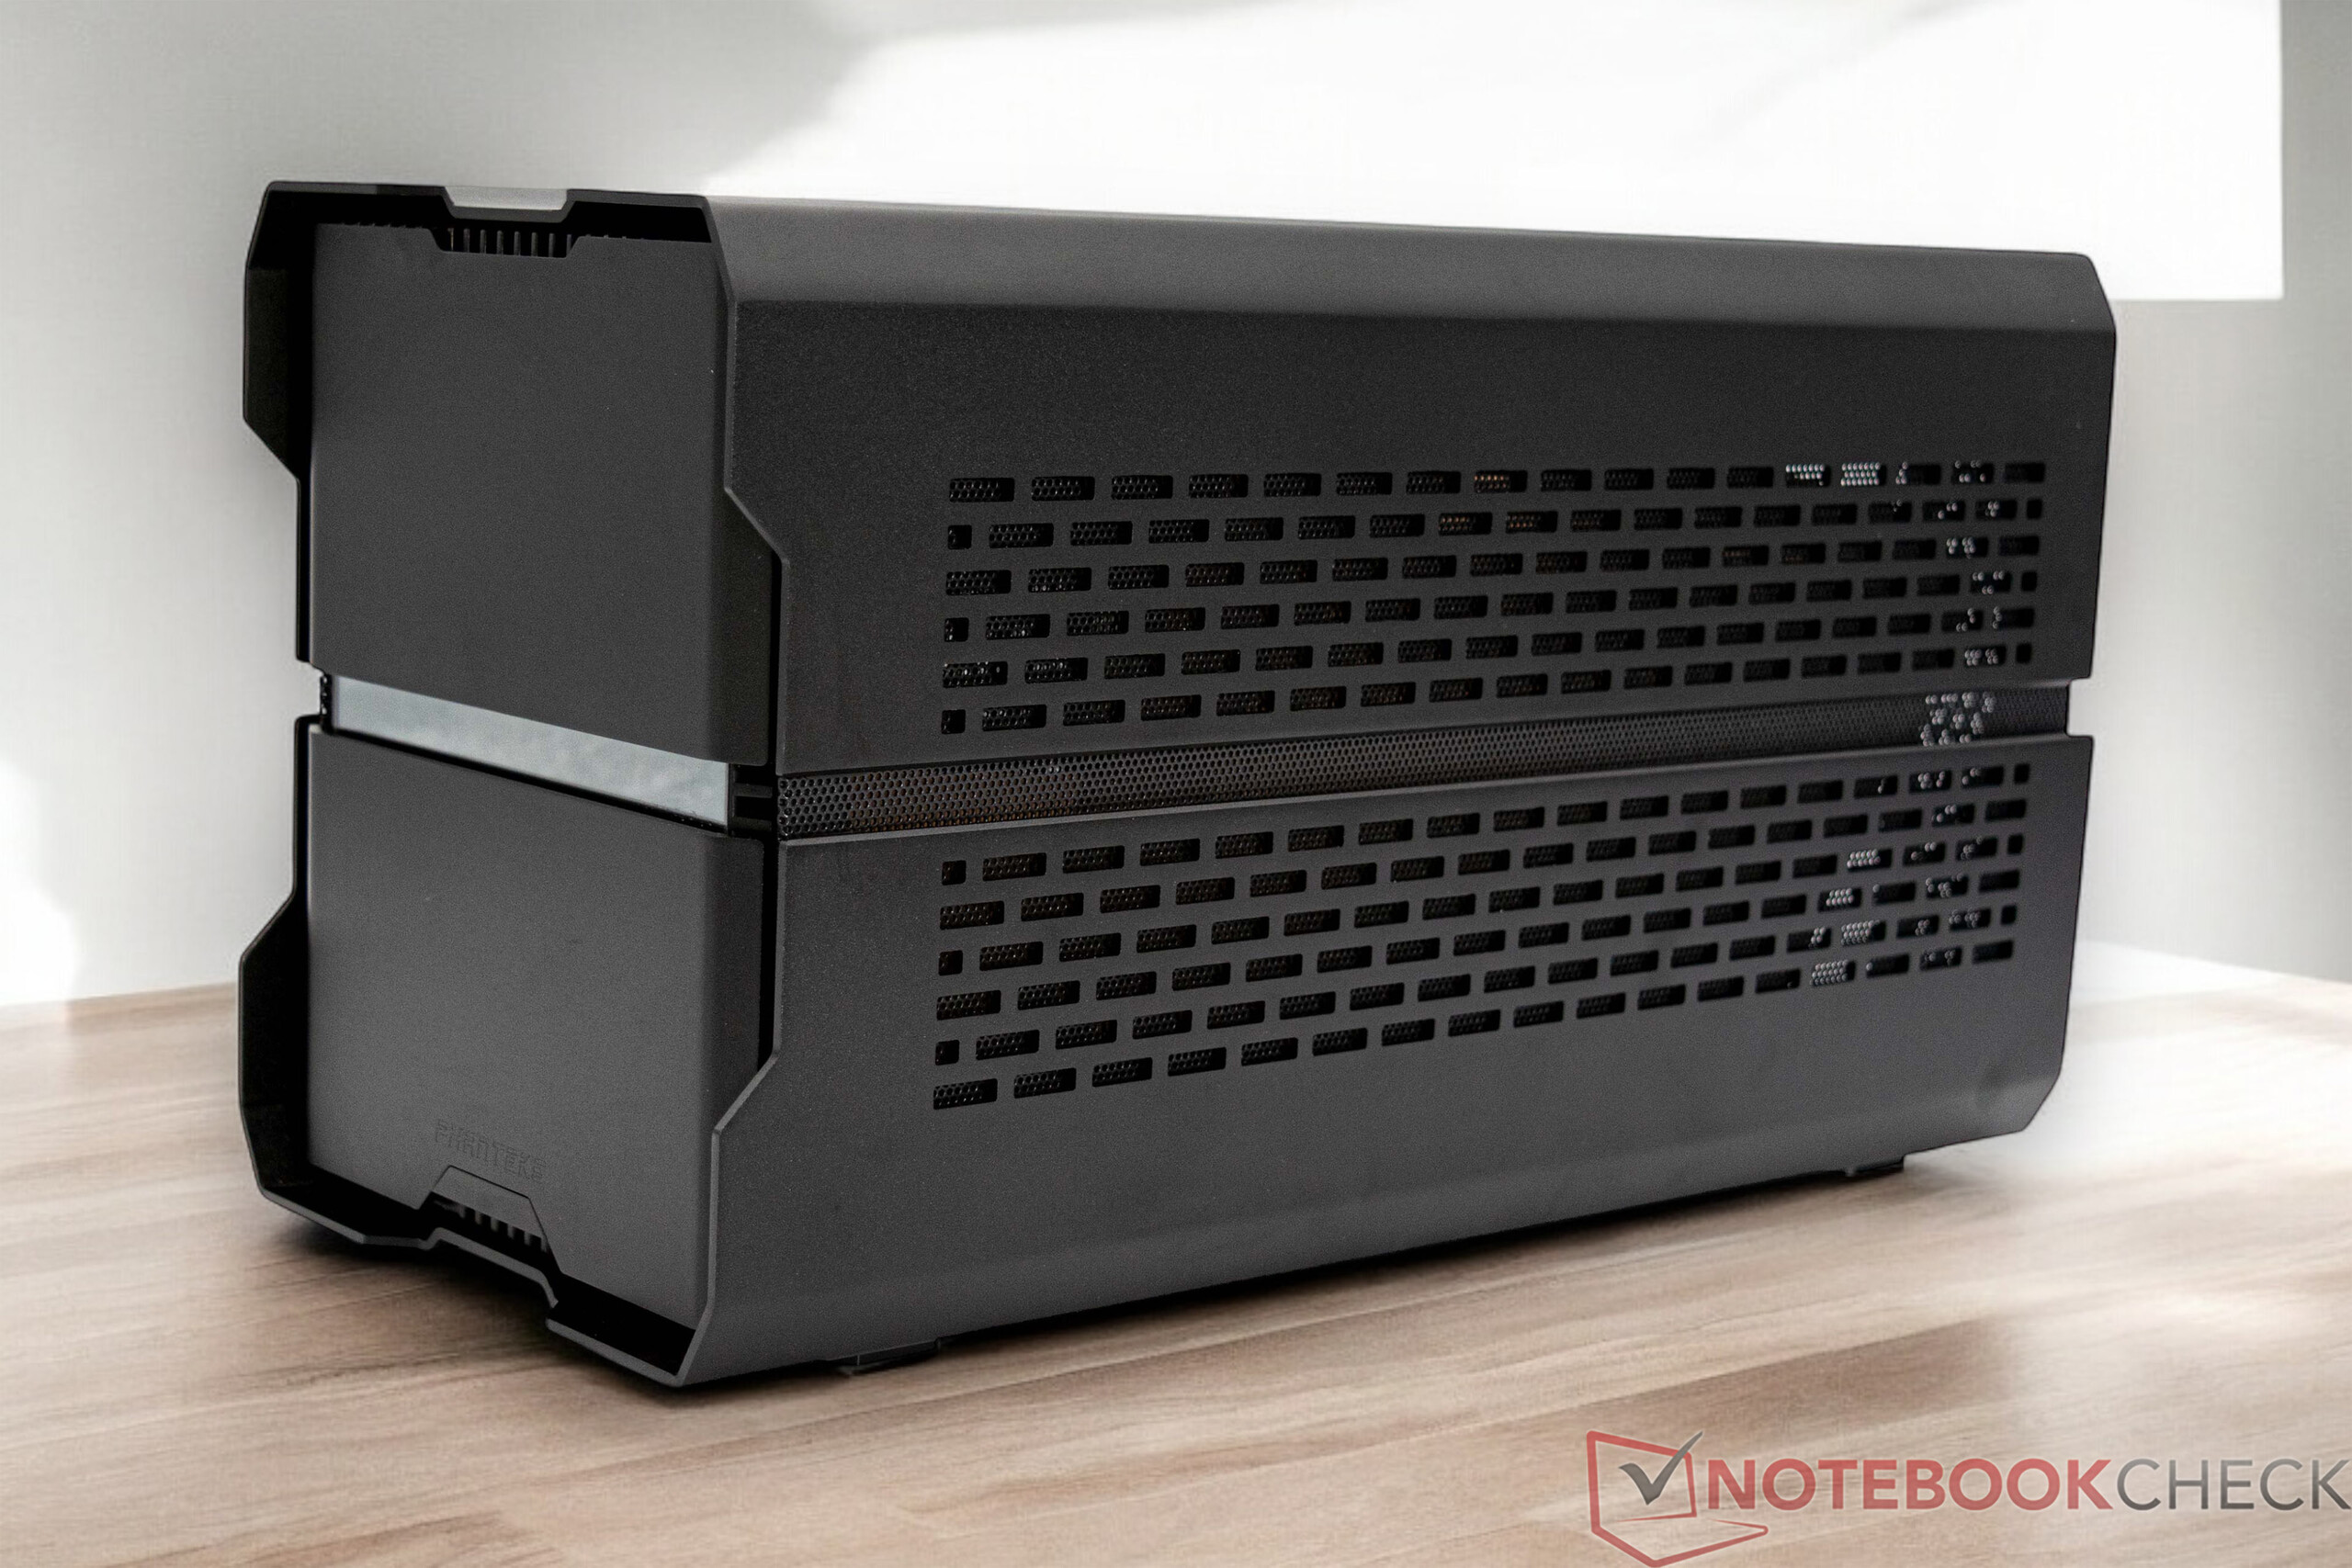
Hogy a lehető legjobb összehasonlíthatóságot biztosítsuk a Minisforum BD770i készülékkel, amelyet már teszteltünk, pontosan ugyanazokat a feltételeket tartottuk be. Pontosabban ez azt jelenti, hogy az összes CPU-tesztünket beszerelt állapotban végeztük el. Ehhez a Phanteks Enthoo Evolv Shift XT készülékházát használtuk, amely kompakt méretének köszönhetően jó alapot nyújt.
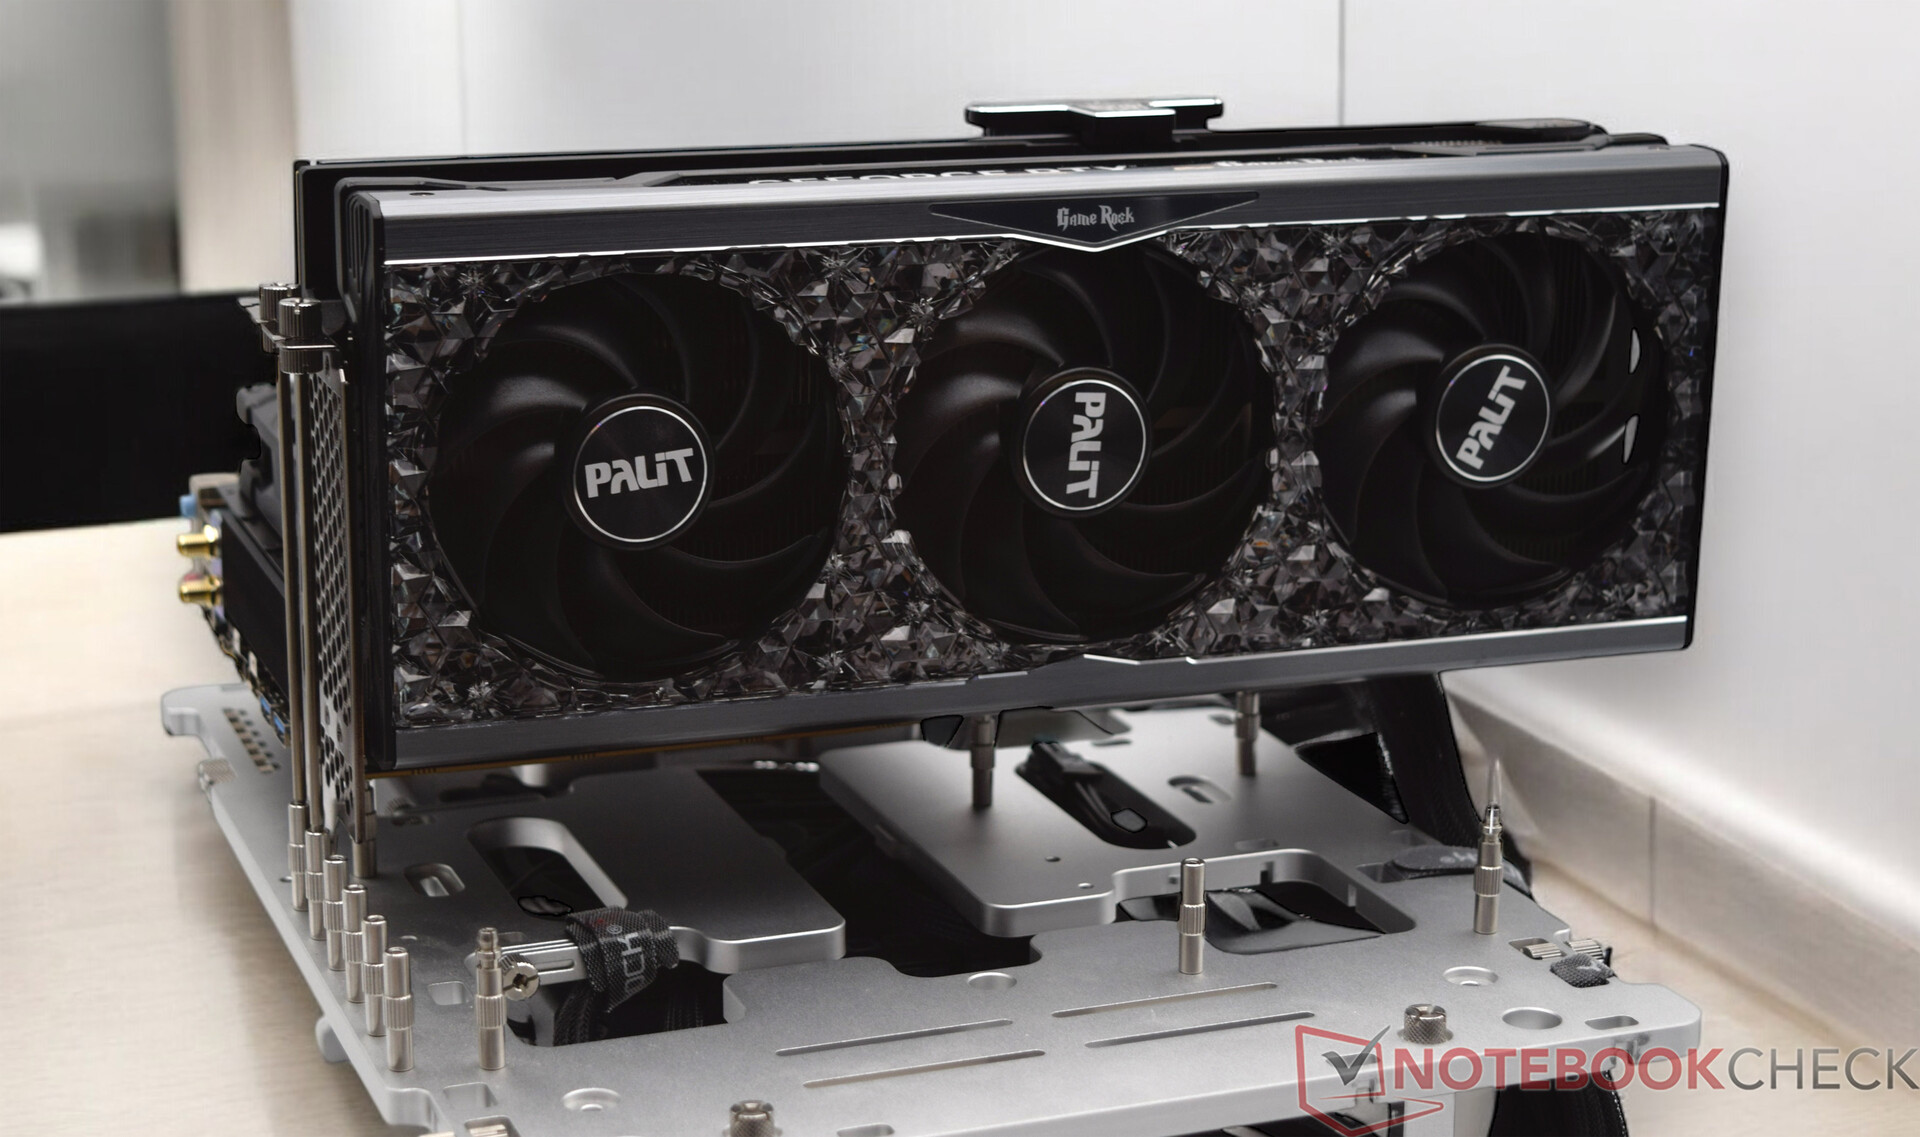
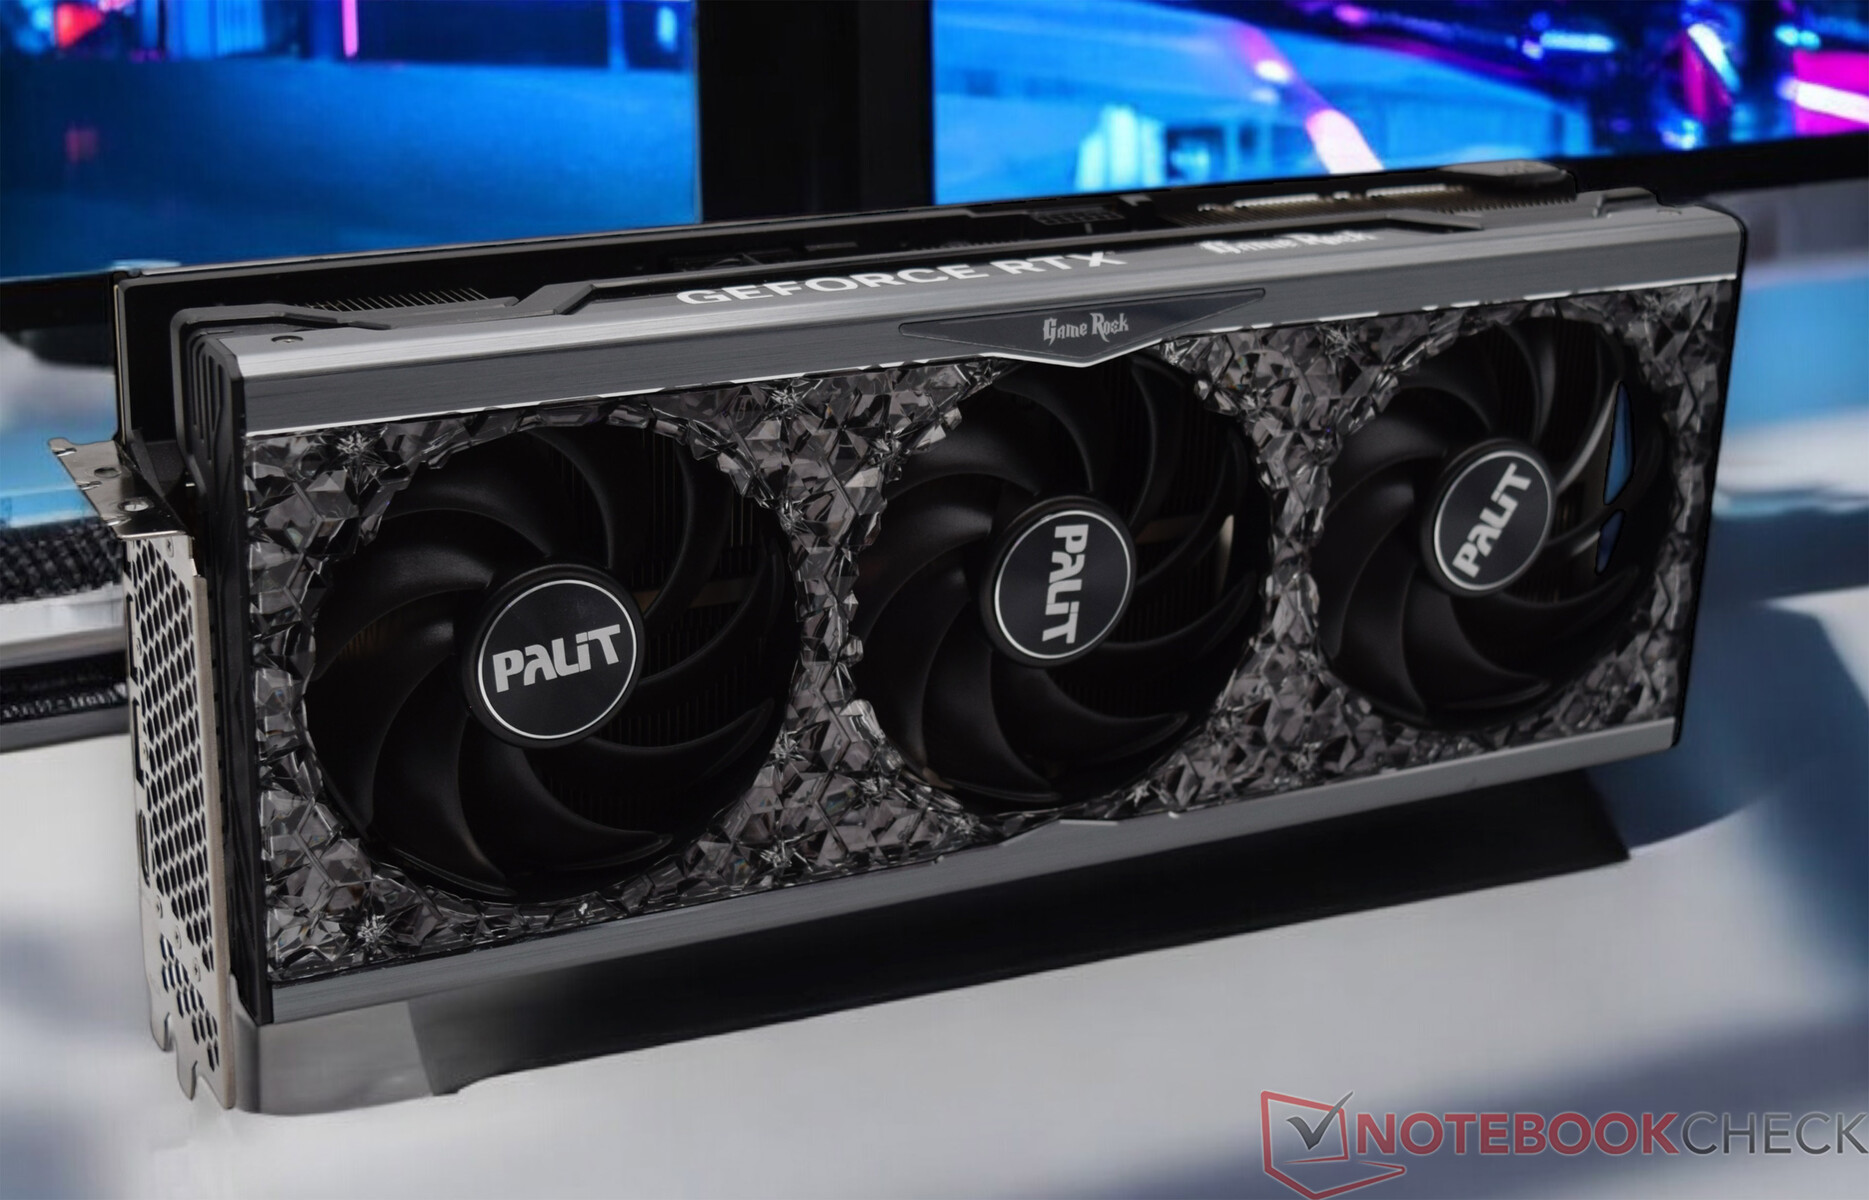
A dedikált grafikus kártyával való teljesítmény-összehasonlításunkhoz a Minisforum BD790i-t teszteltük a Palit GeForce RTX 4090 GameRock OC RTX 4090 GameRock OC nyílt beállításban. A grafikus kártyát a mérete miatt nem lehetett a Phanteks Enthoo Evolv Shift XT-be szerelni. A Phanteks Enthoo Evolv Shift XT-be azok a grafikus kártyák férnek be, amelyek hossza nem haladja meg a 32,4 centimétert.
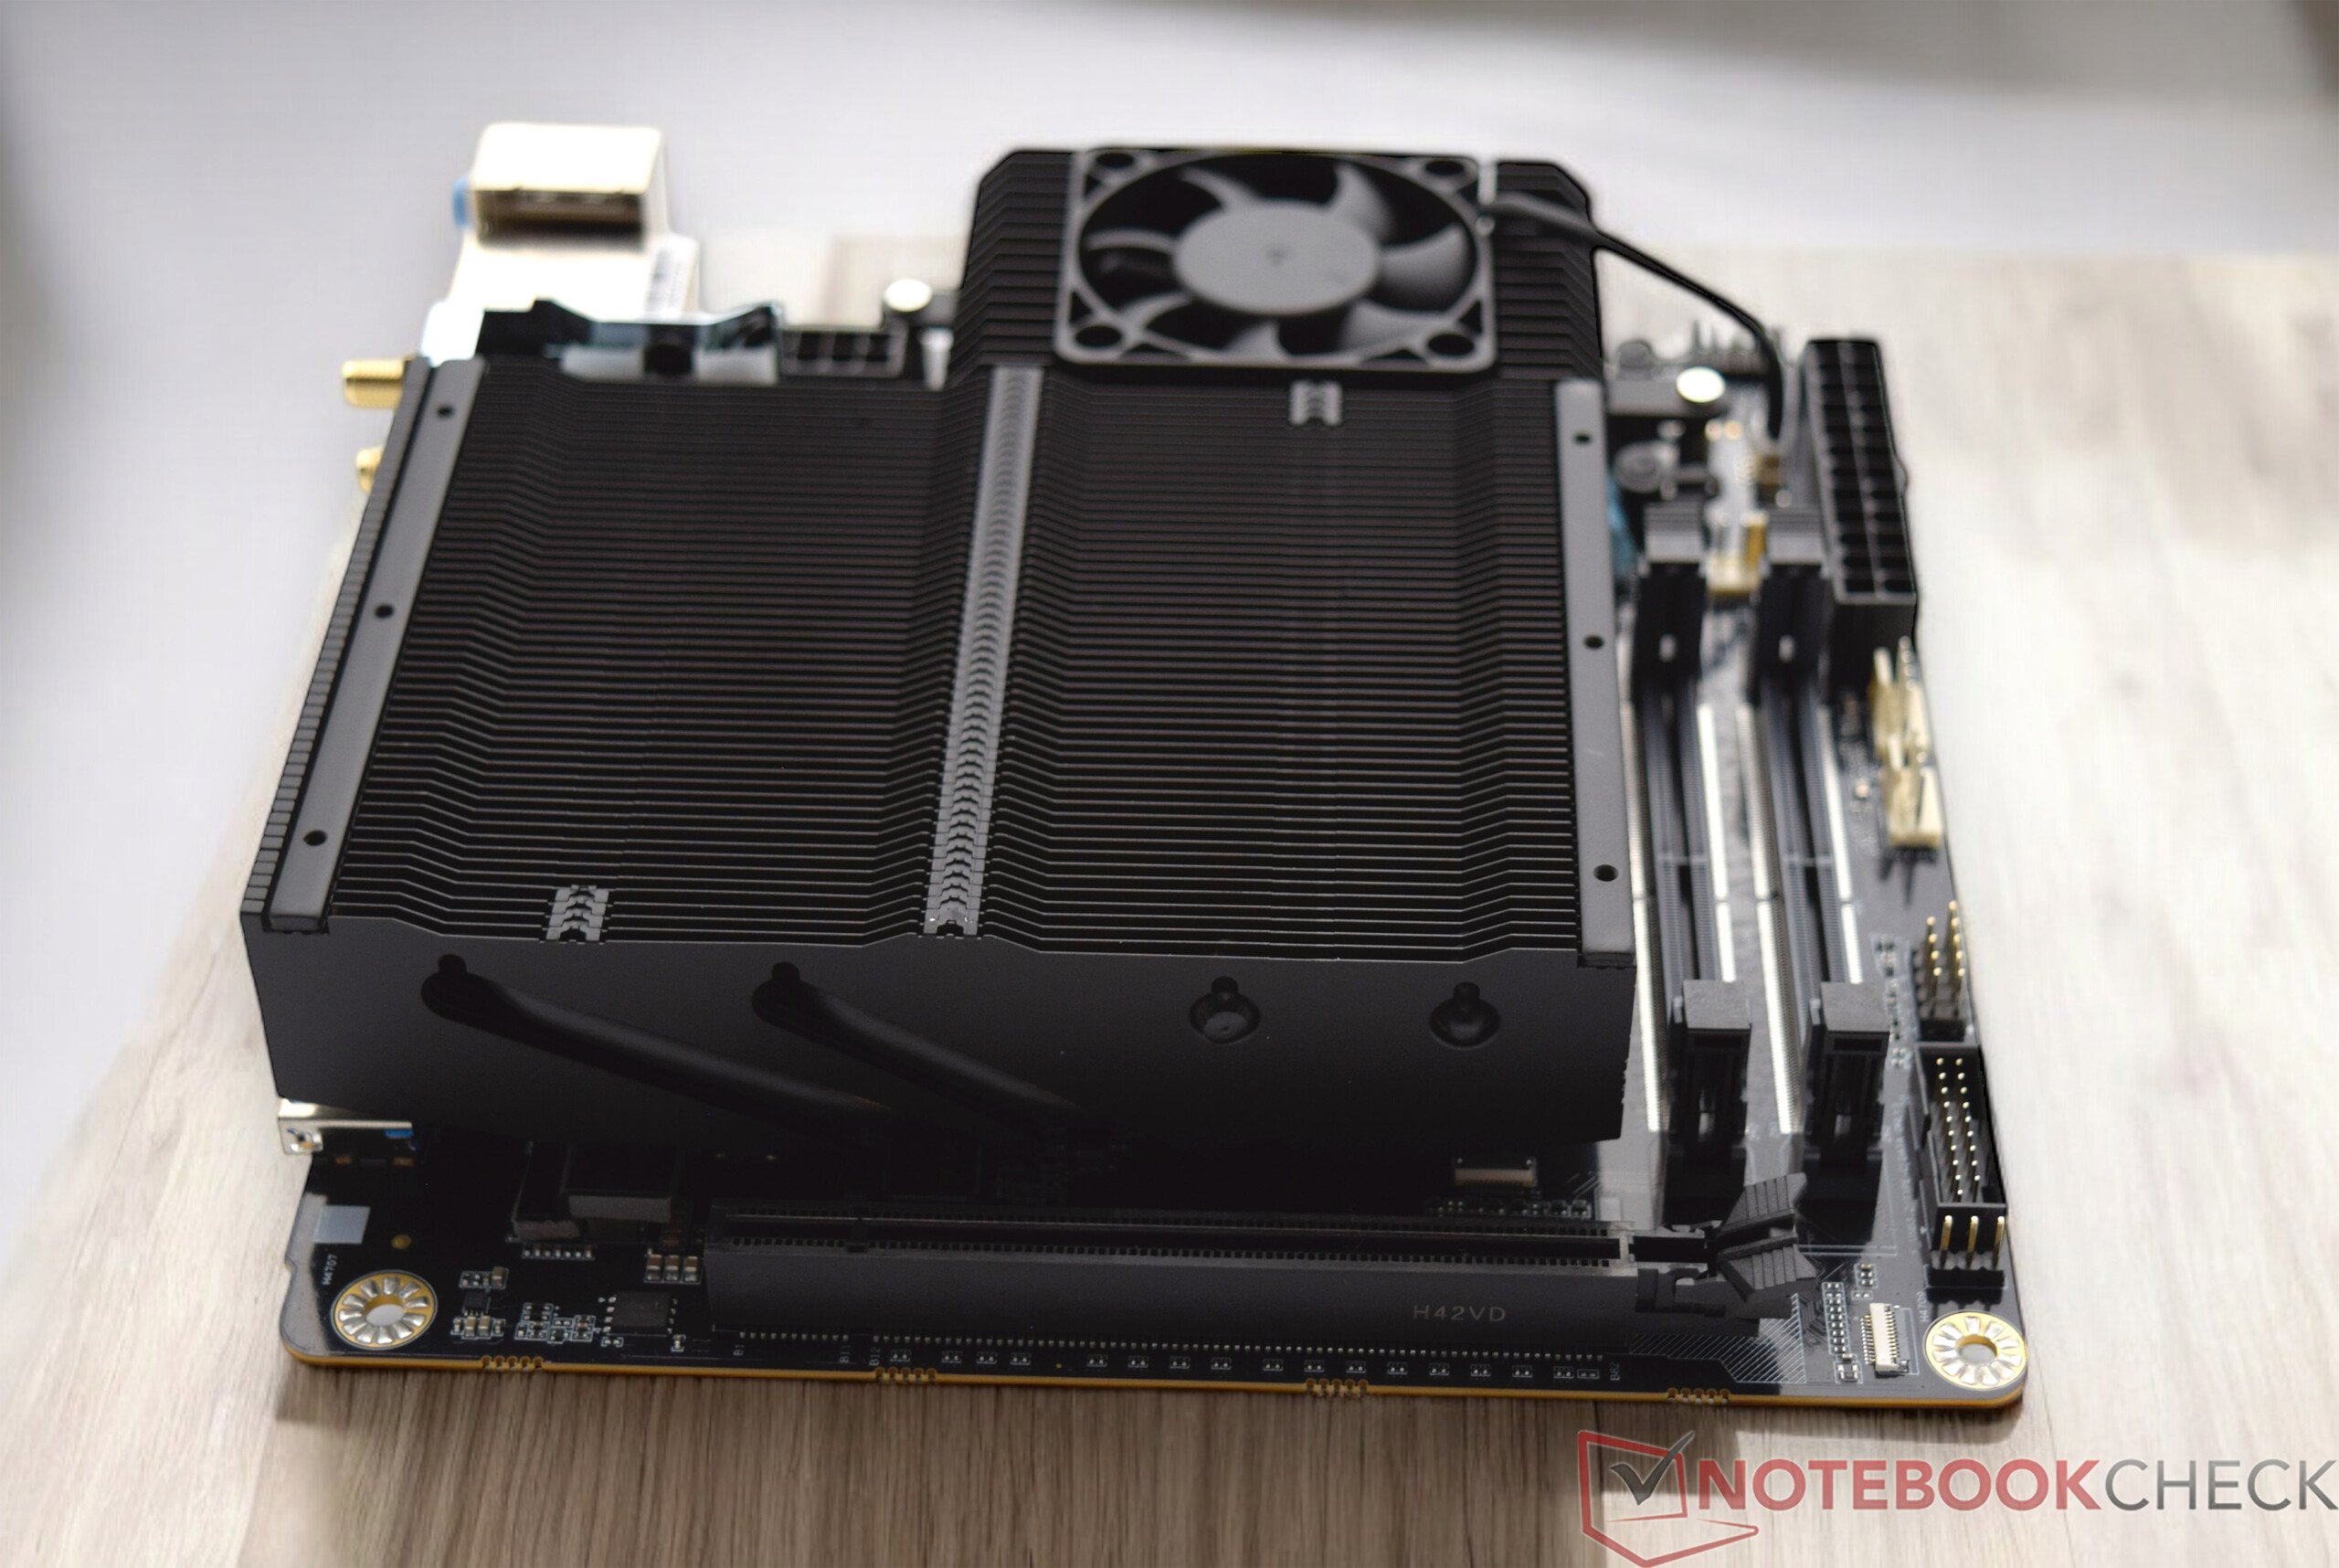
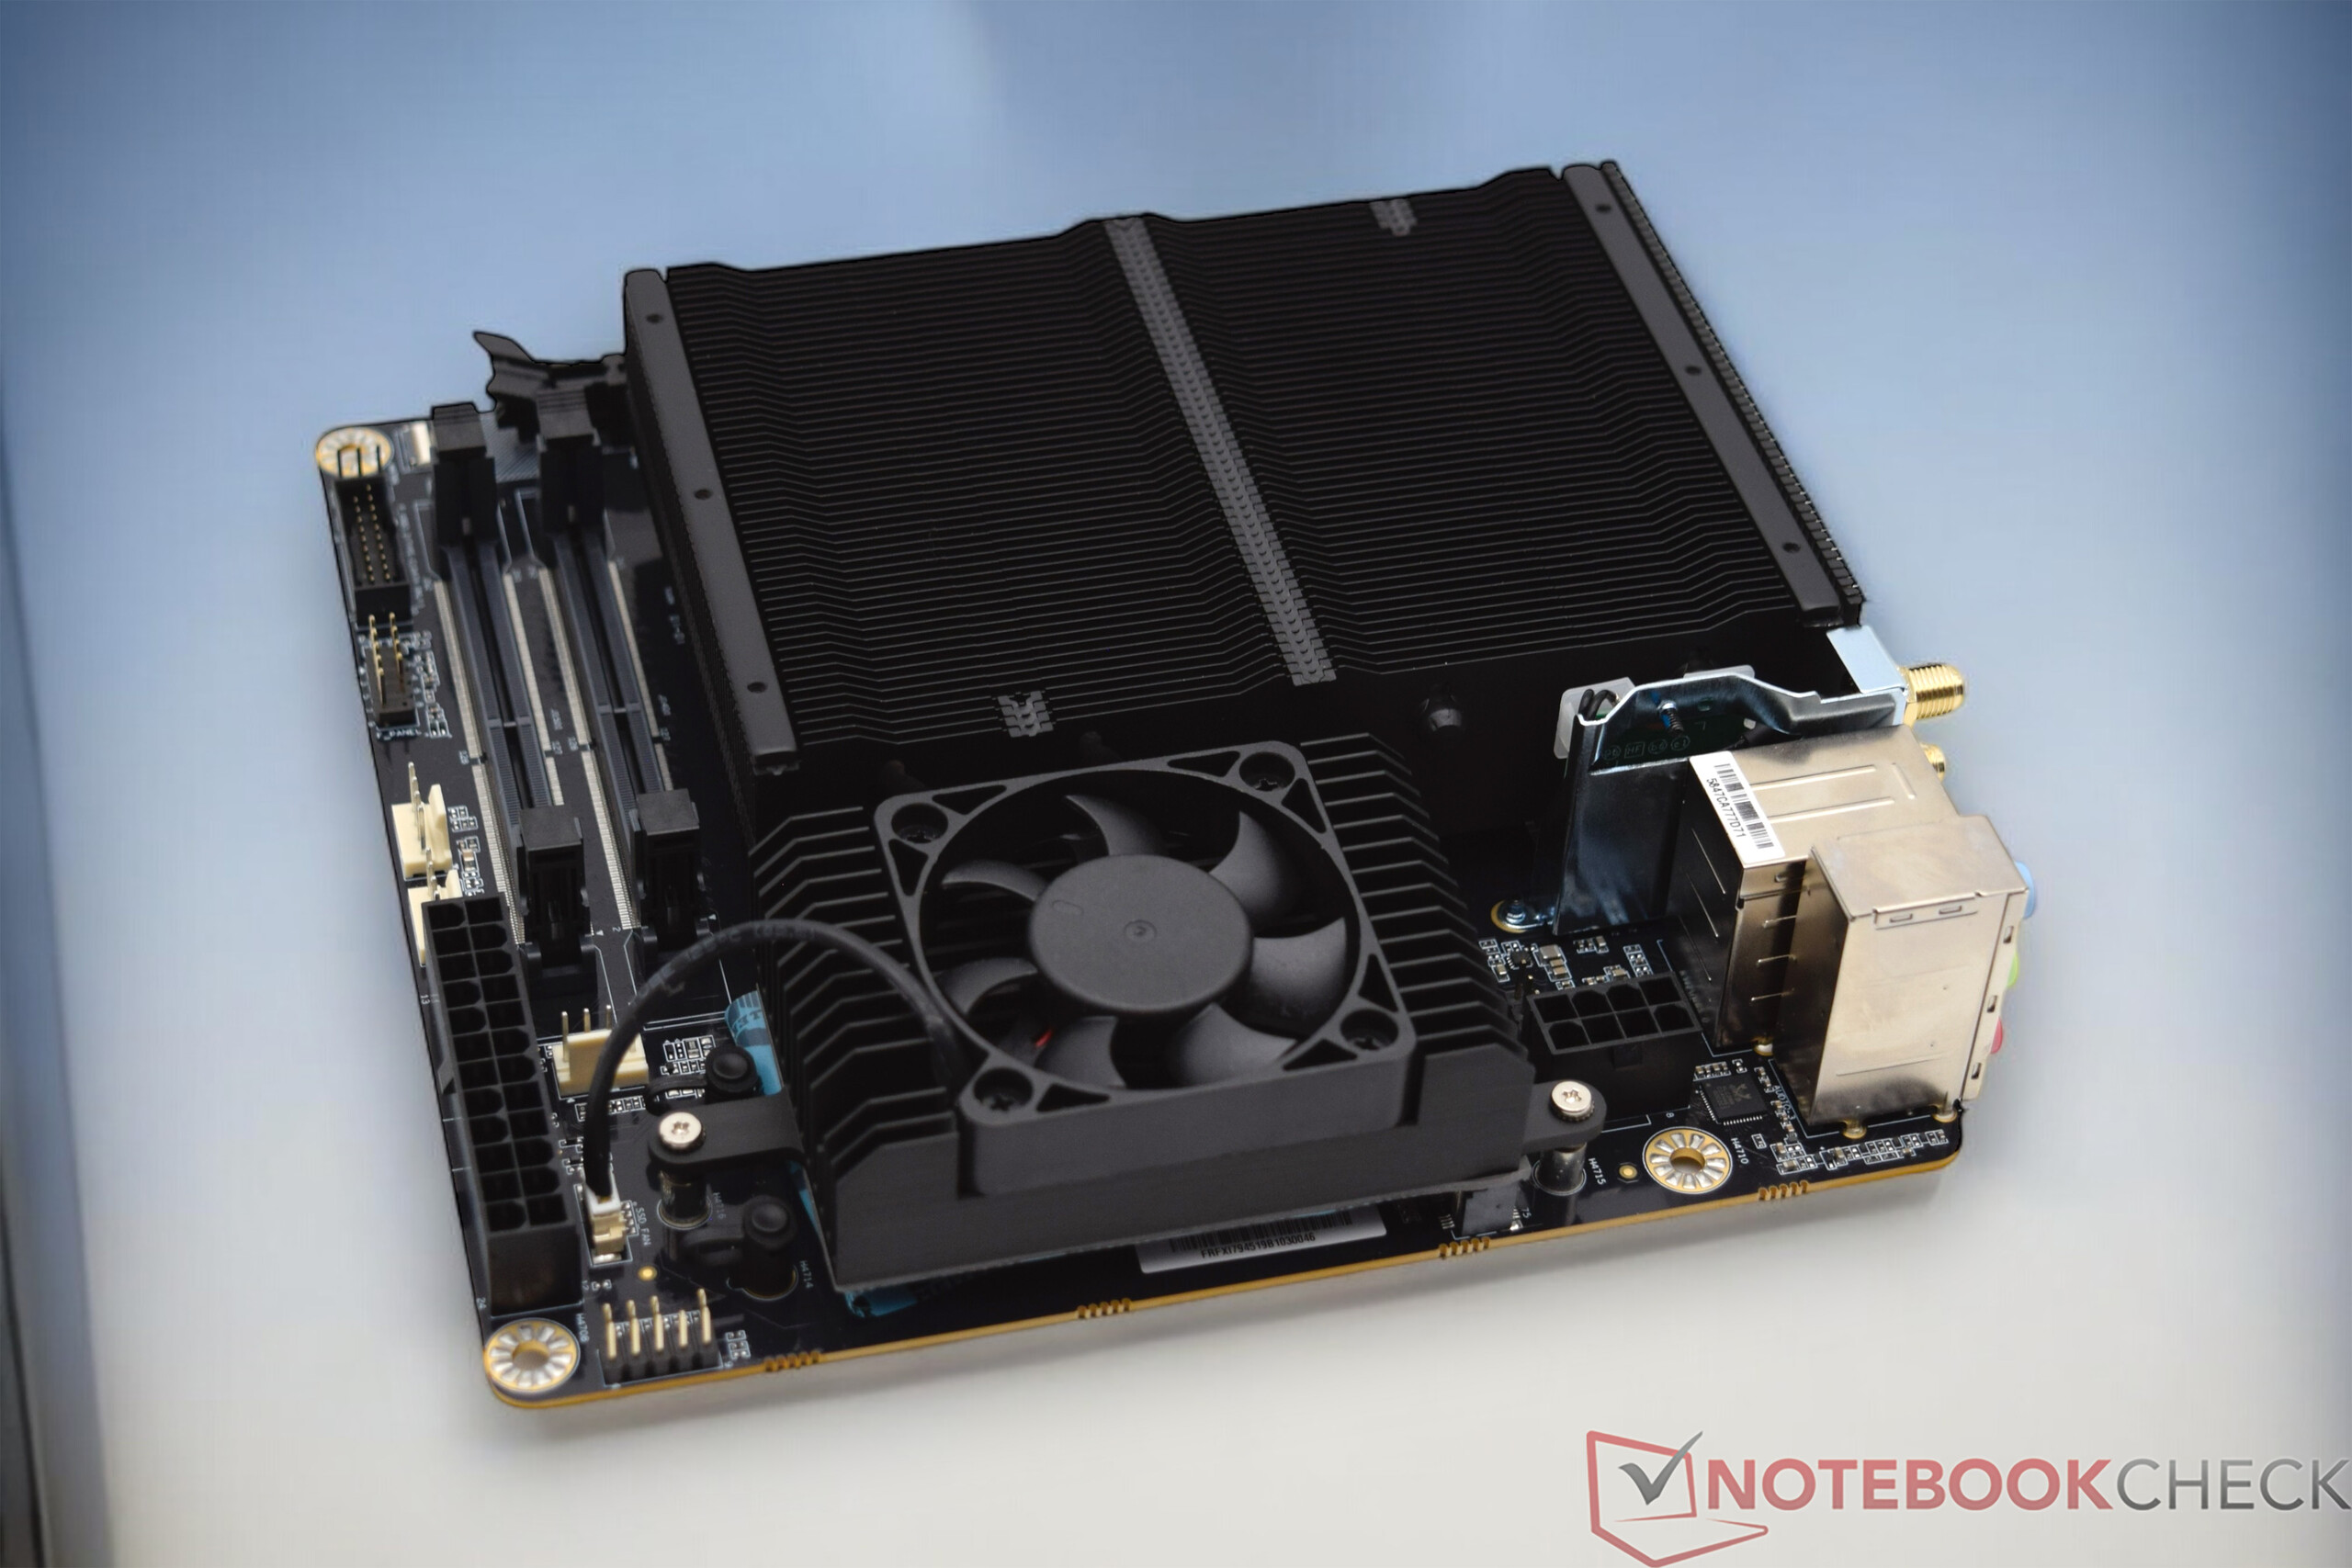
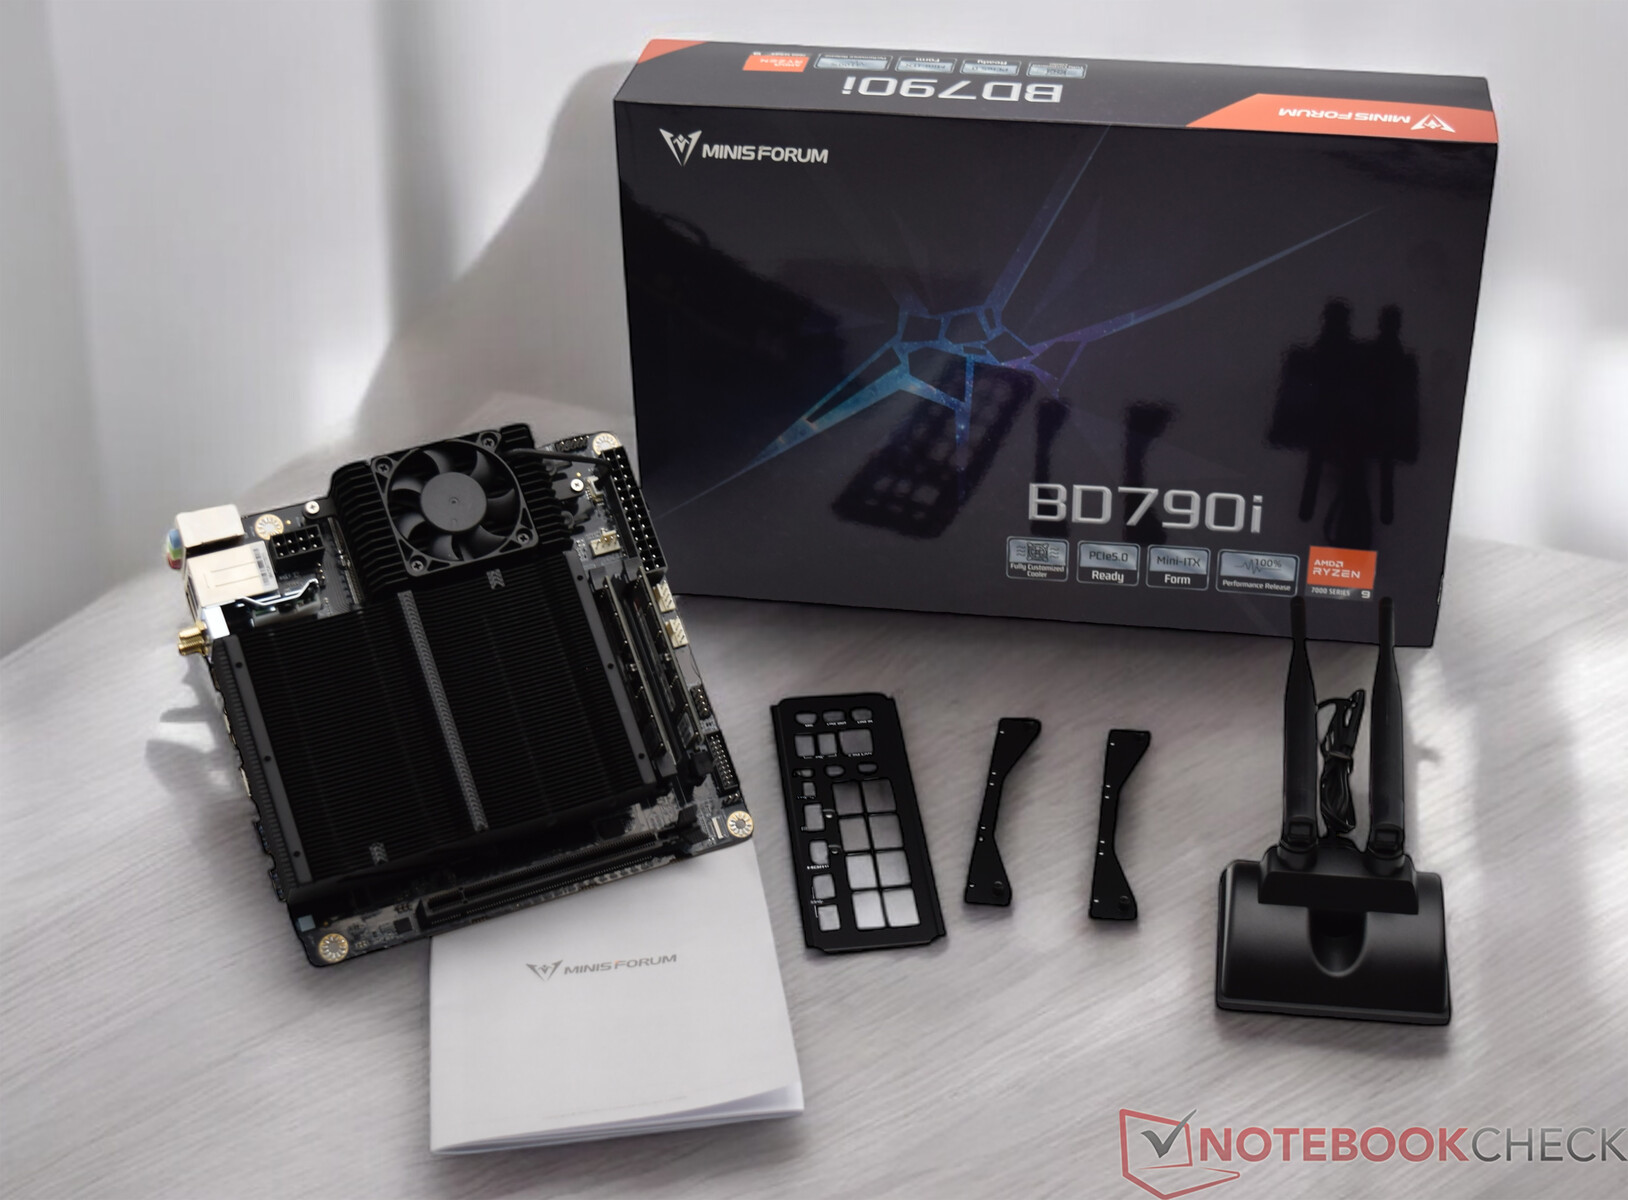
Szállítási terjedelem és csatlakoztathatóság
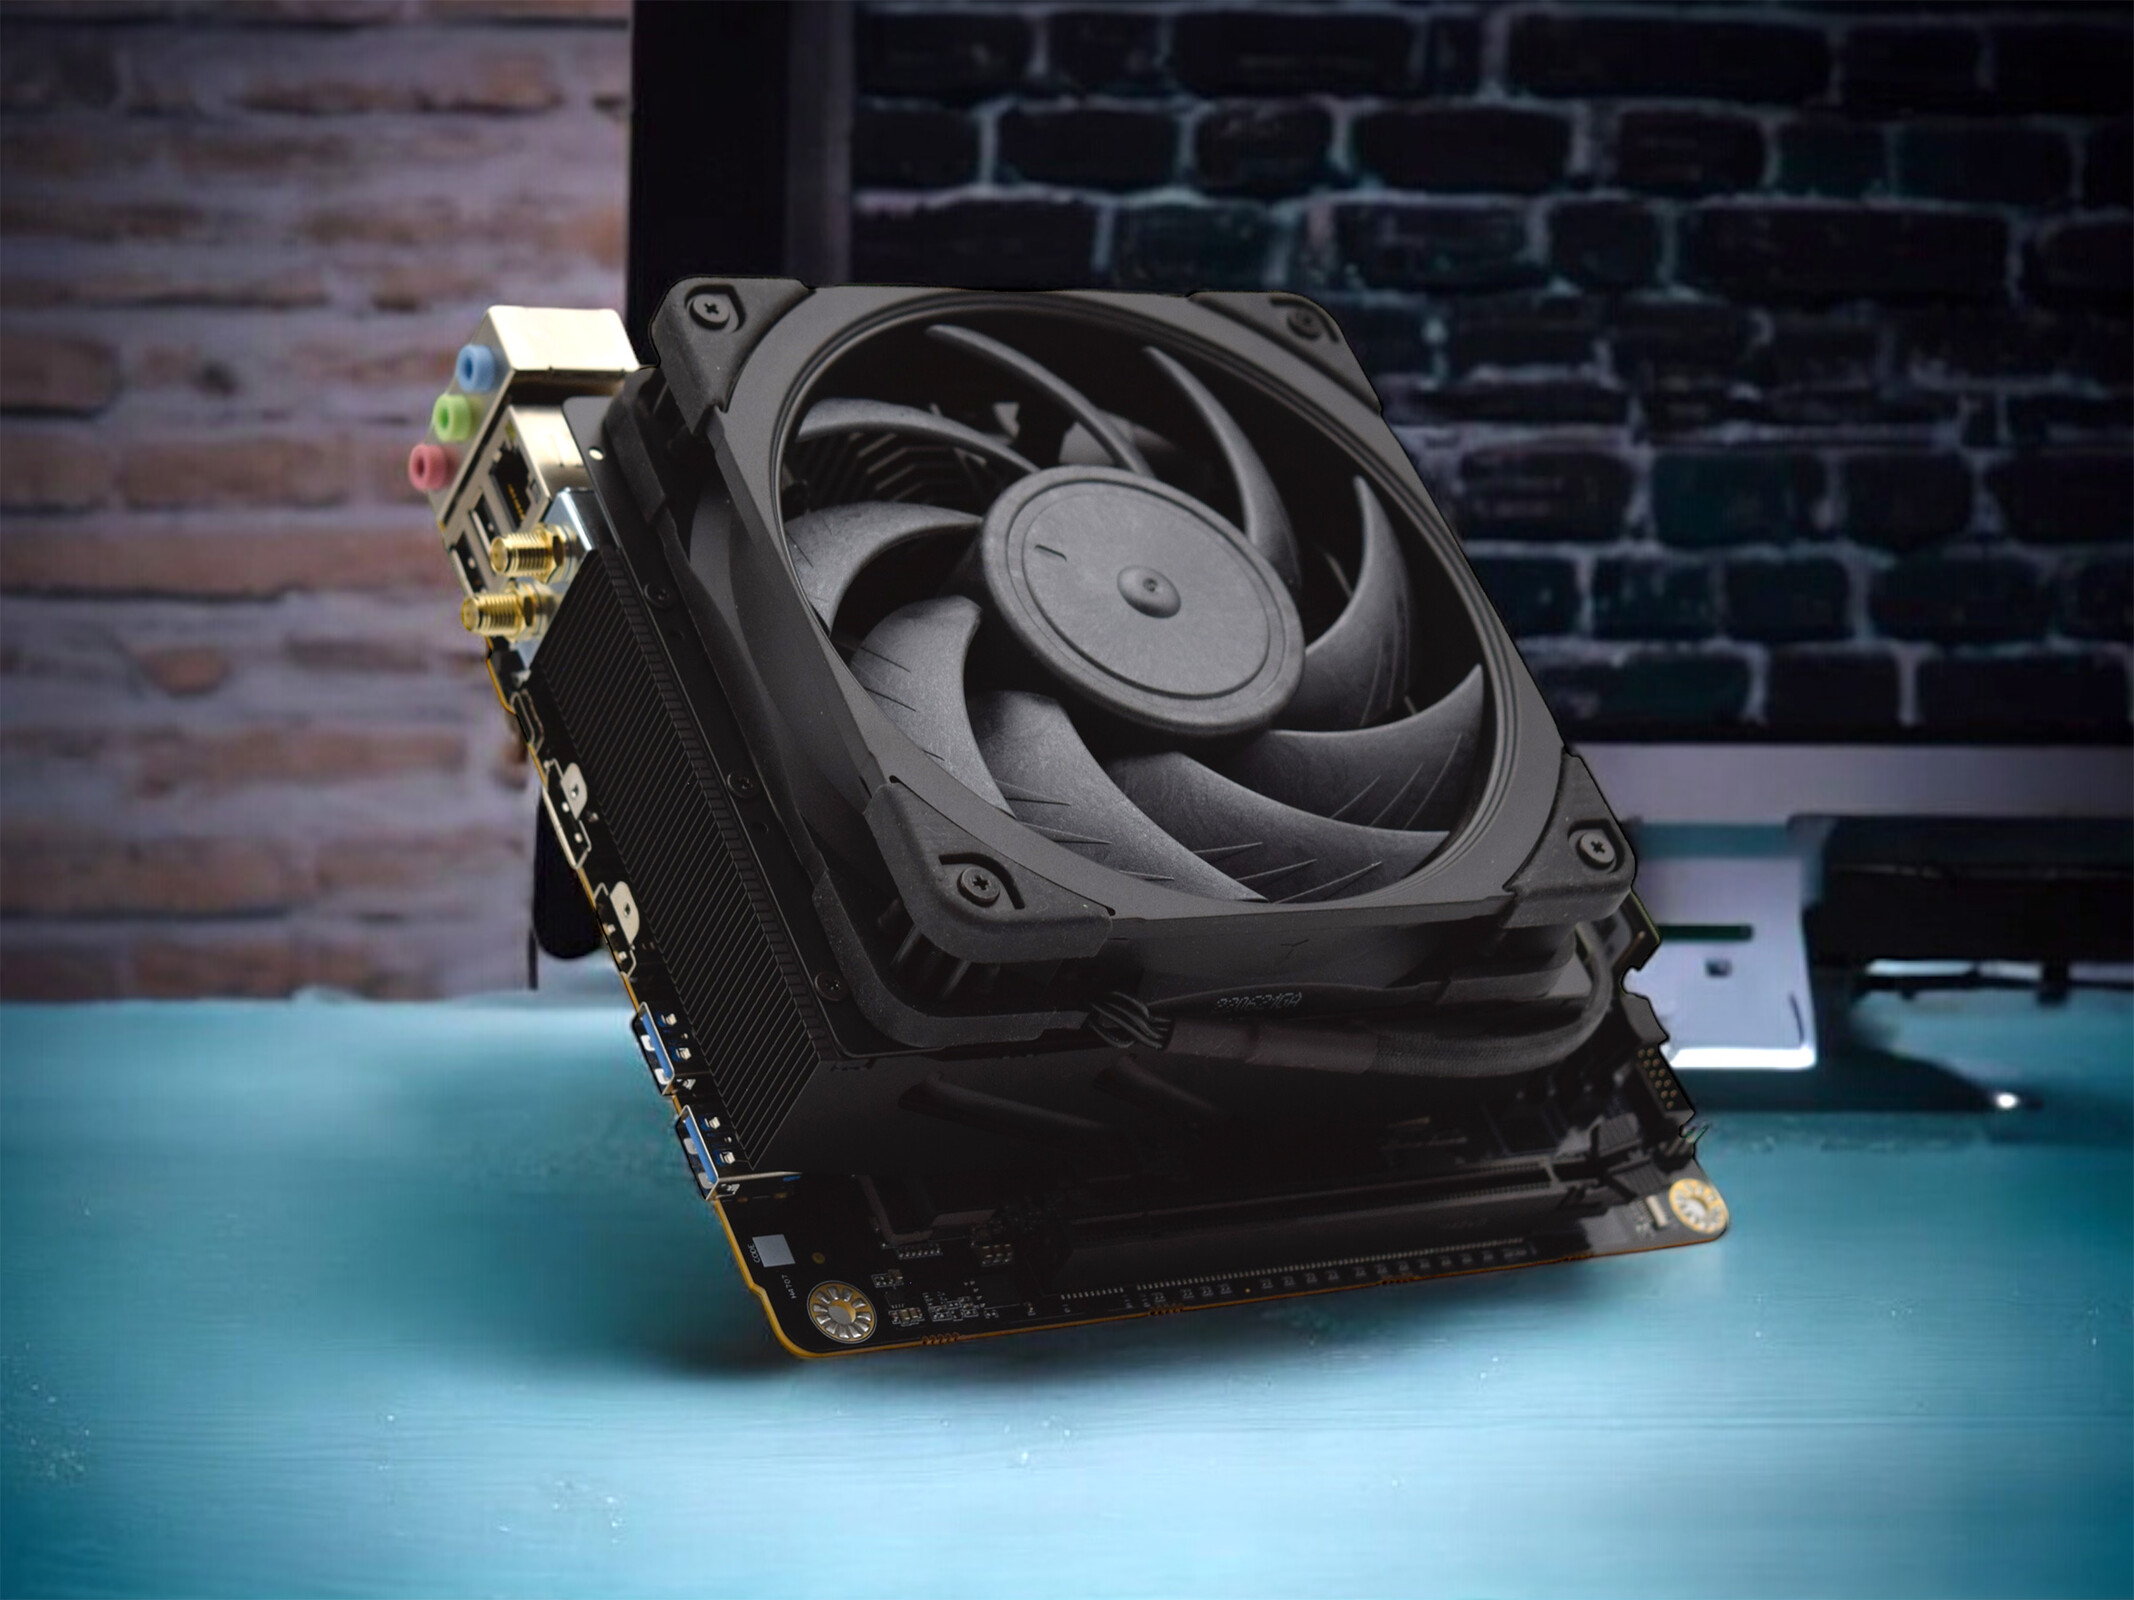
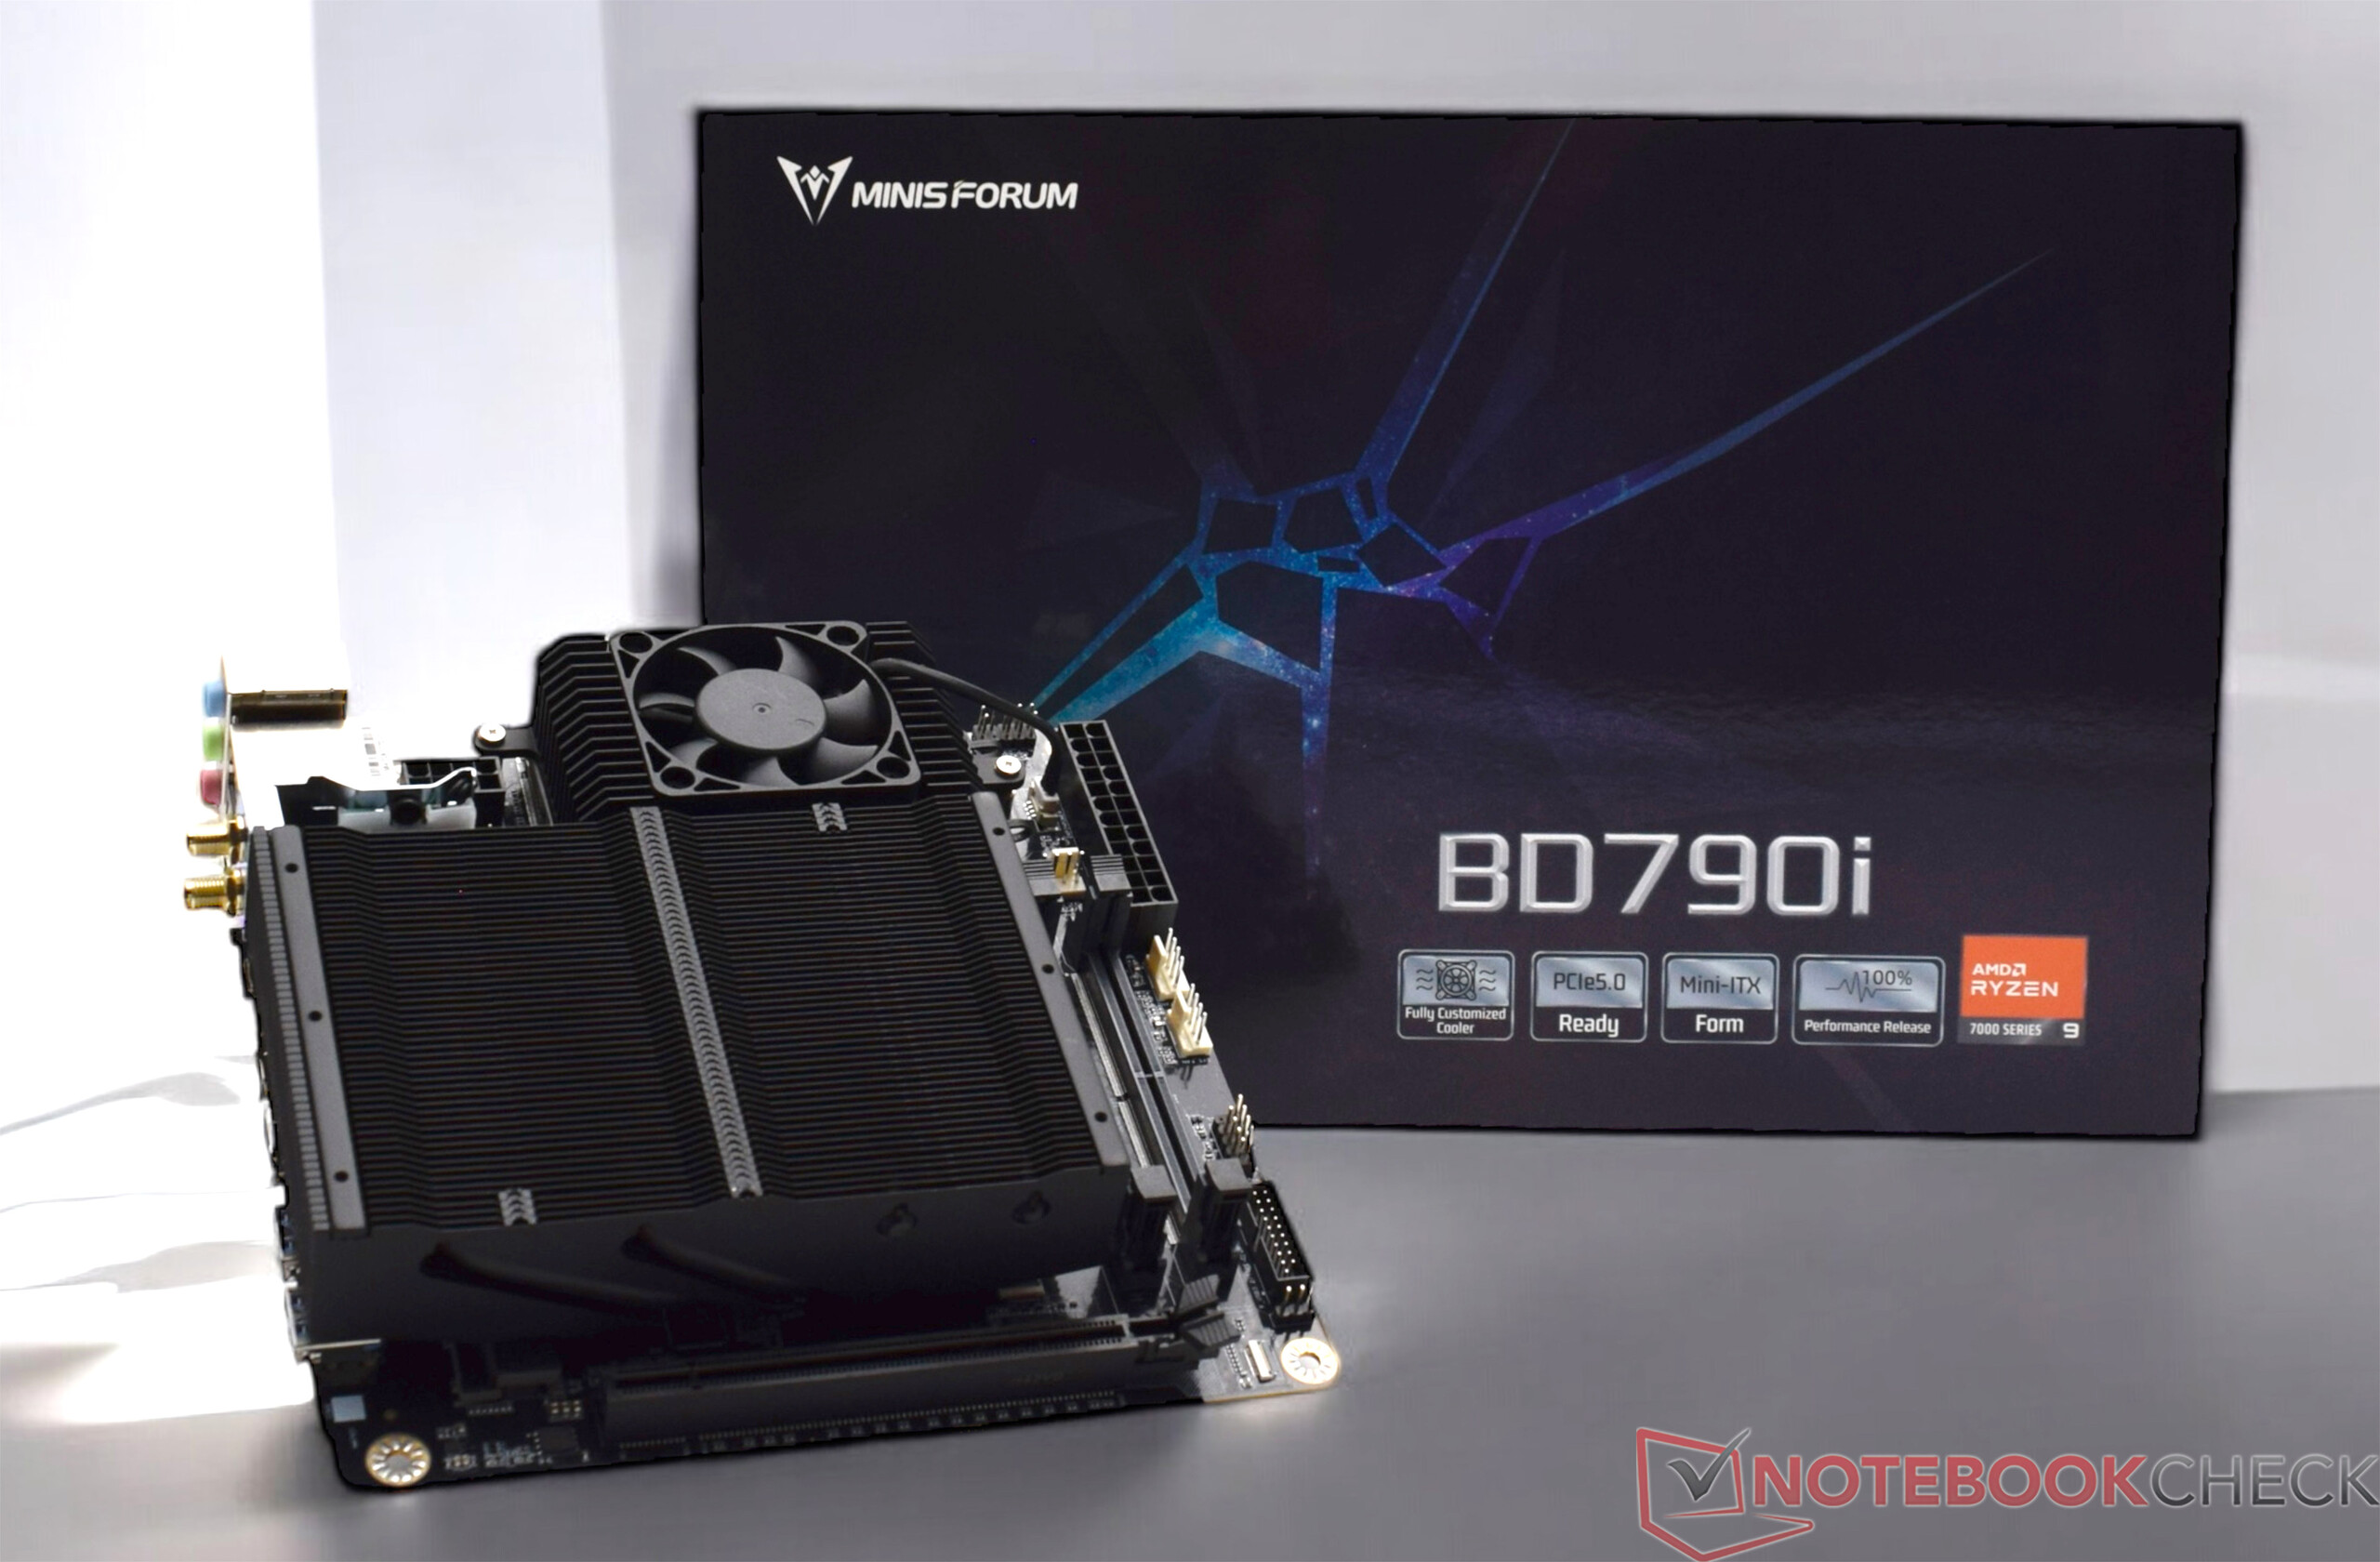
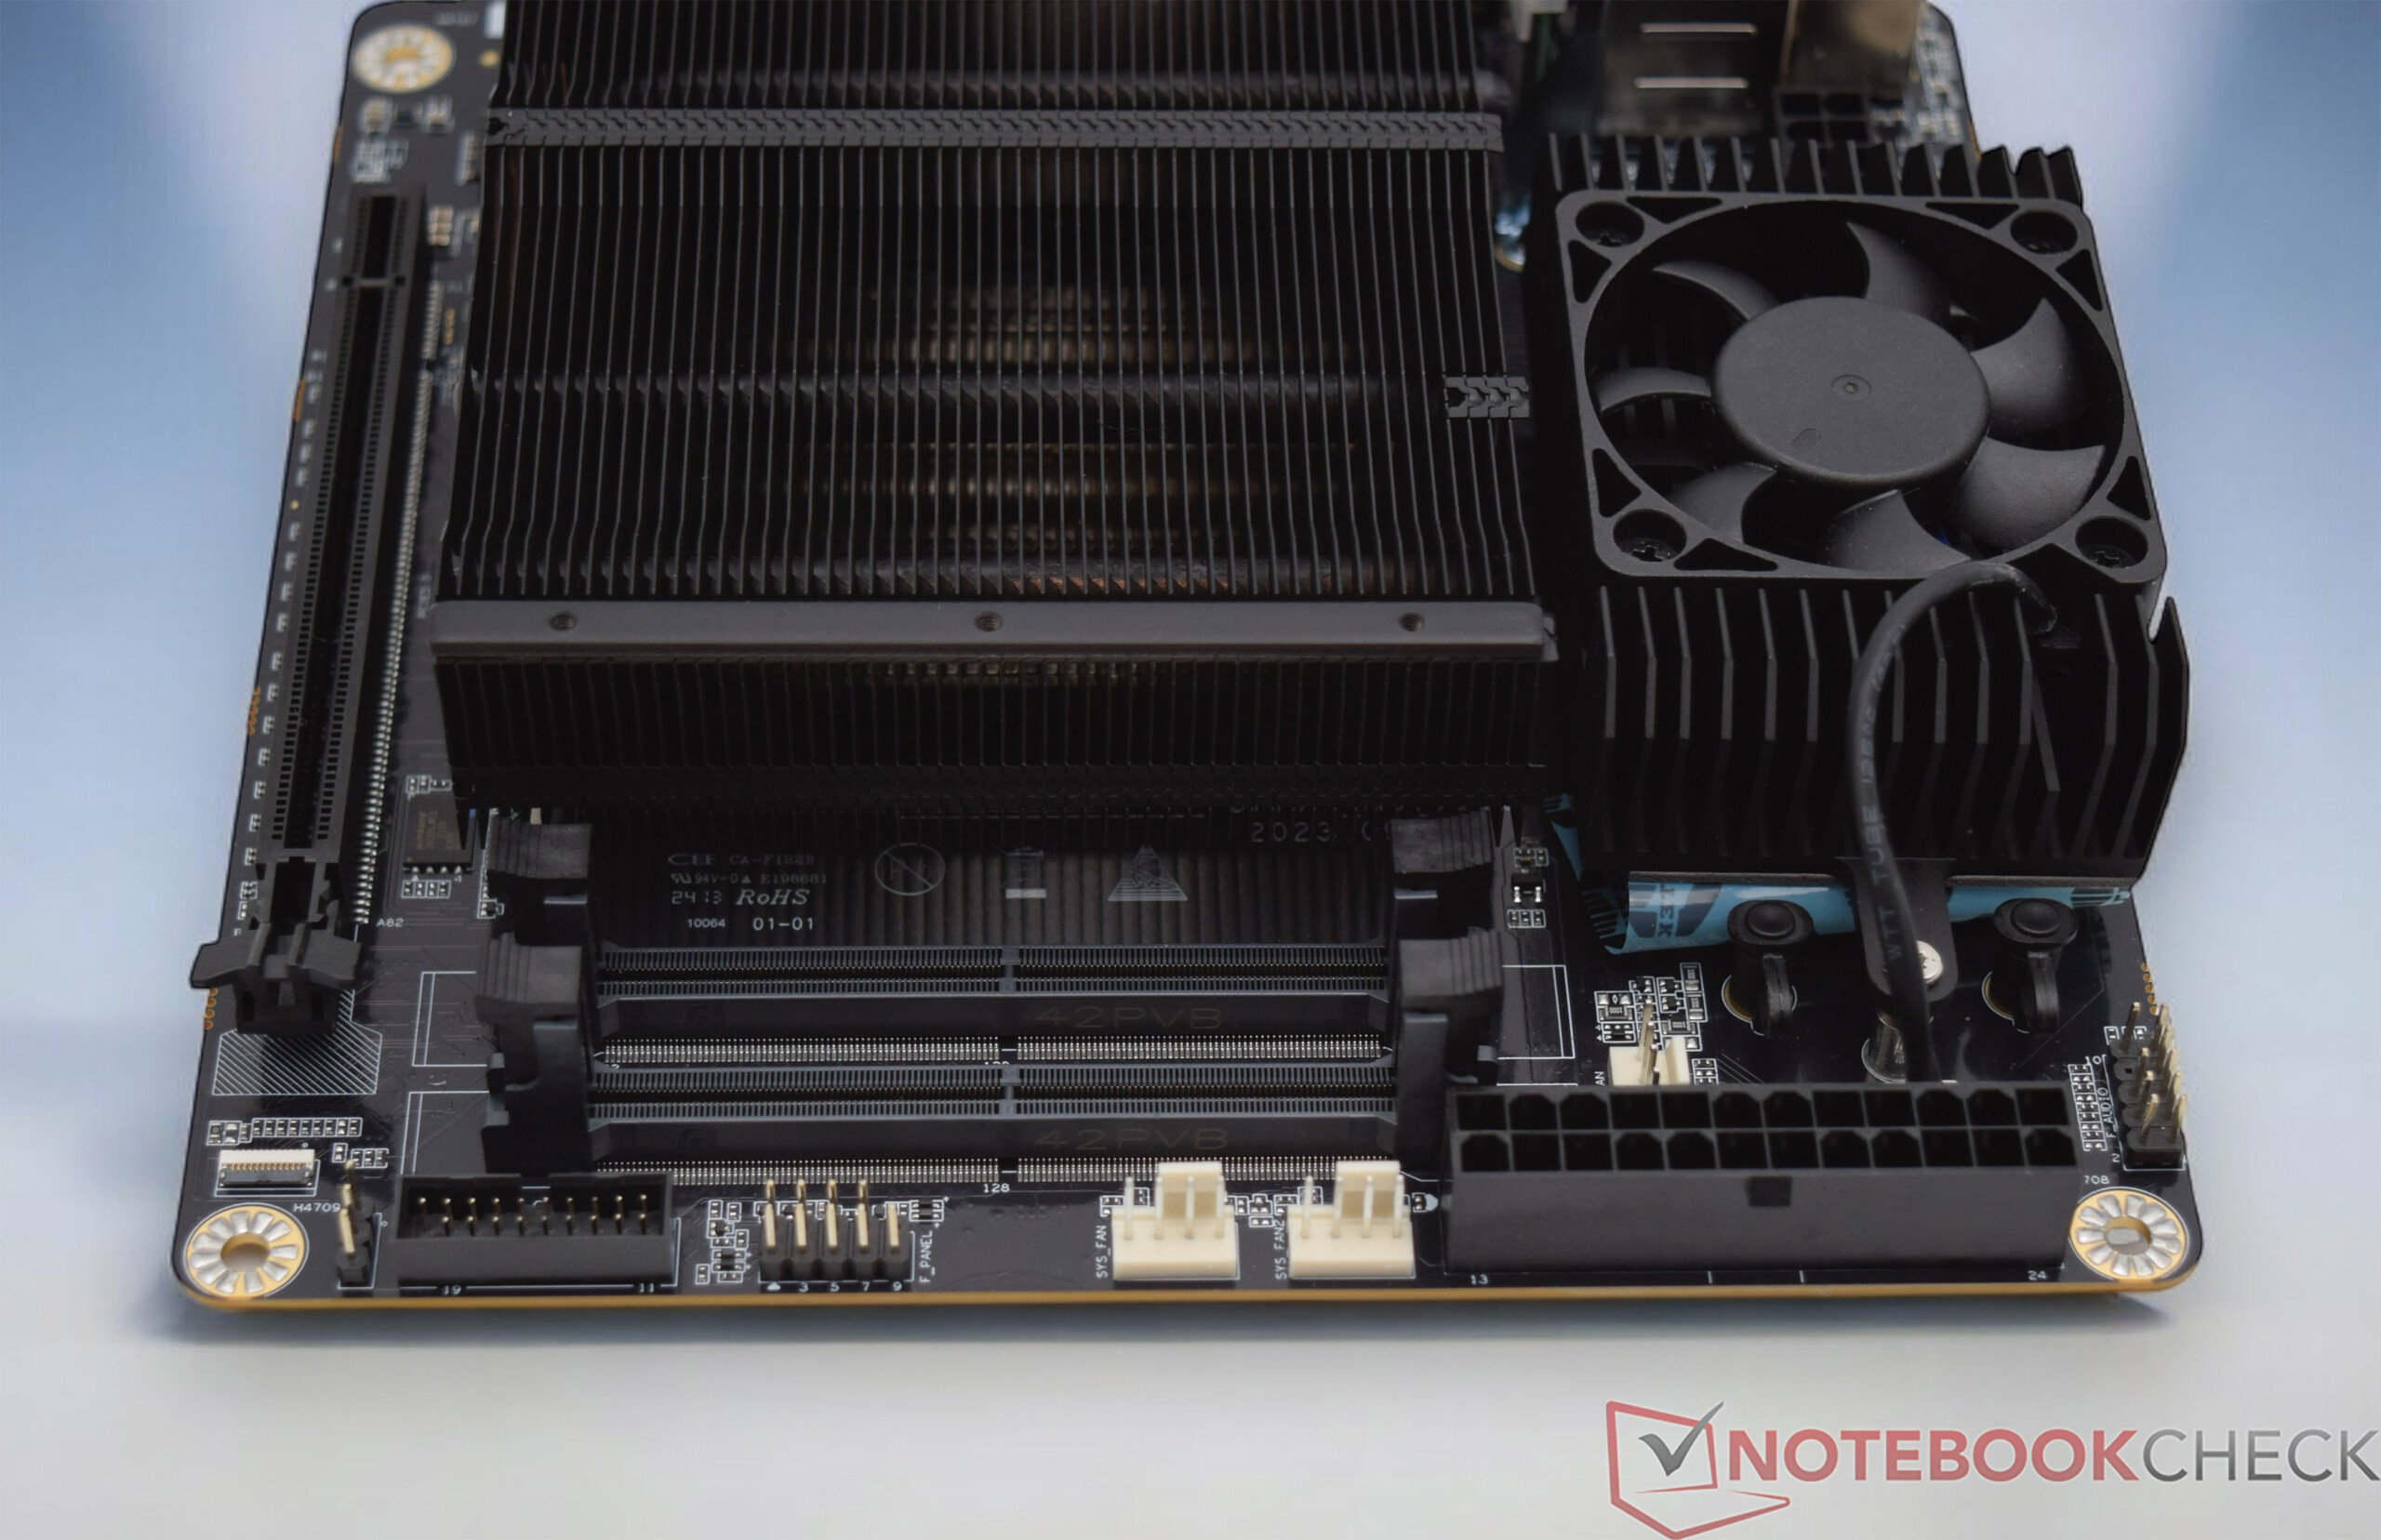
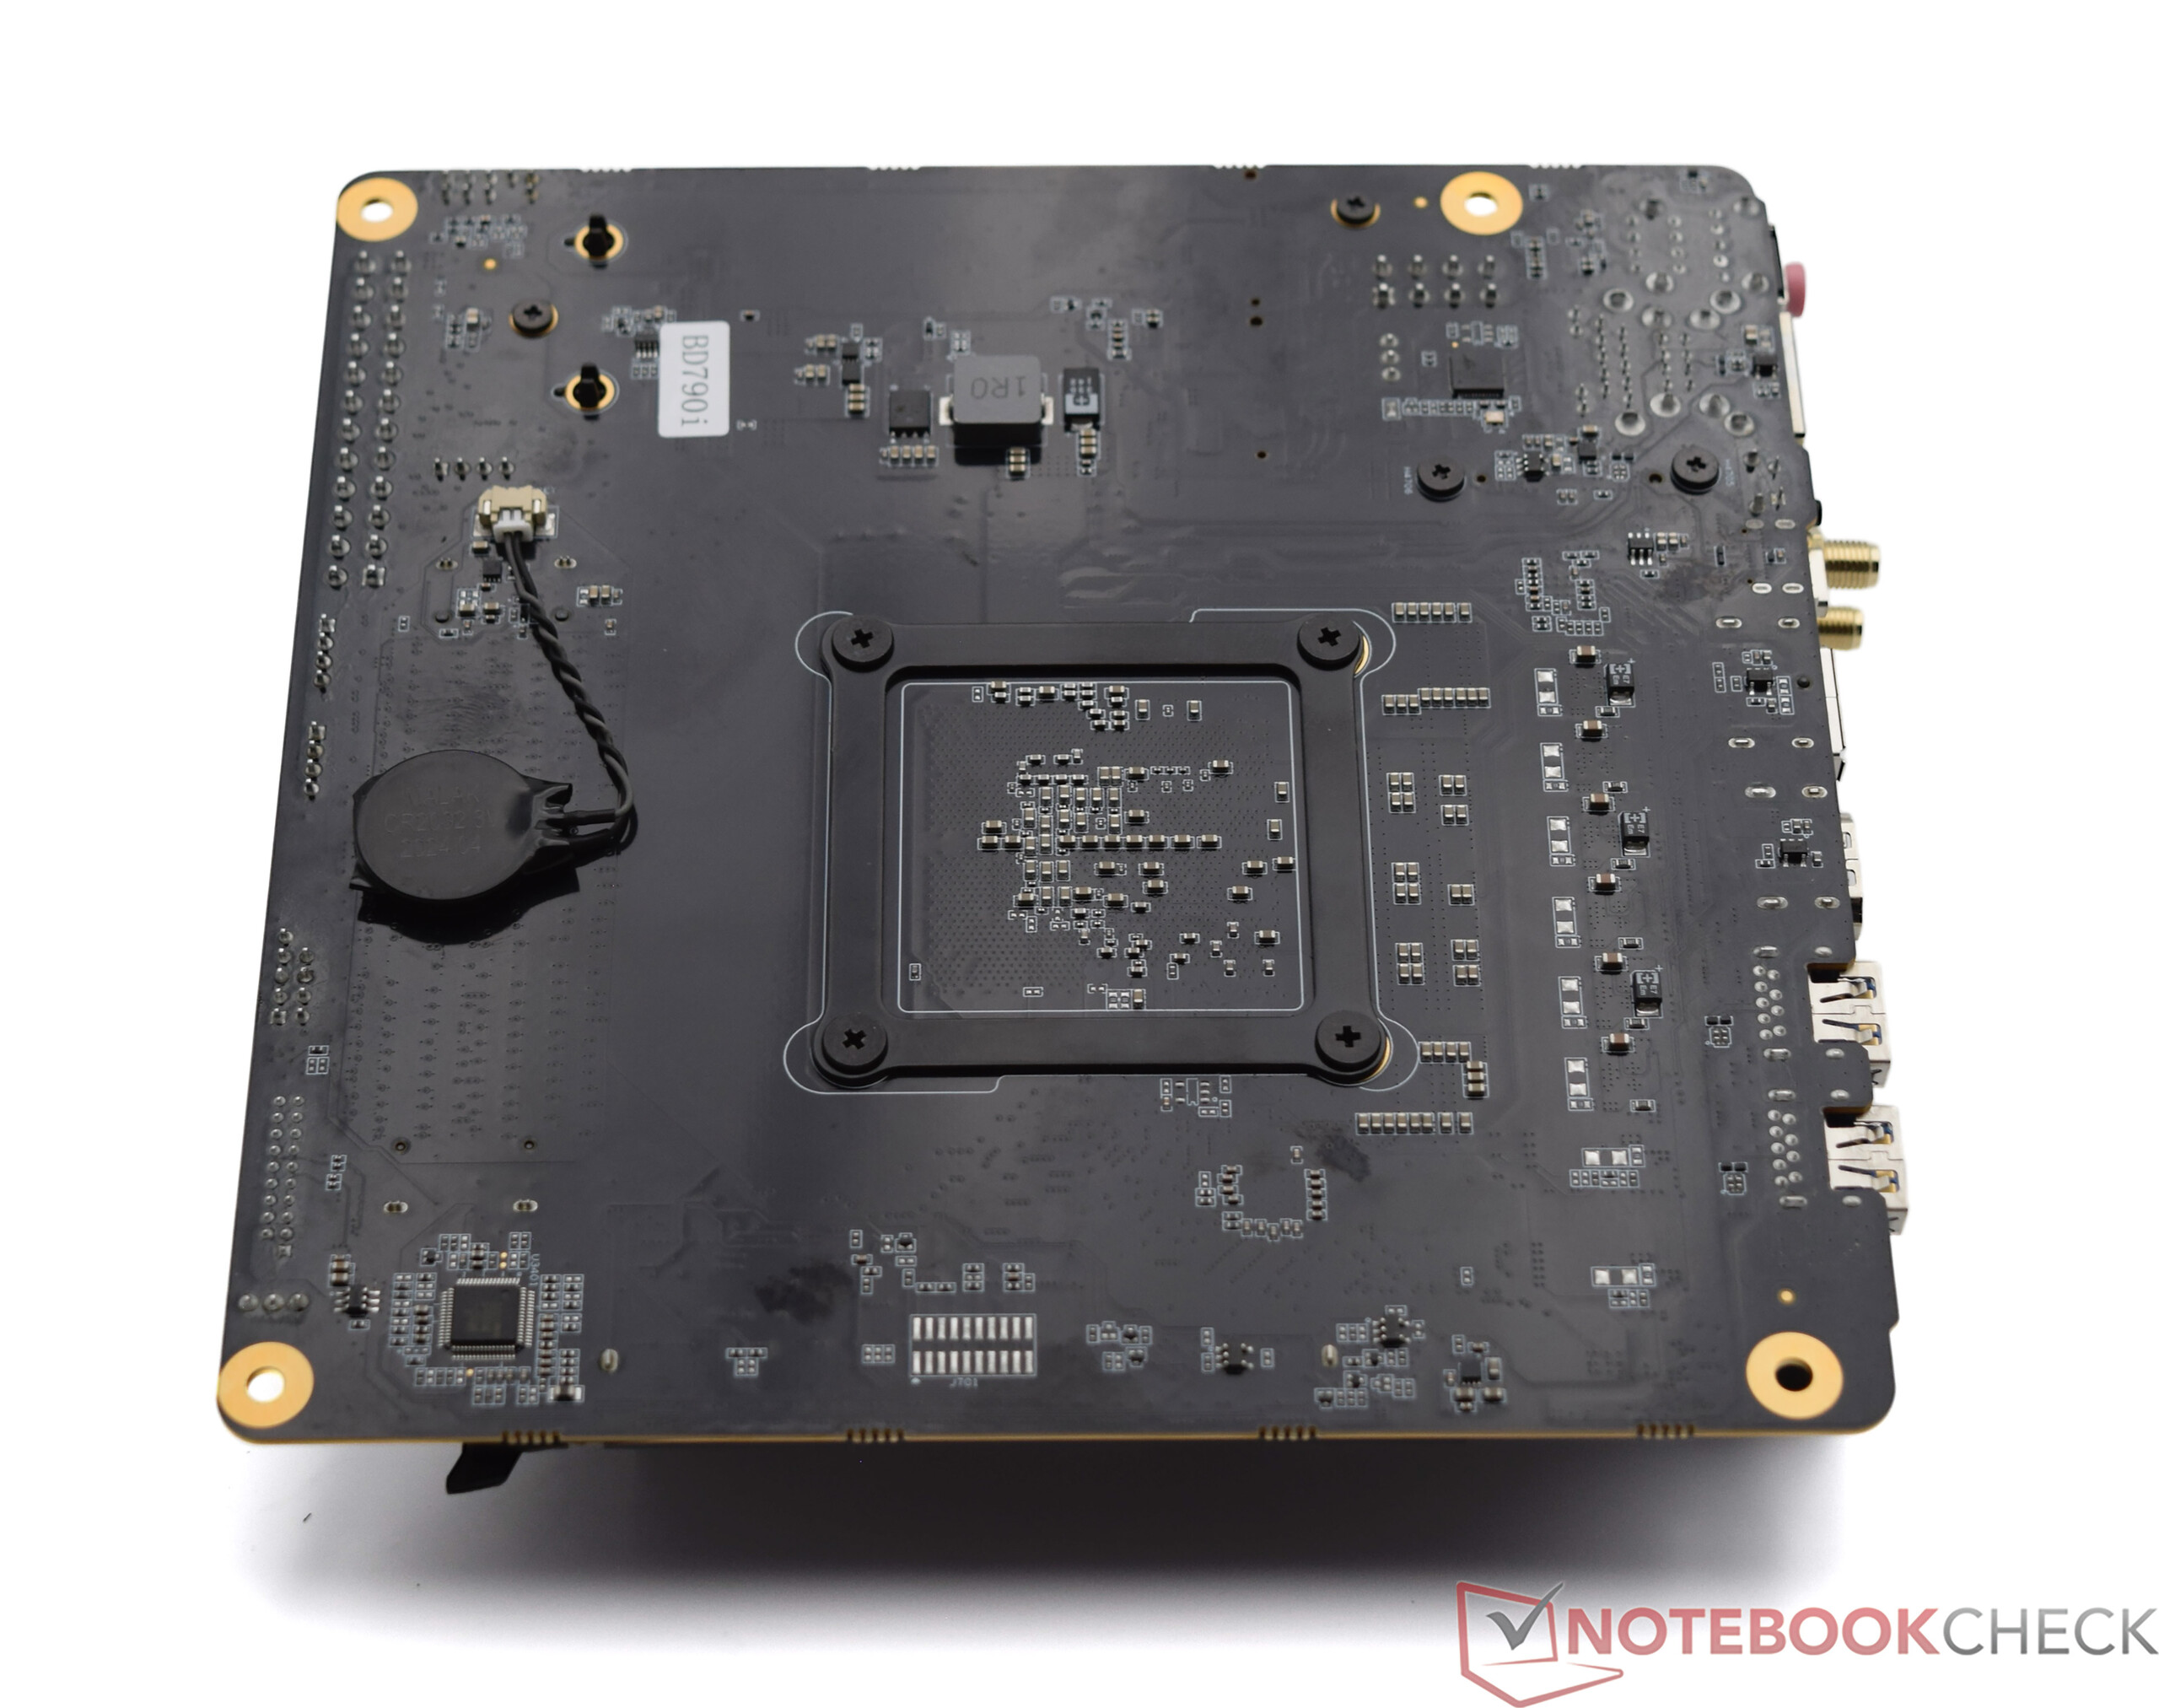
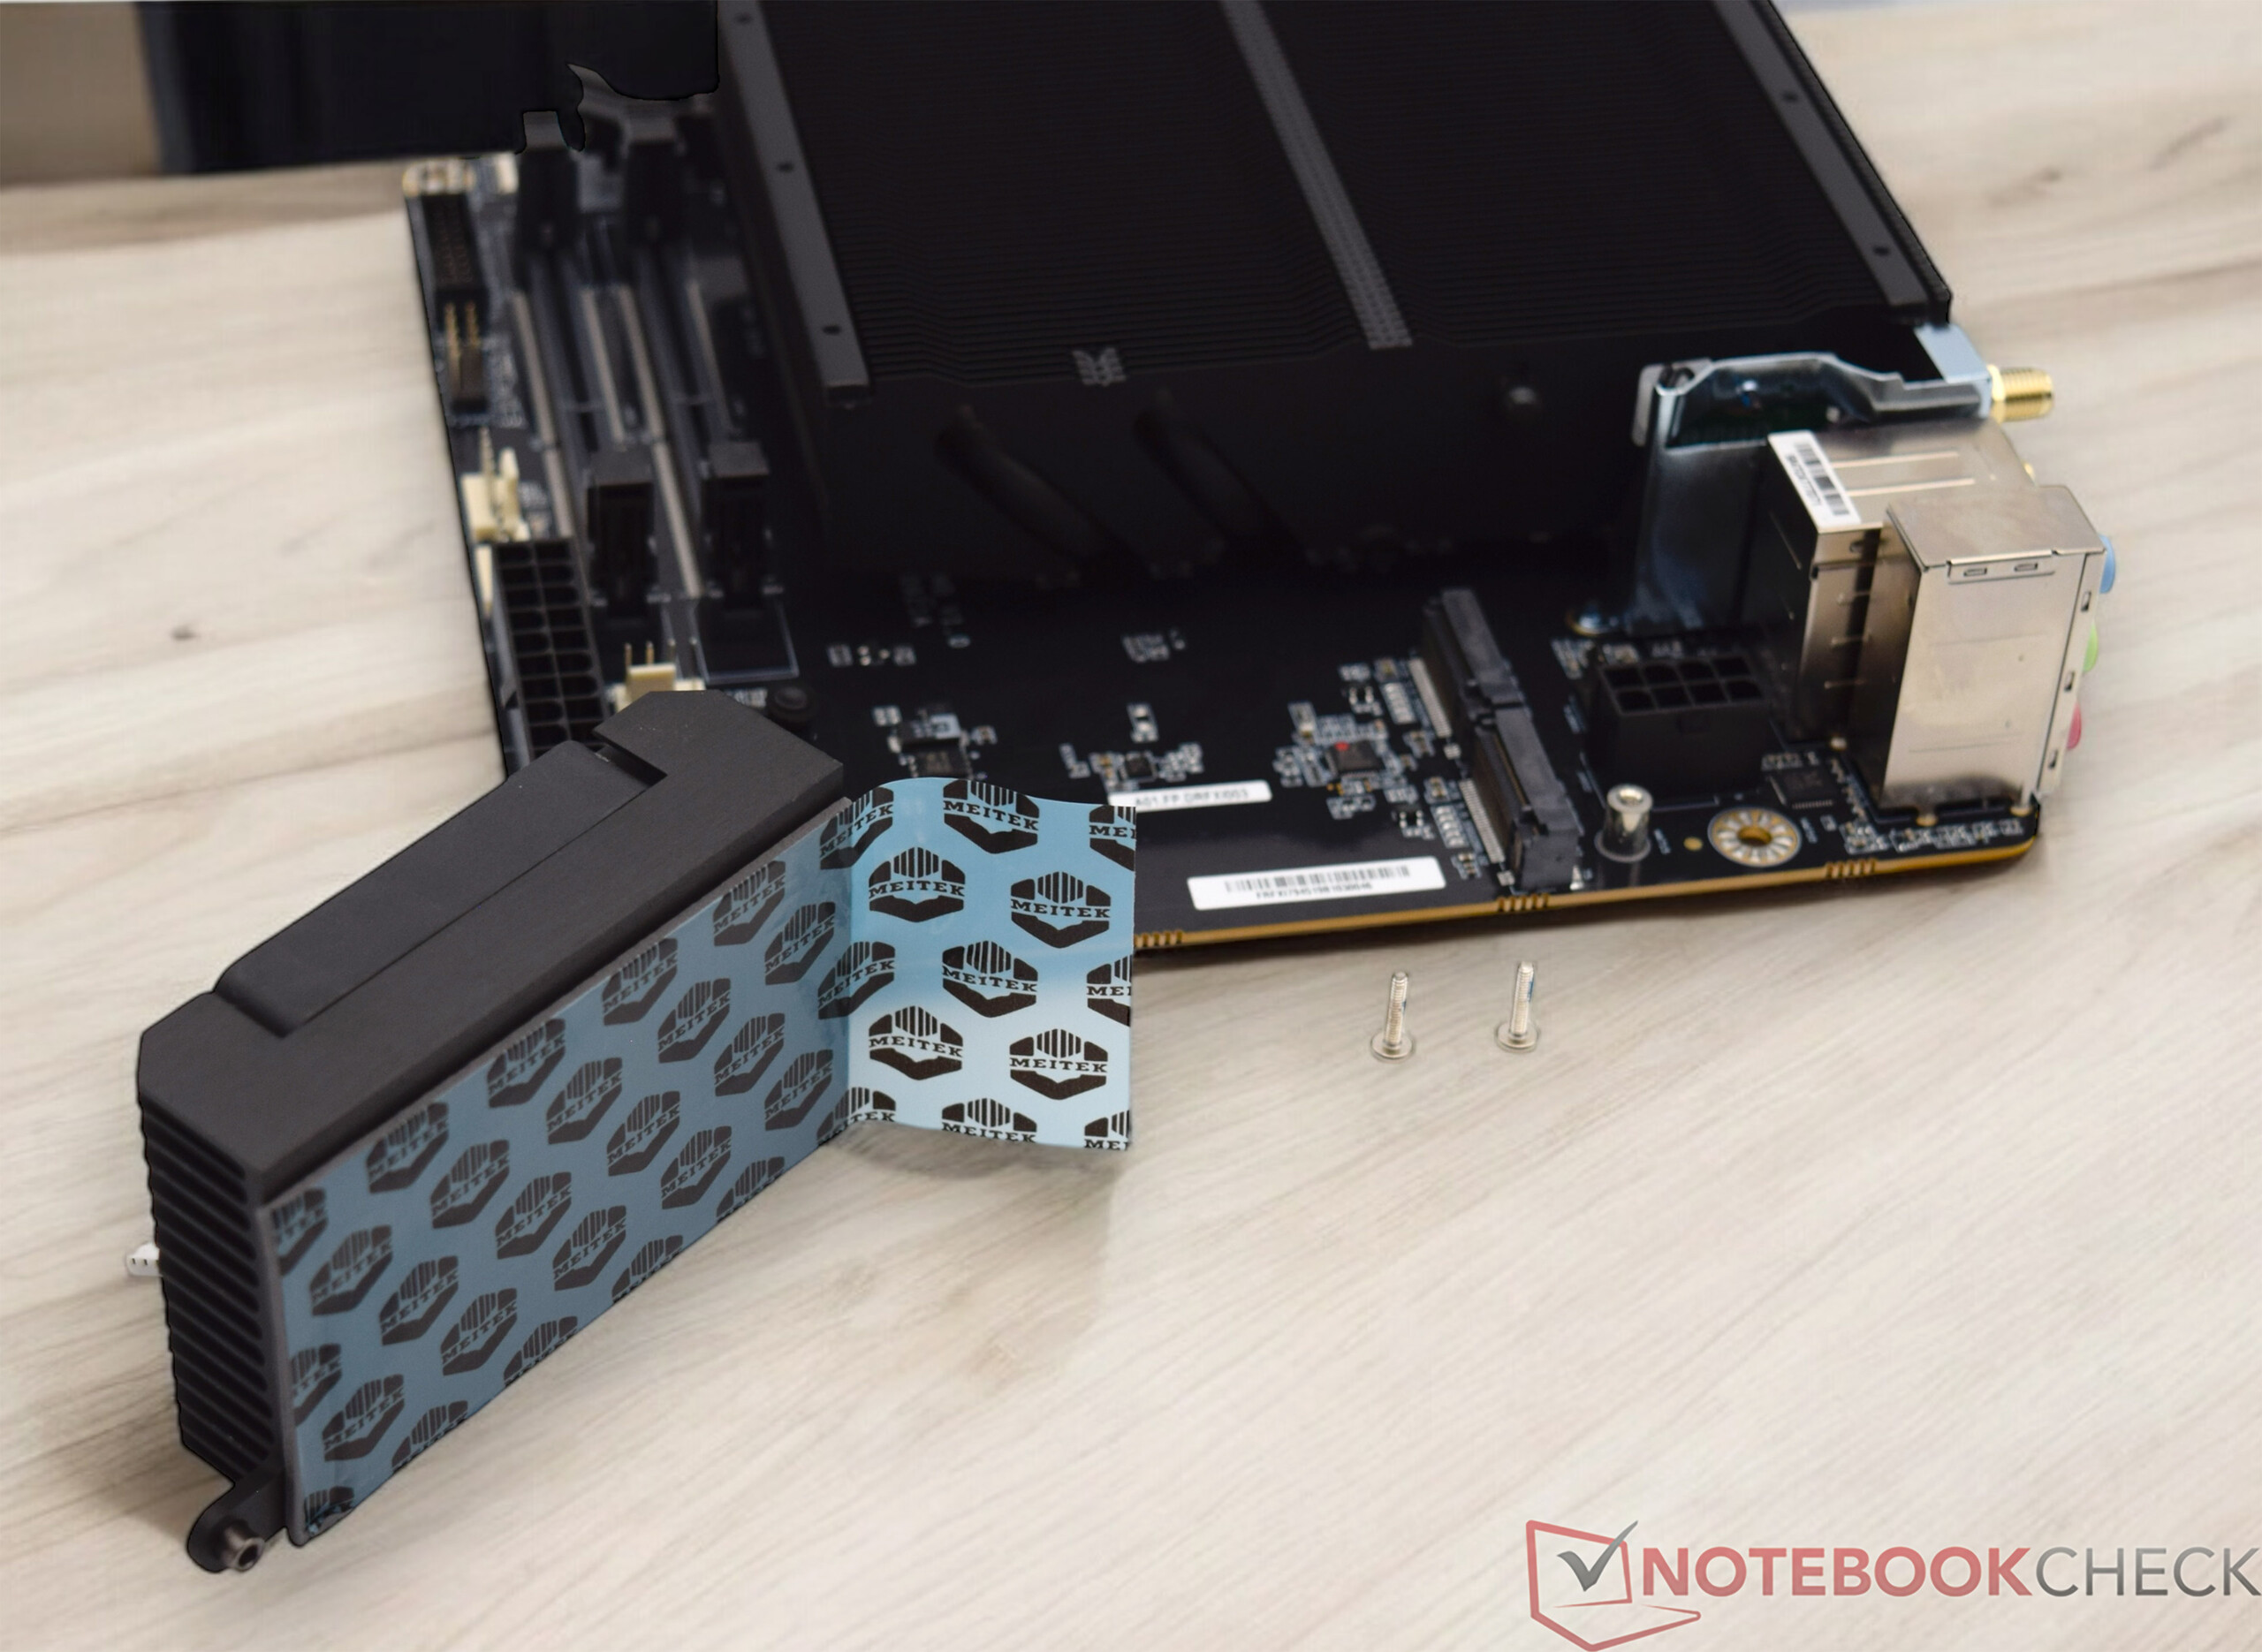
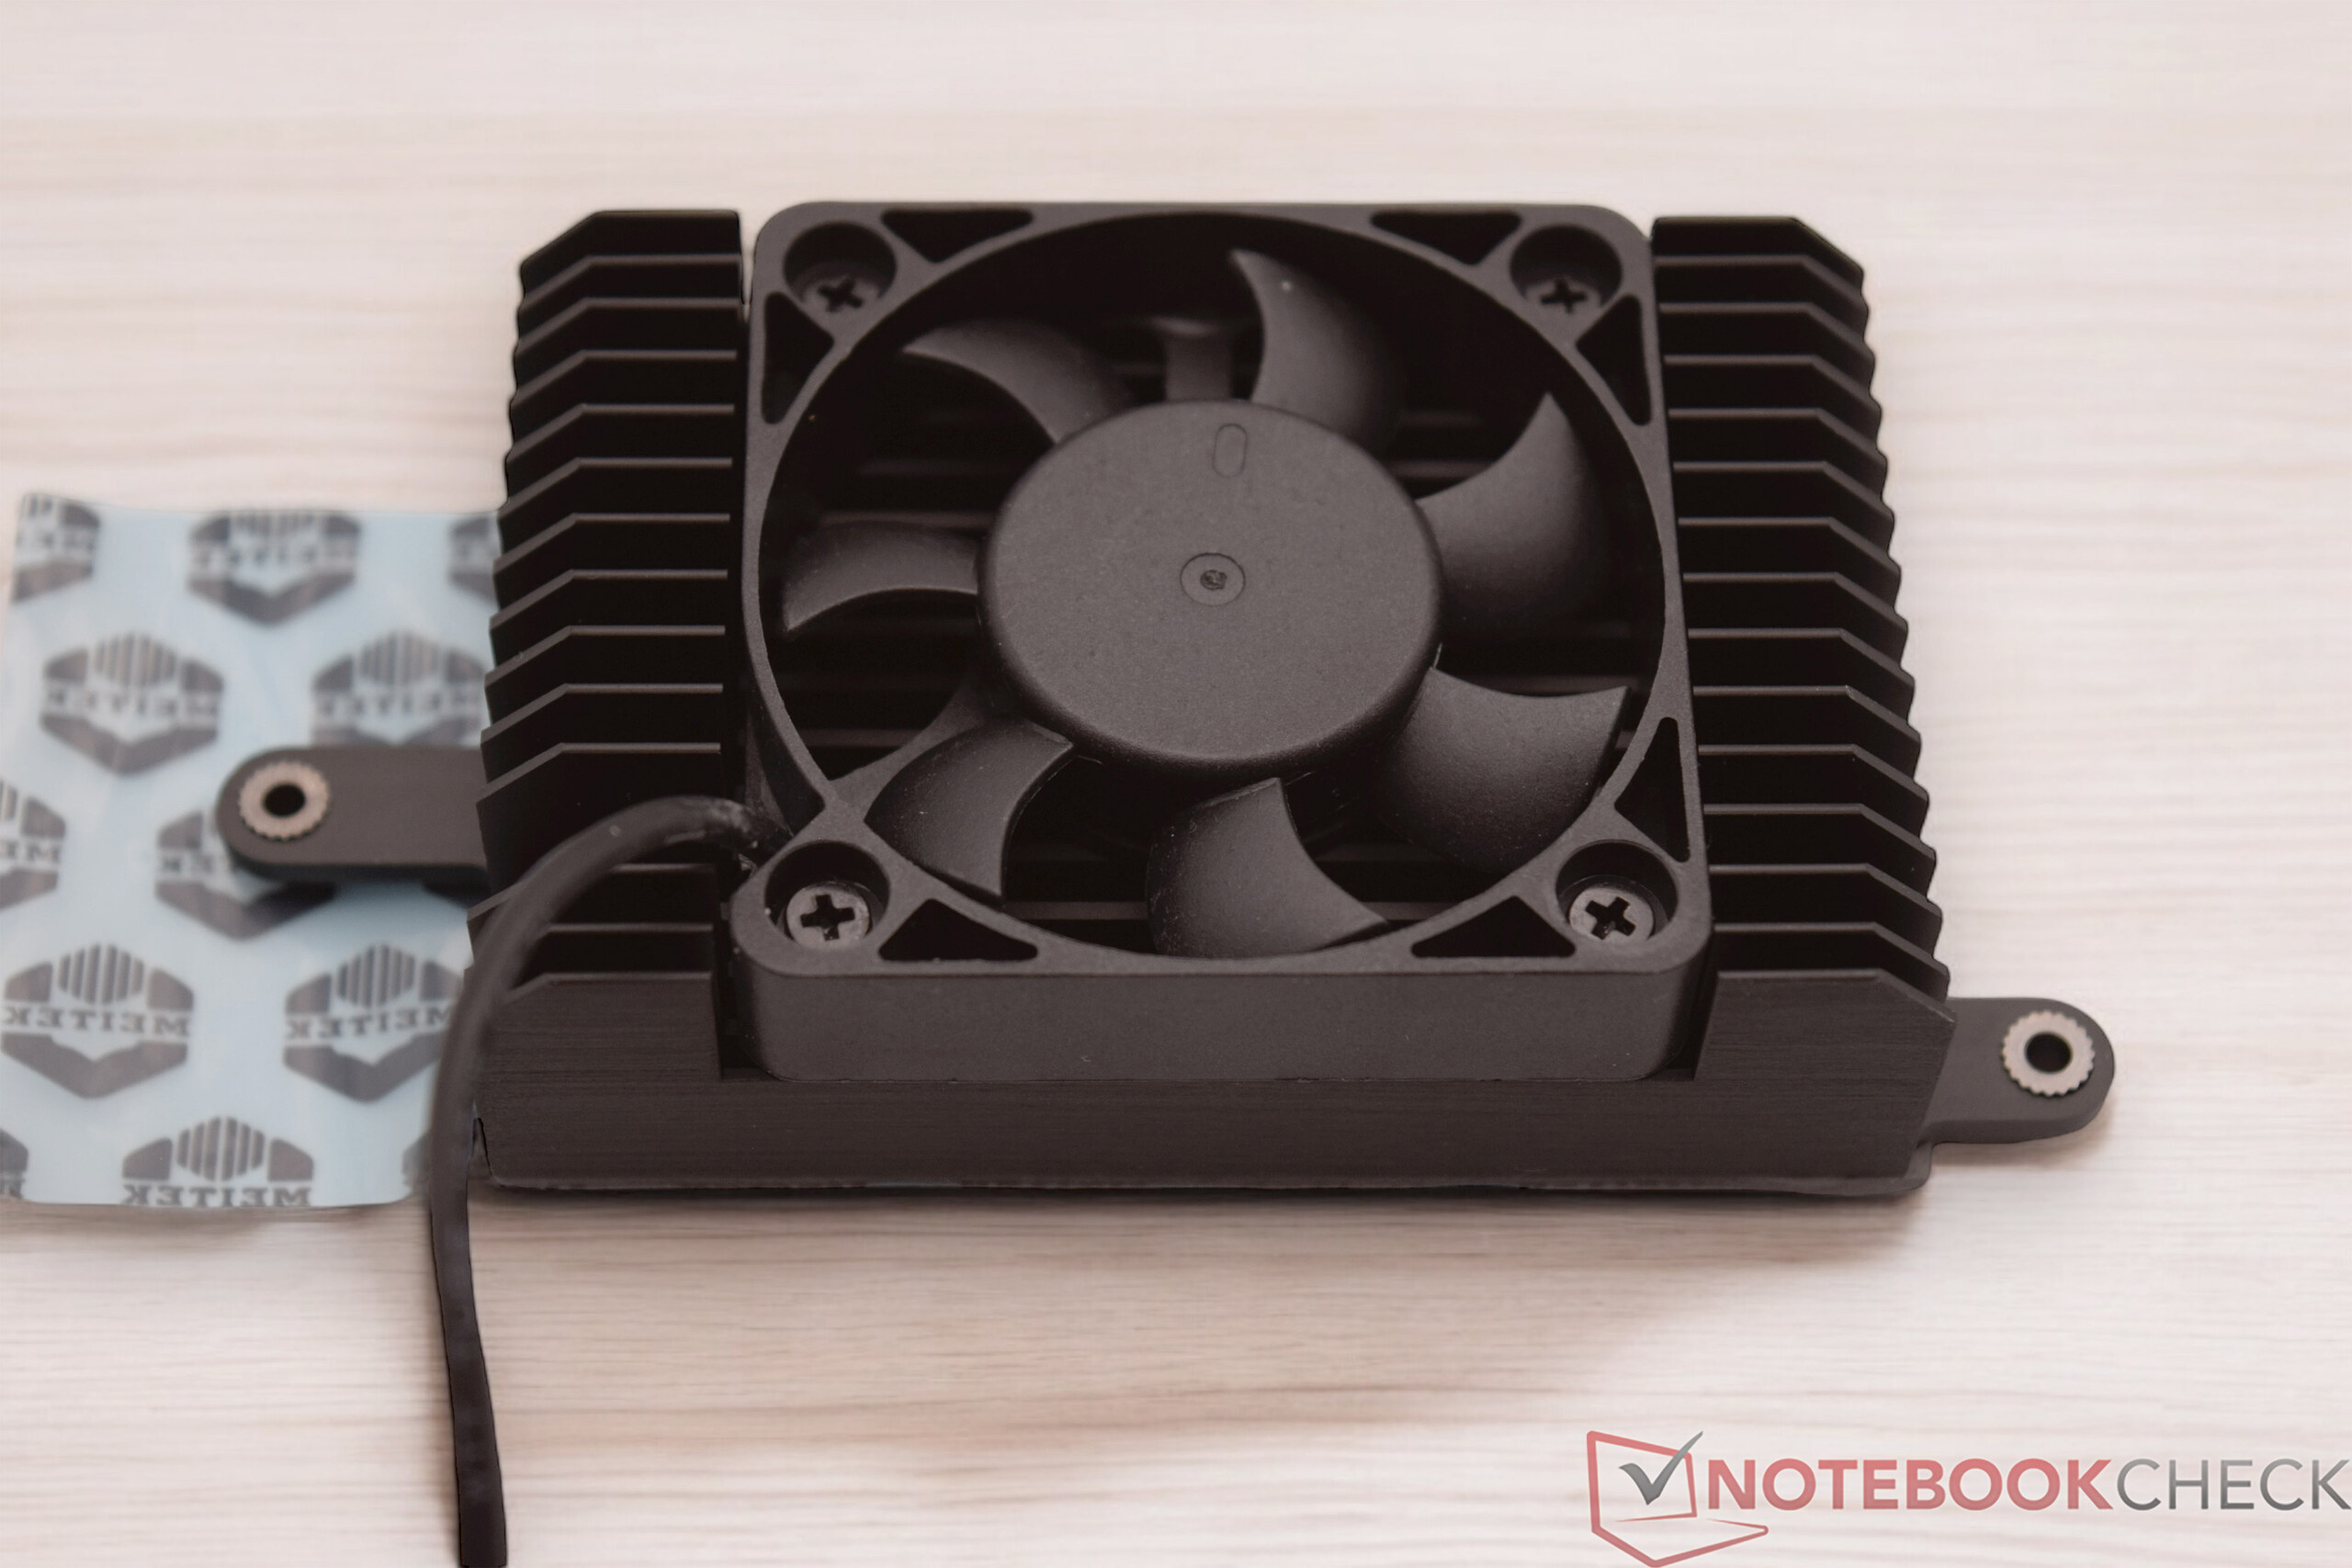
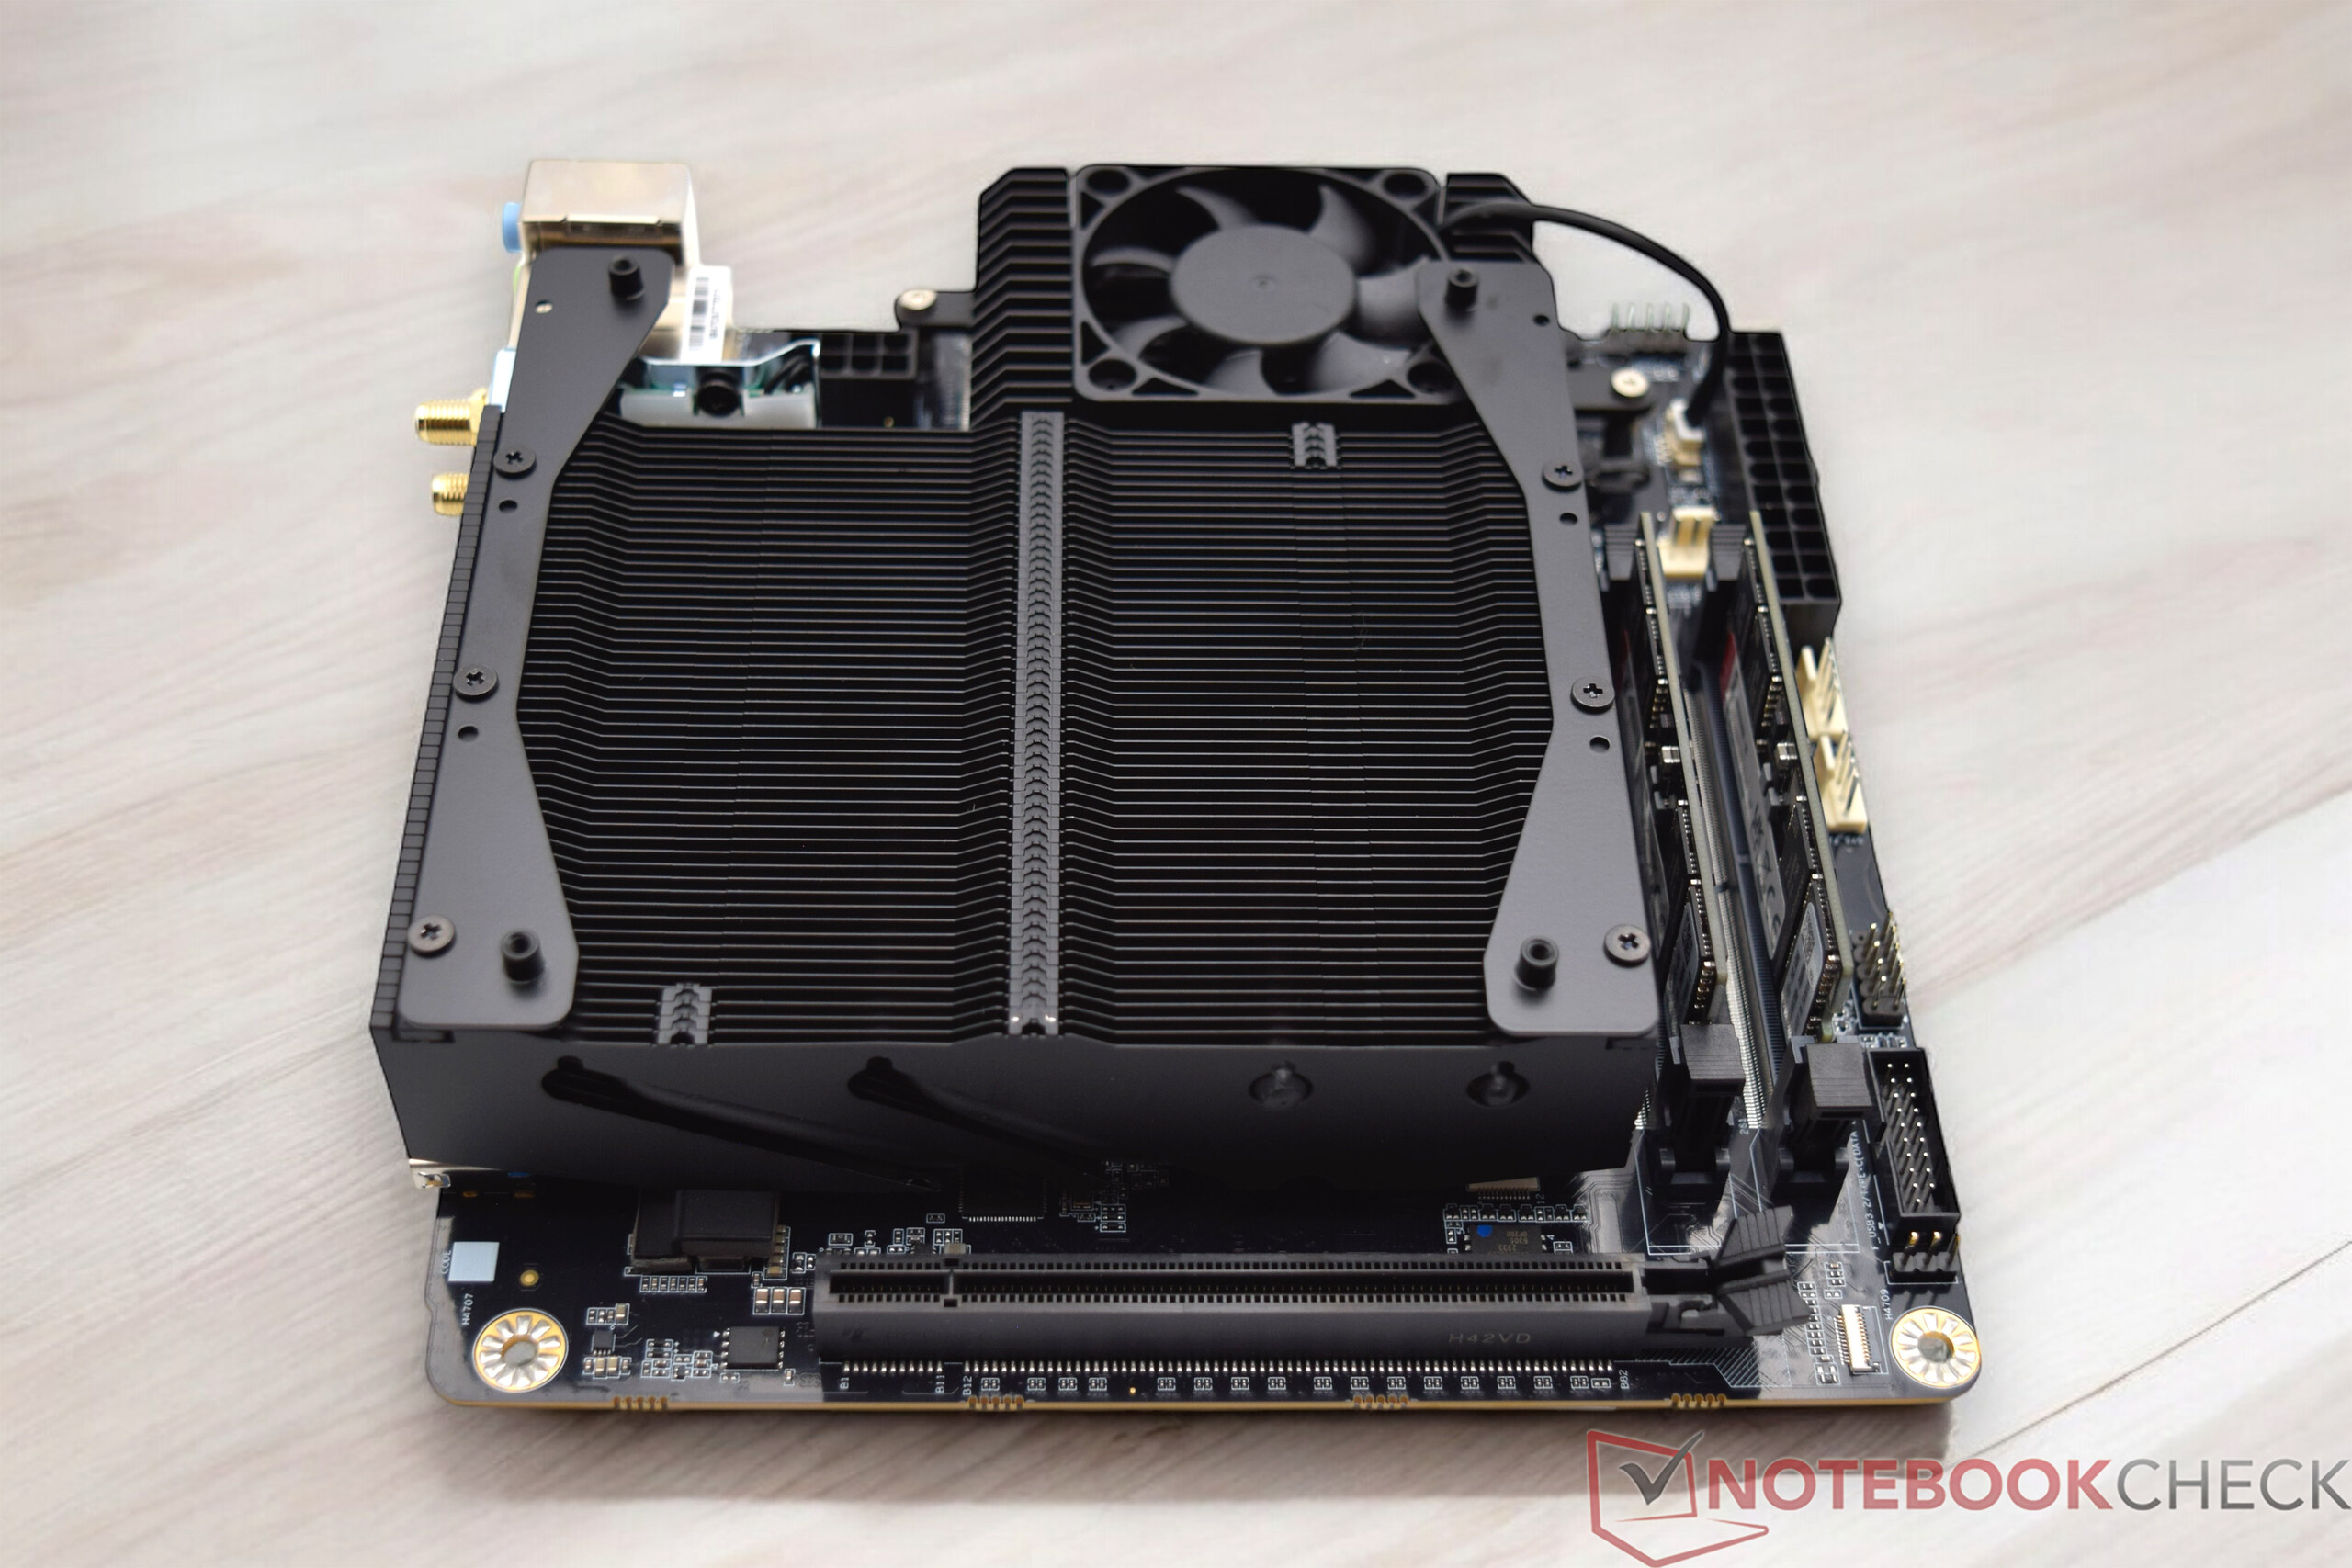
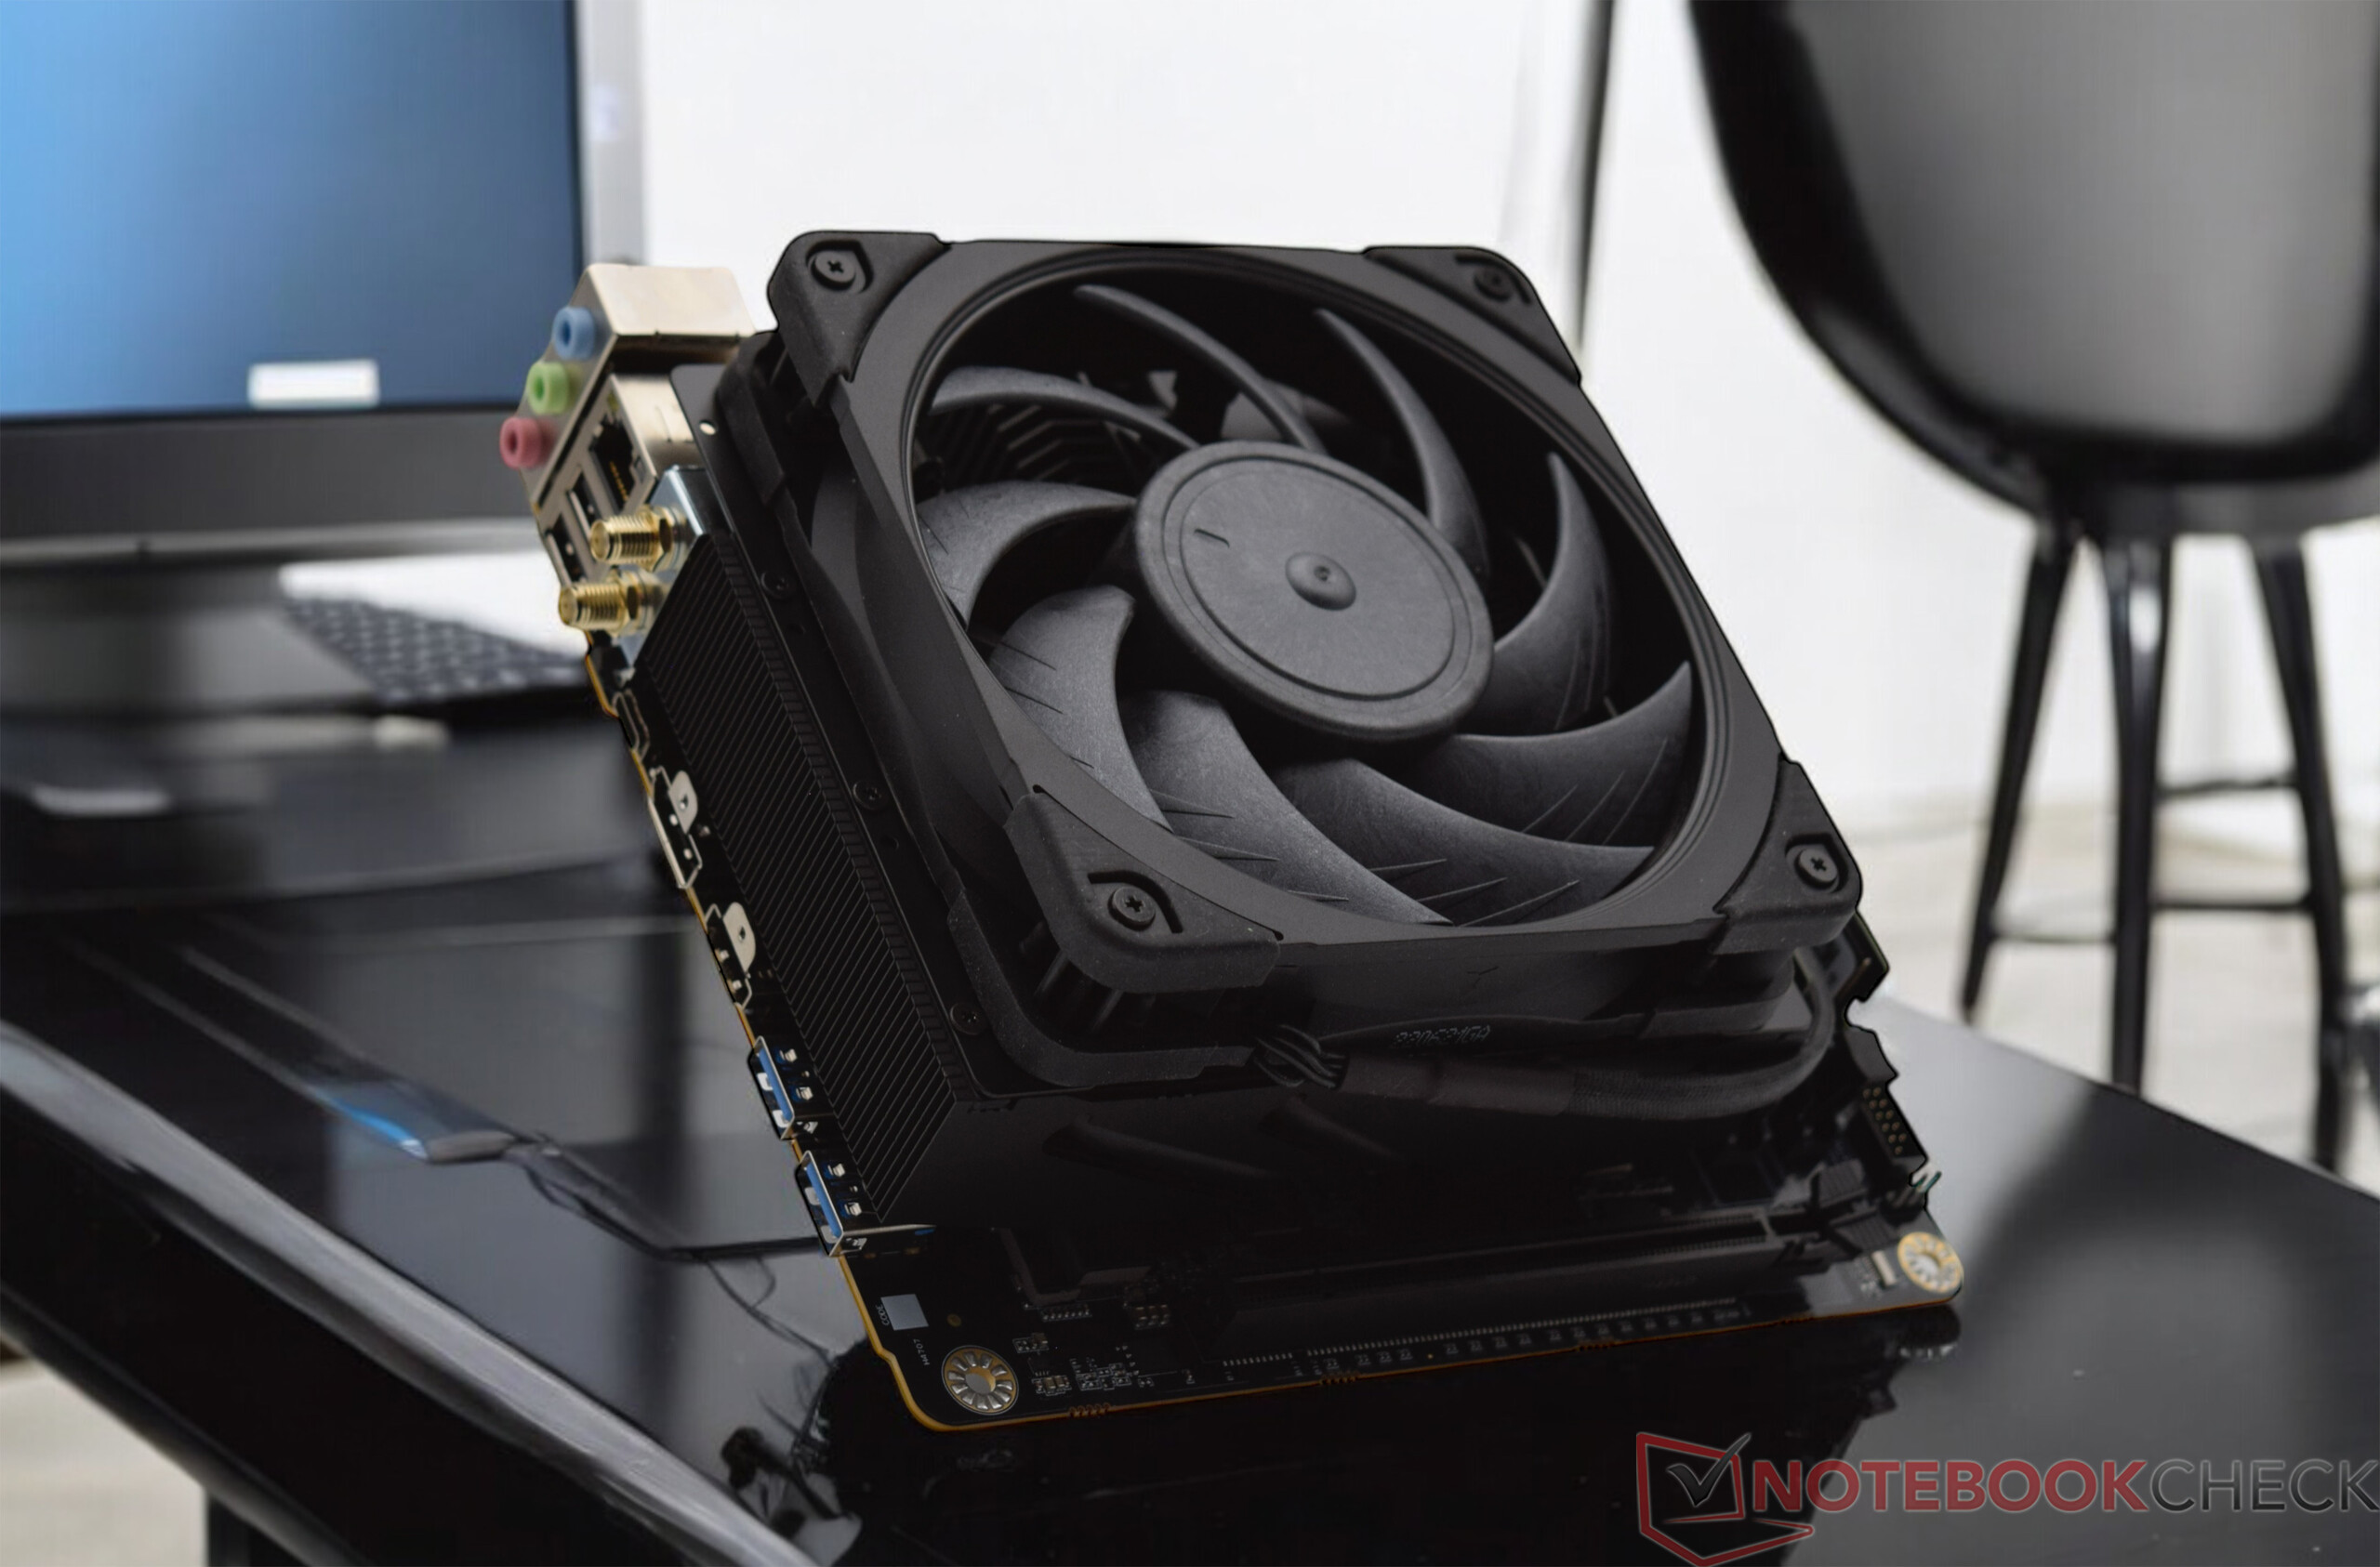
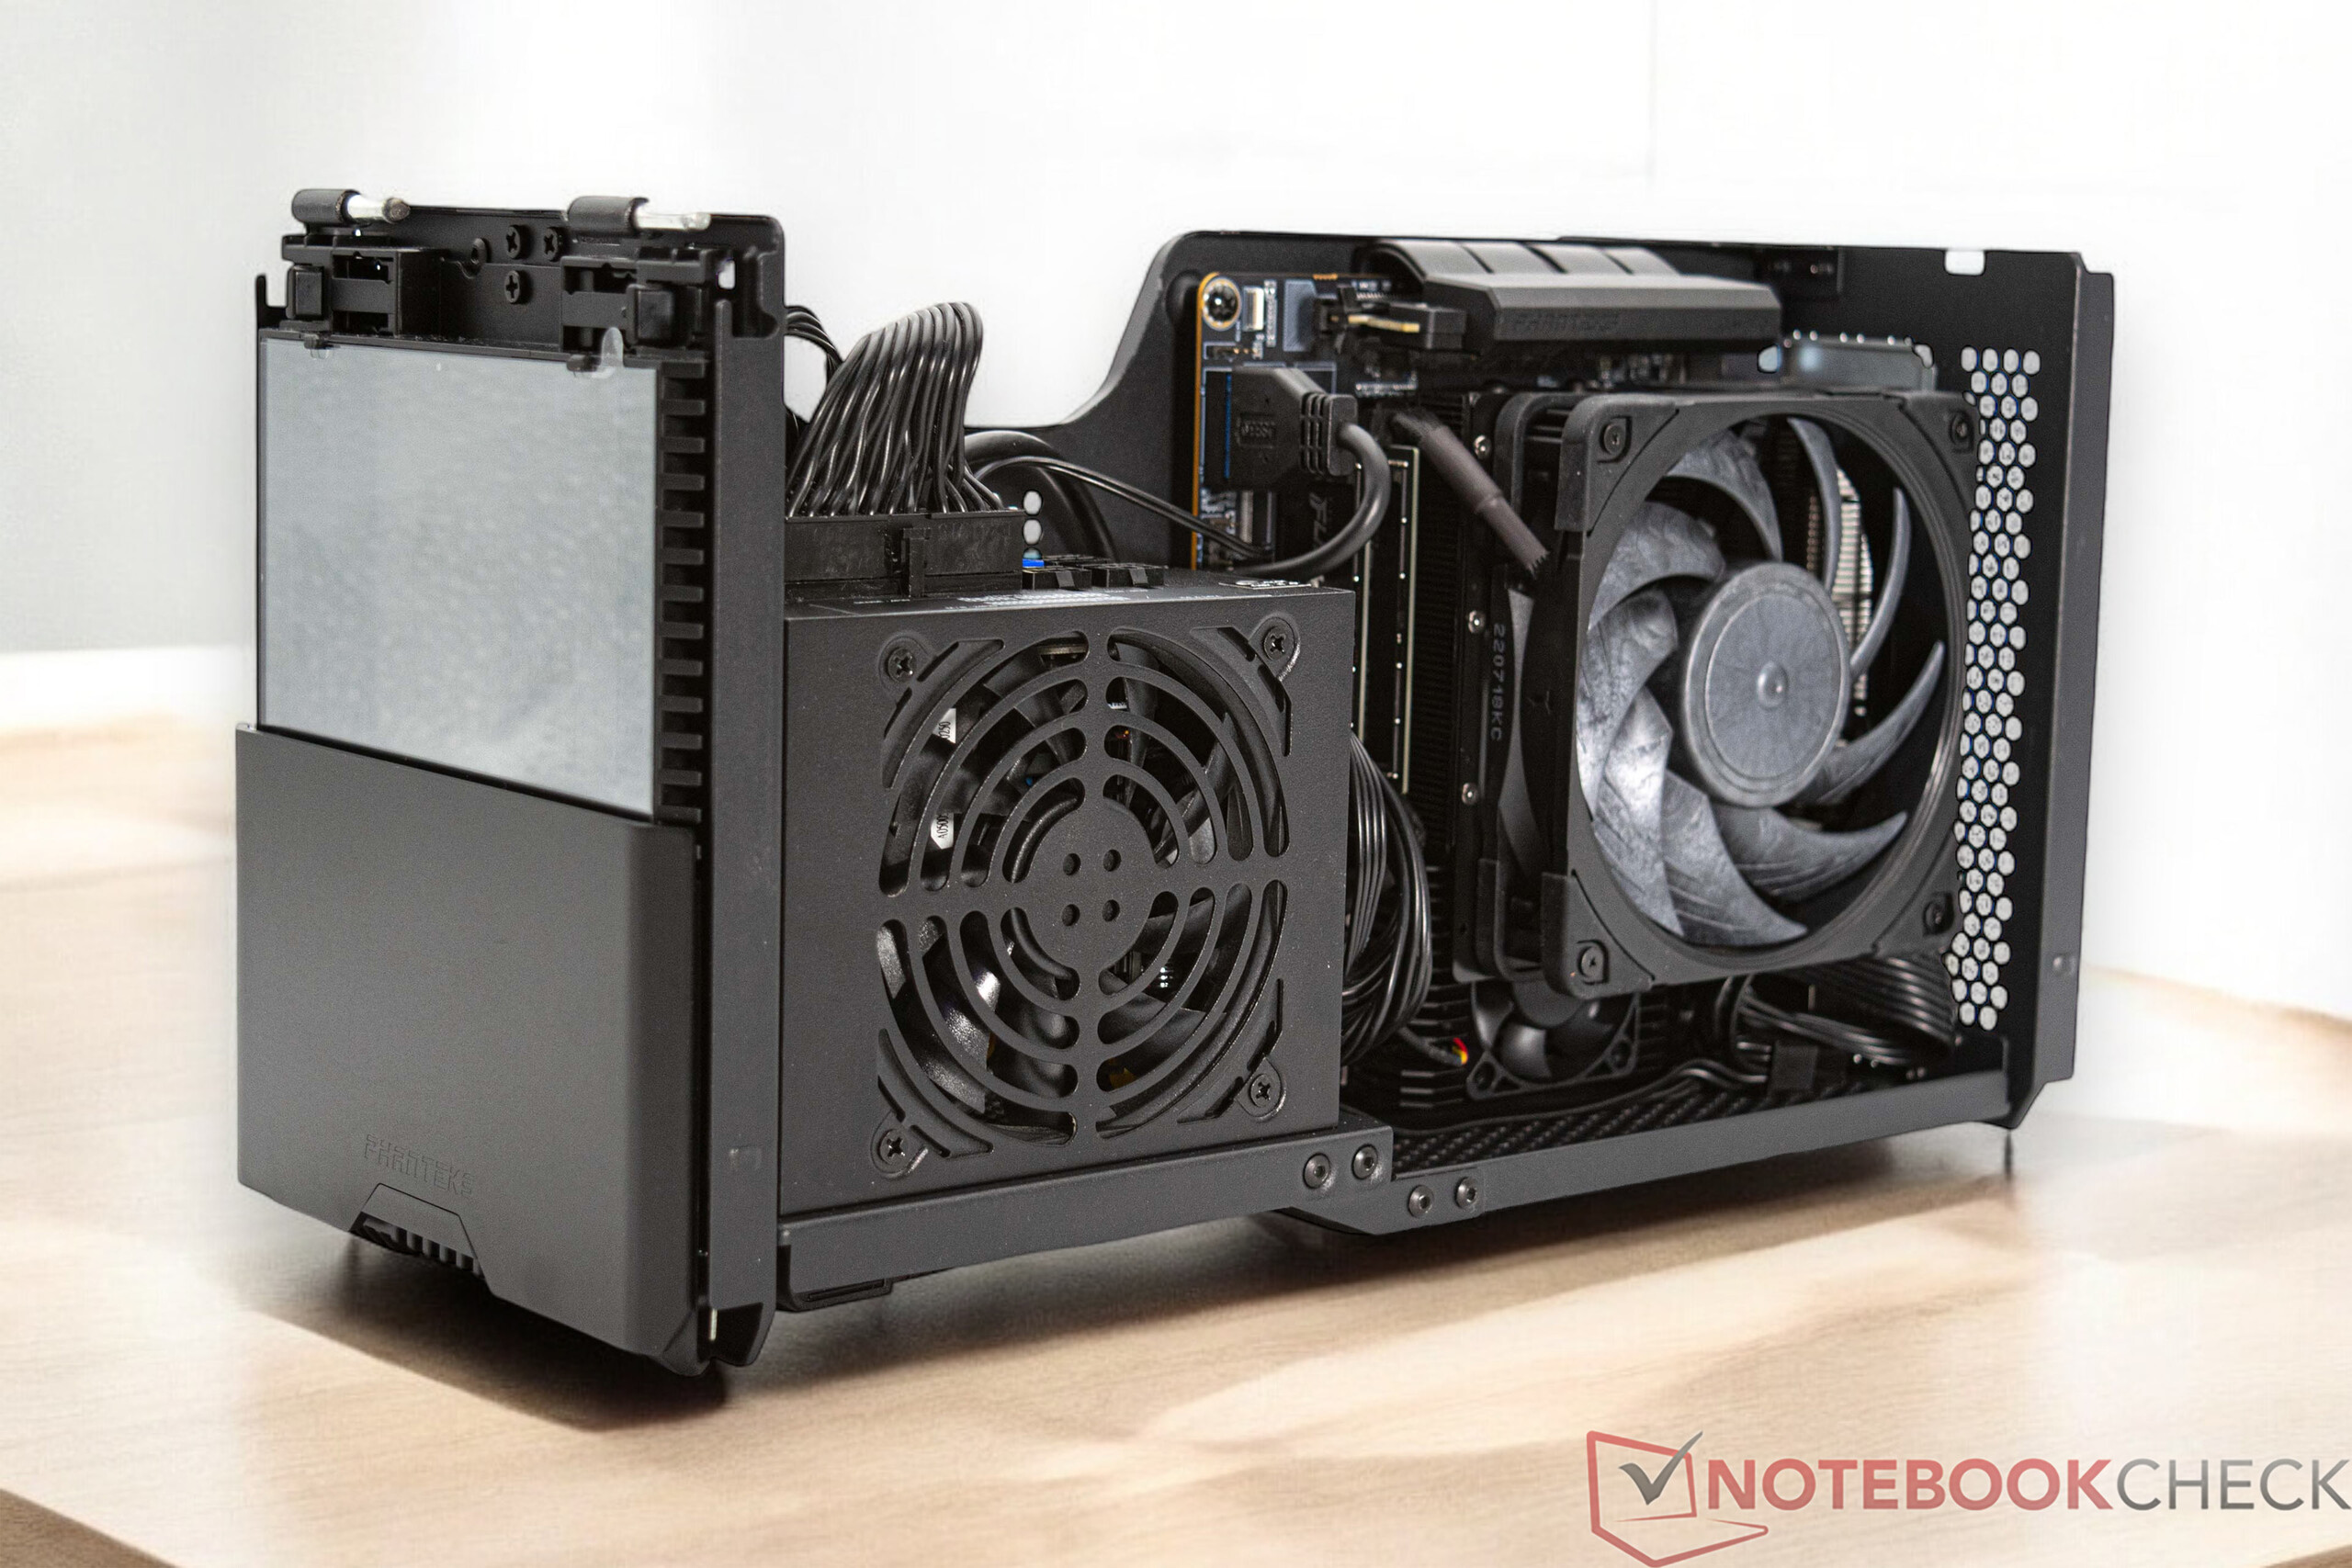
A Minisforum BD790i alaplap szállítási terjedelme hasonló a Minisforum BD770i alaplapéhoz. A gyártó az alaplapot egy előre telepített hűtővel szállítja, amely a processzort és a feszültségváltókat is lefedi. Az alaplaphoz egy IO shield is jár, ami sajnos nincs előre telepítve. Egy viszonylag nagyméretű WLAN-antenna is a csomag részét képezi. Teljesen előre konfigurált opciók nincsenek, de ez nem probléma. CPU ventilátorként egy 120 milliméteres ventilátort kell beszerezni, ami a szerelőanyag segítségével gyorsan beszerelhető. A működéshez ezután egy SSD és egy RAM, valamint egy PC-s tápegység szükséges. A Minisforum BD790i jó alapot nyújt egy nagy teljesítményű és kompakt, miniatűr formátumú barkács PC-hez.
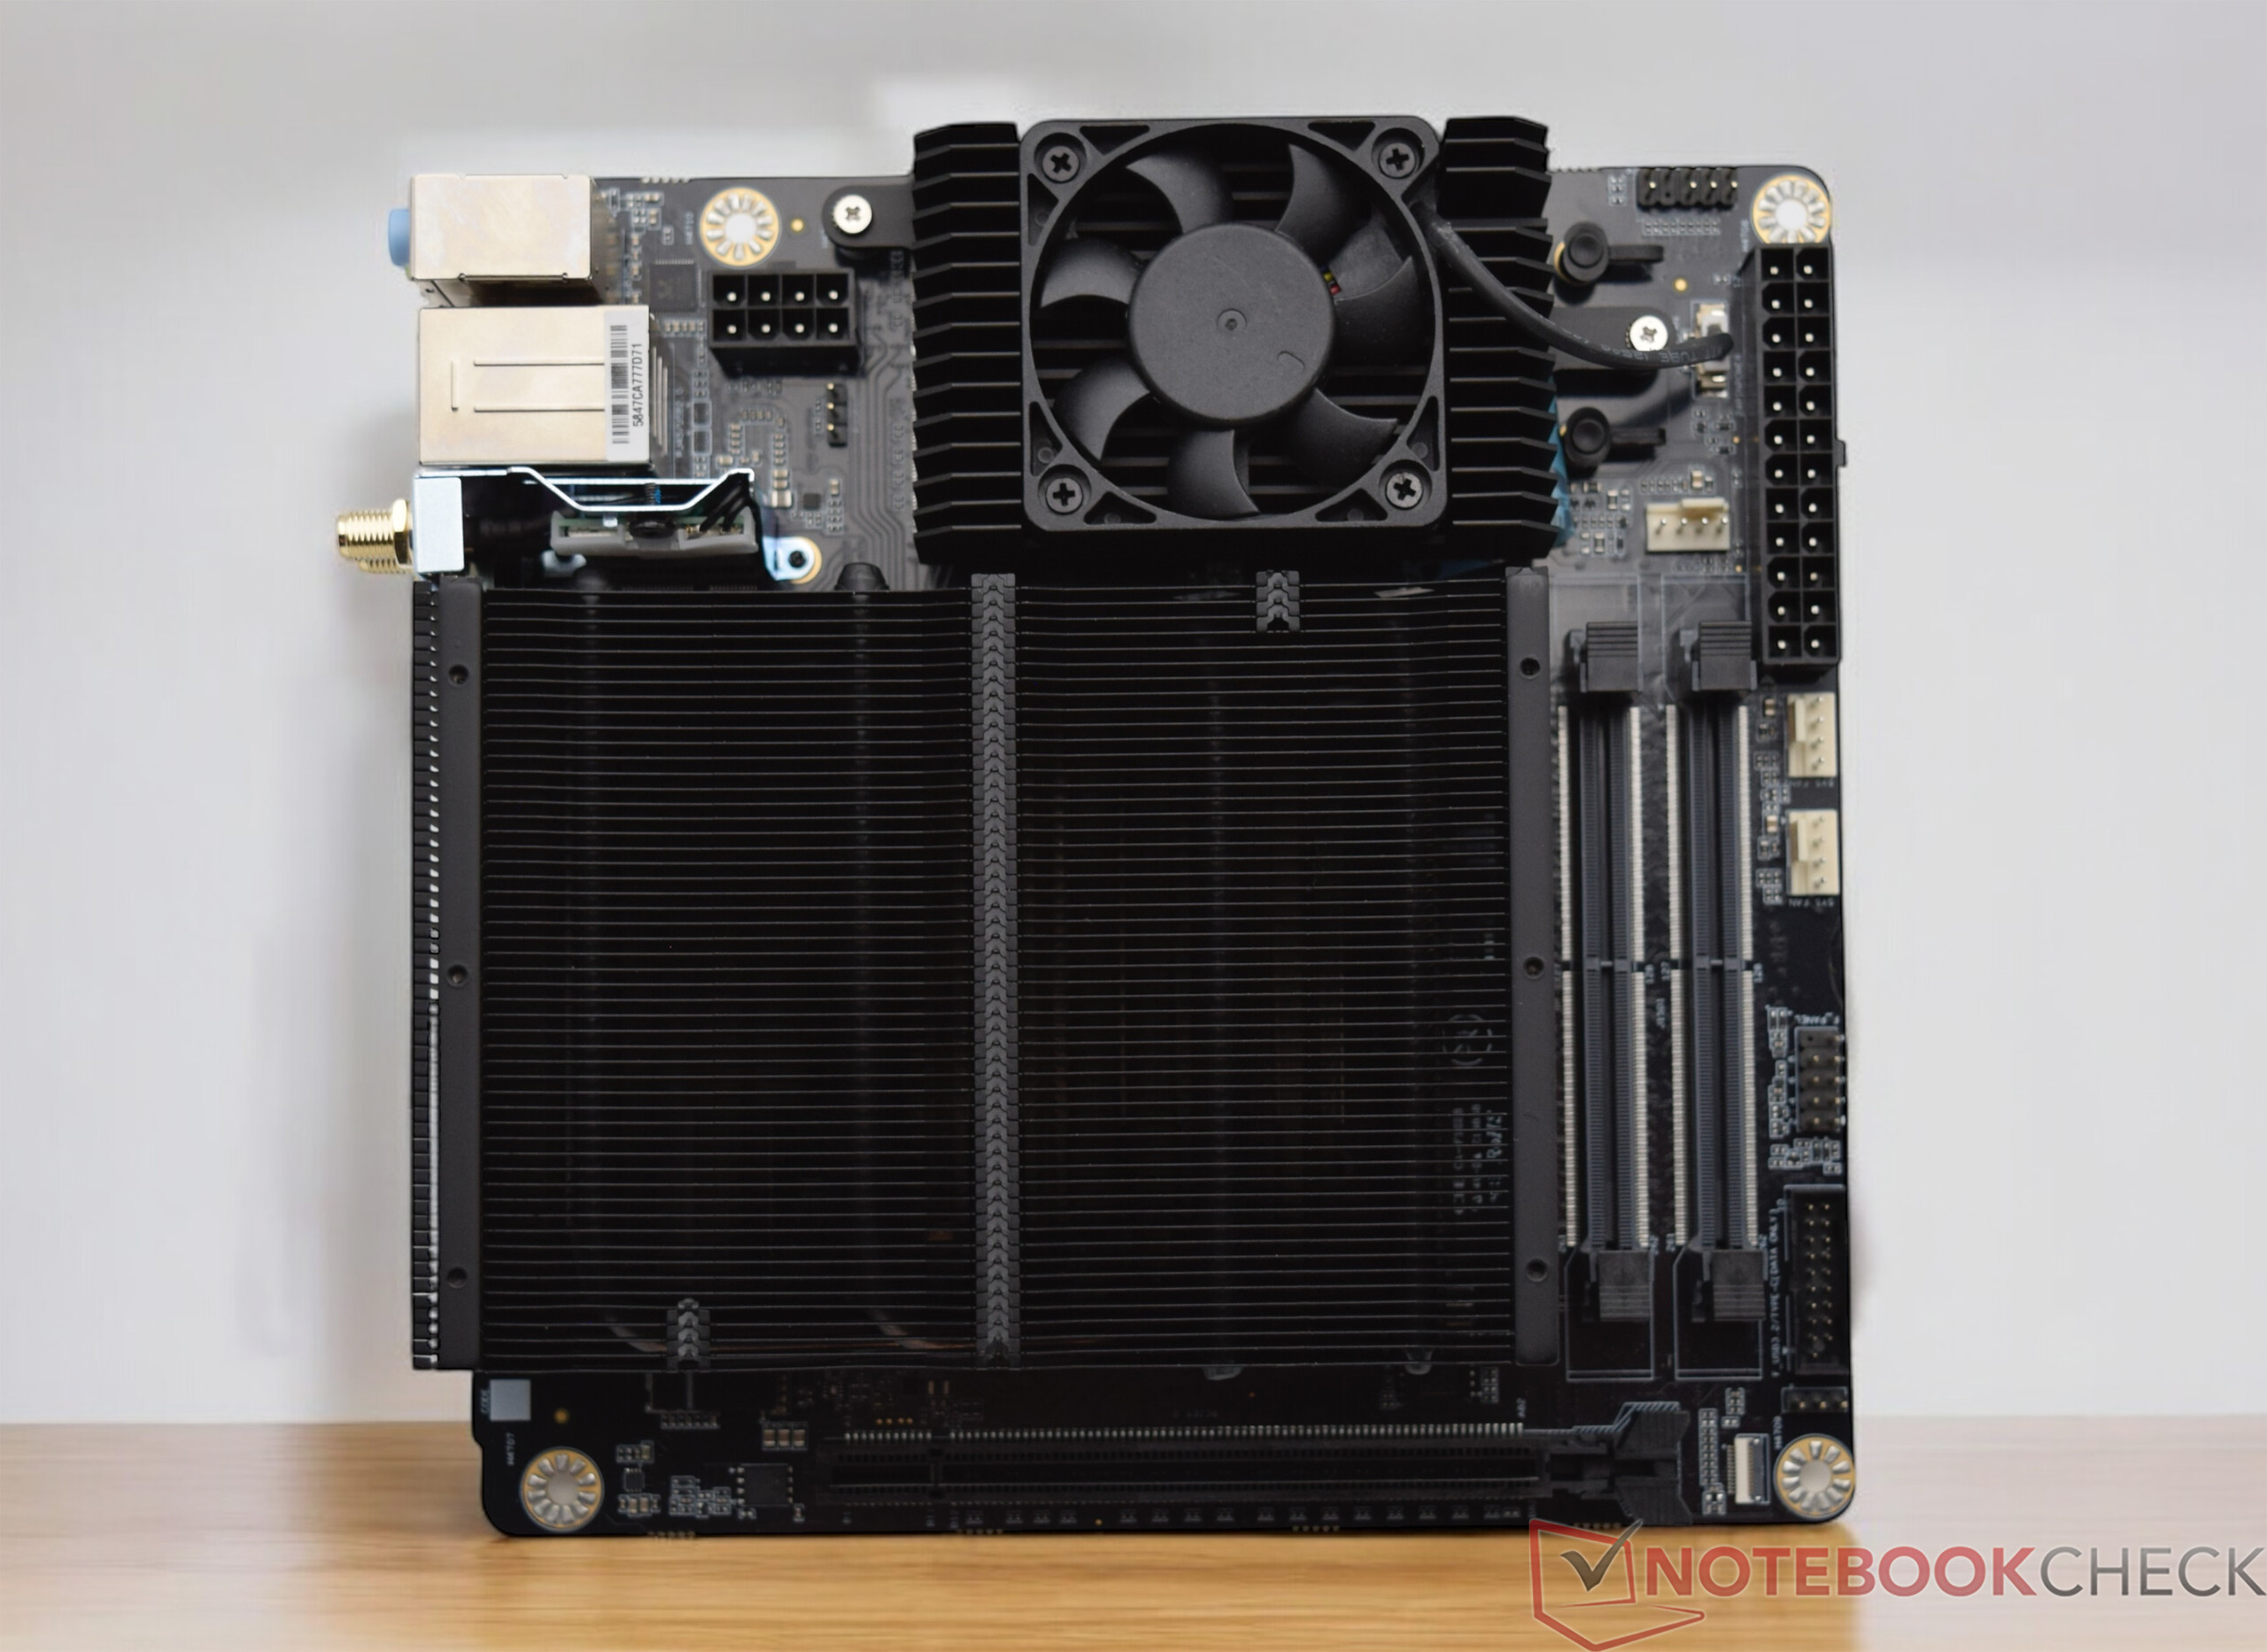
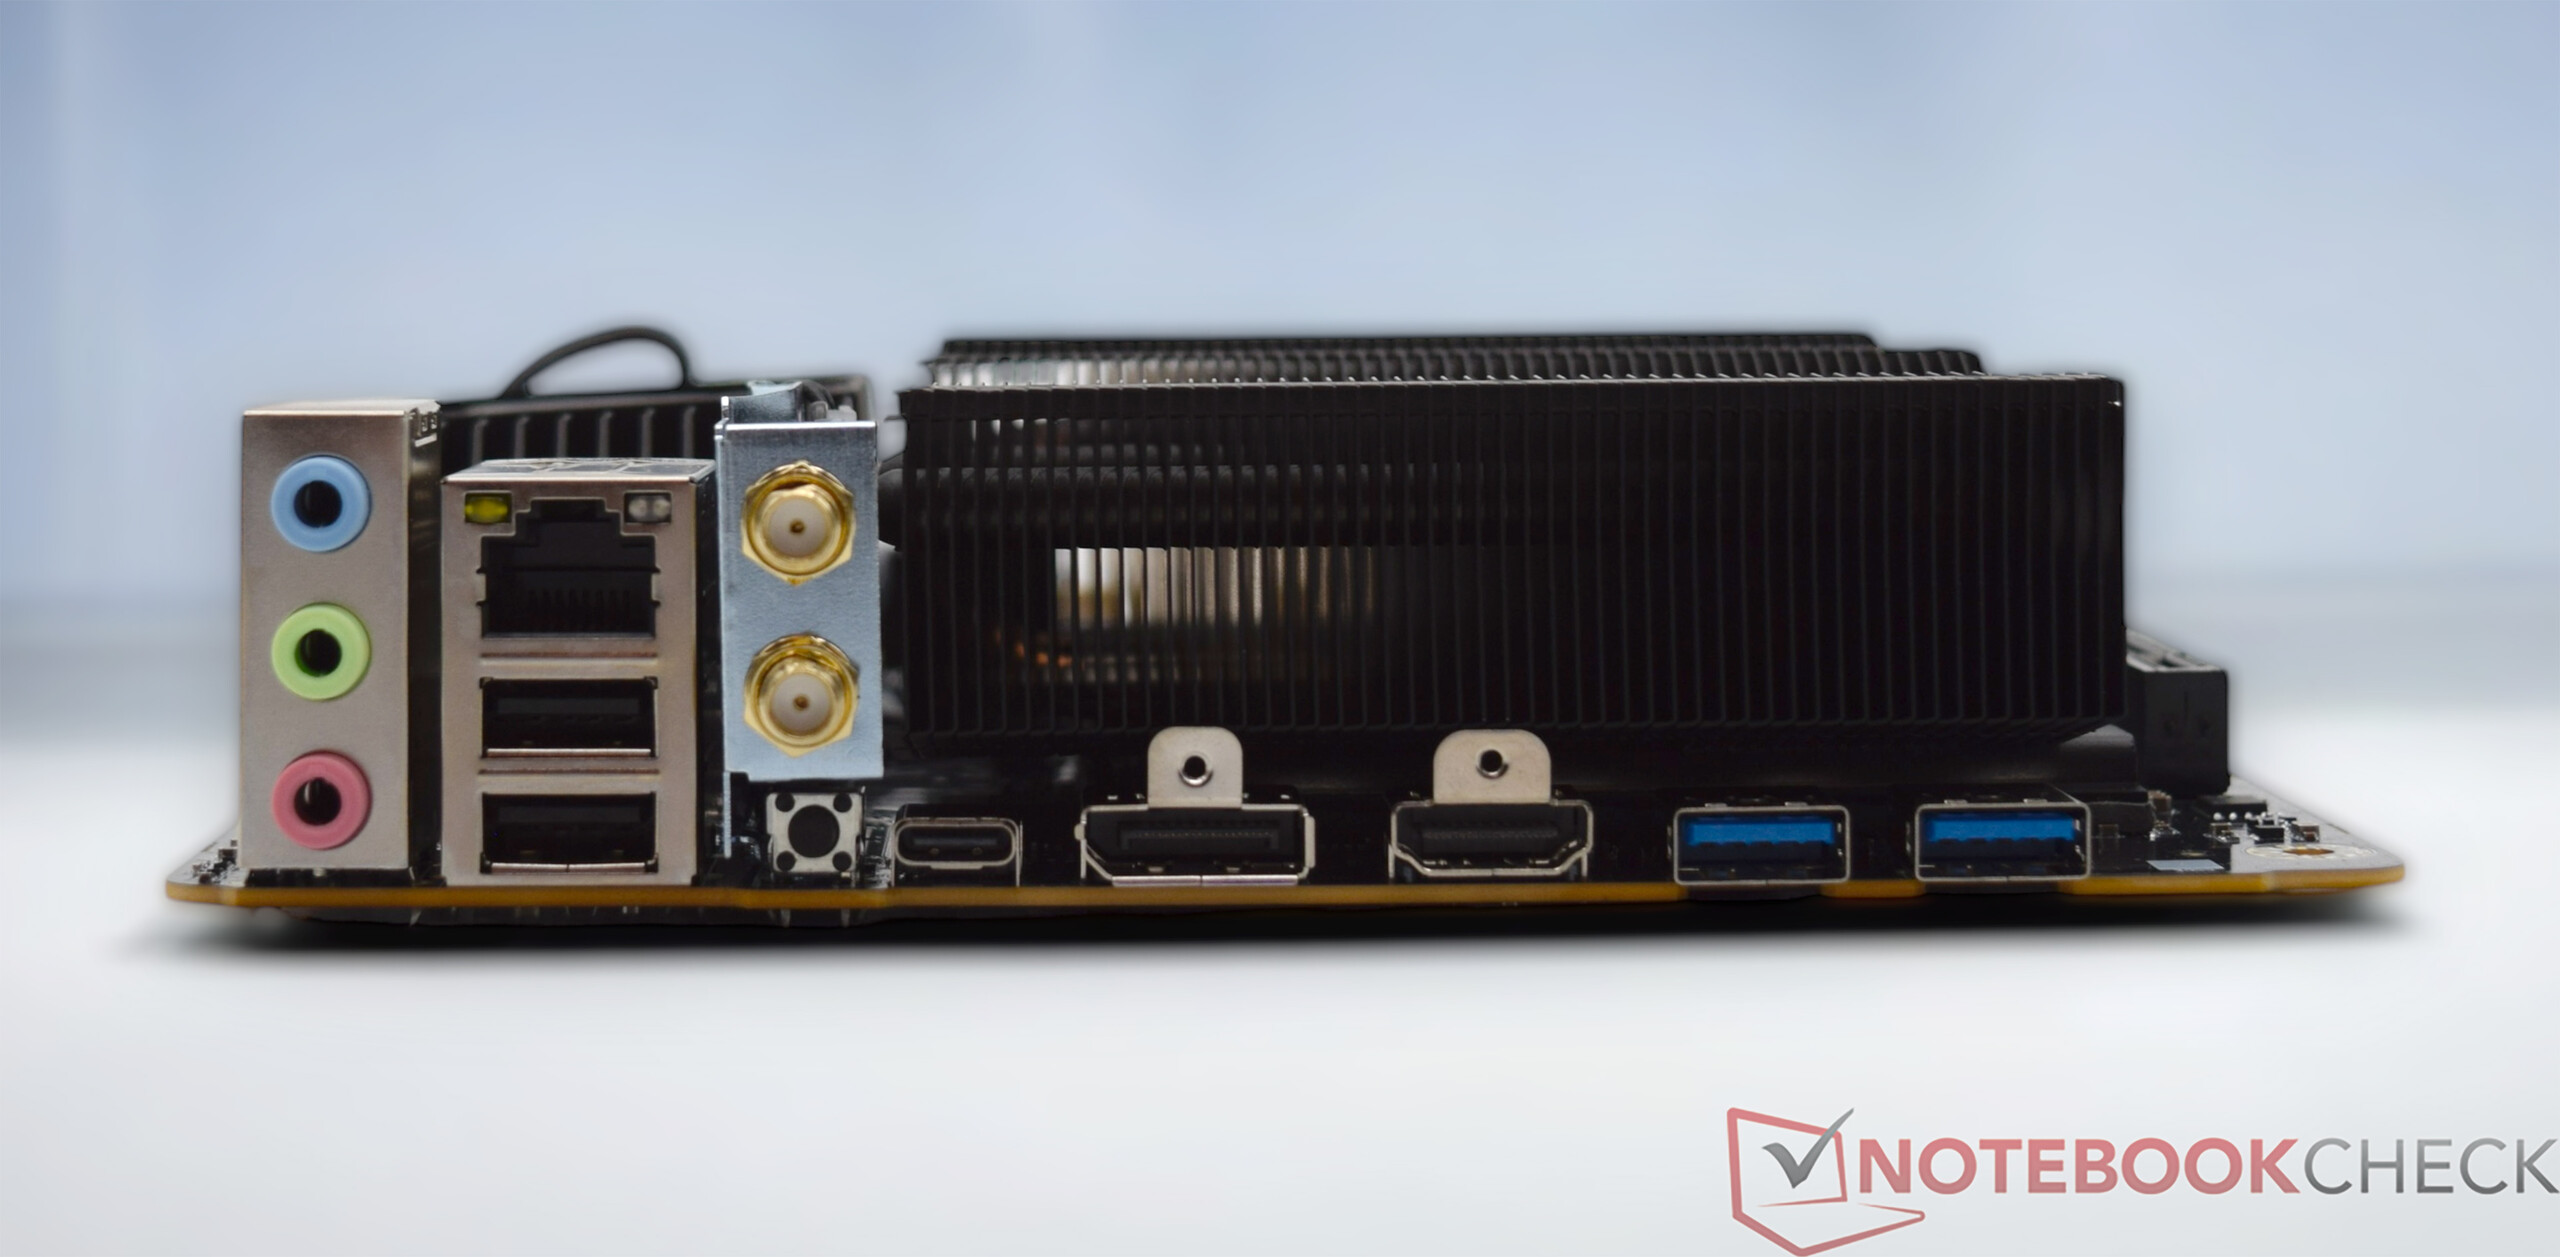
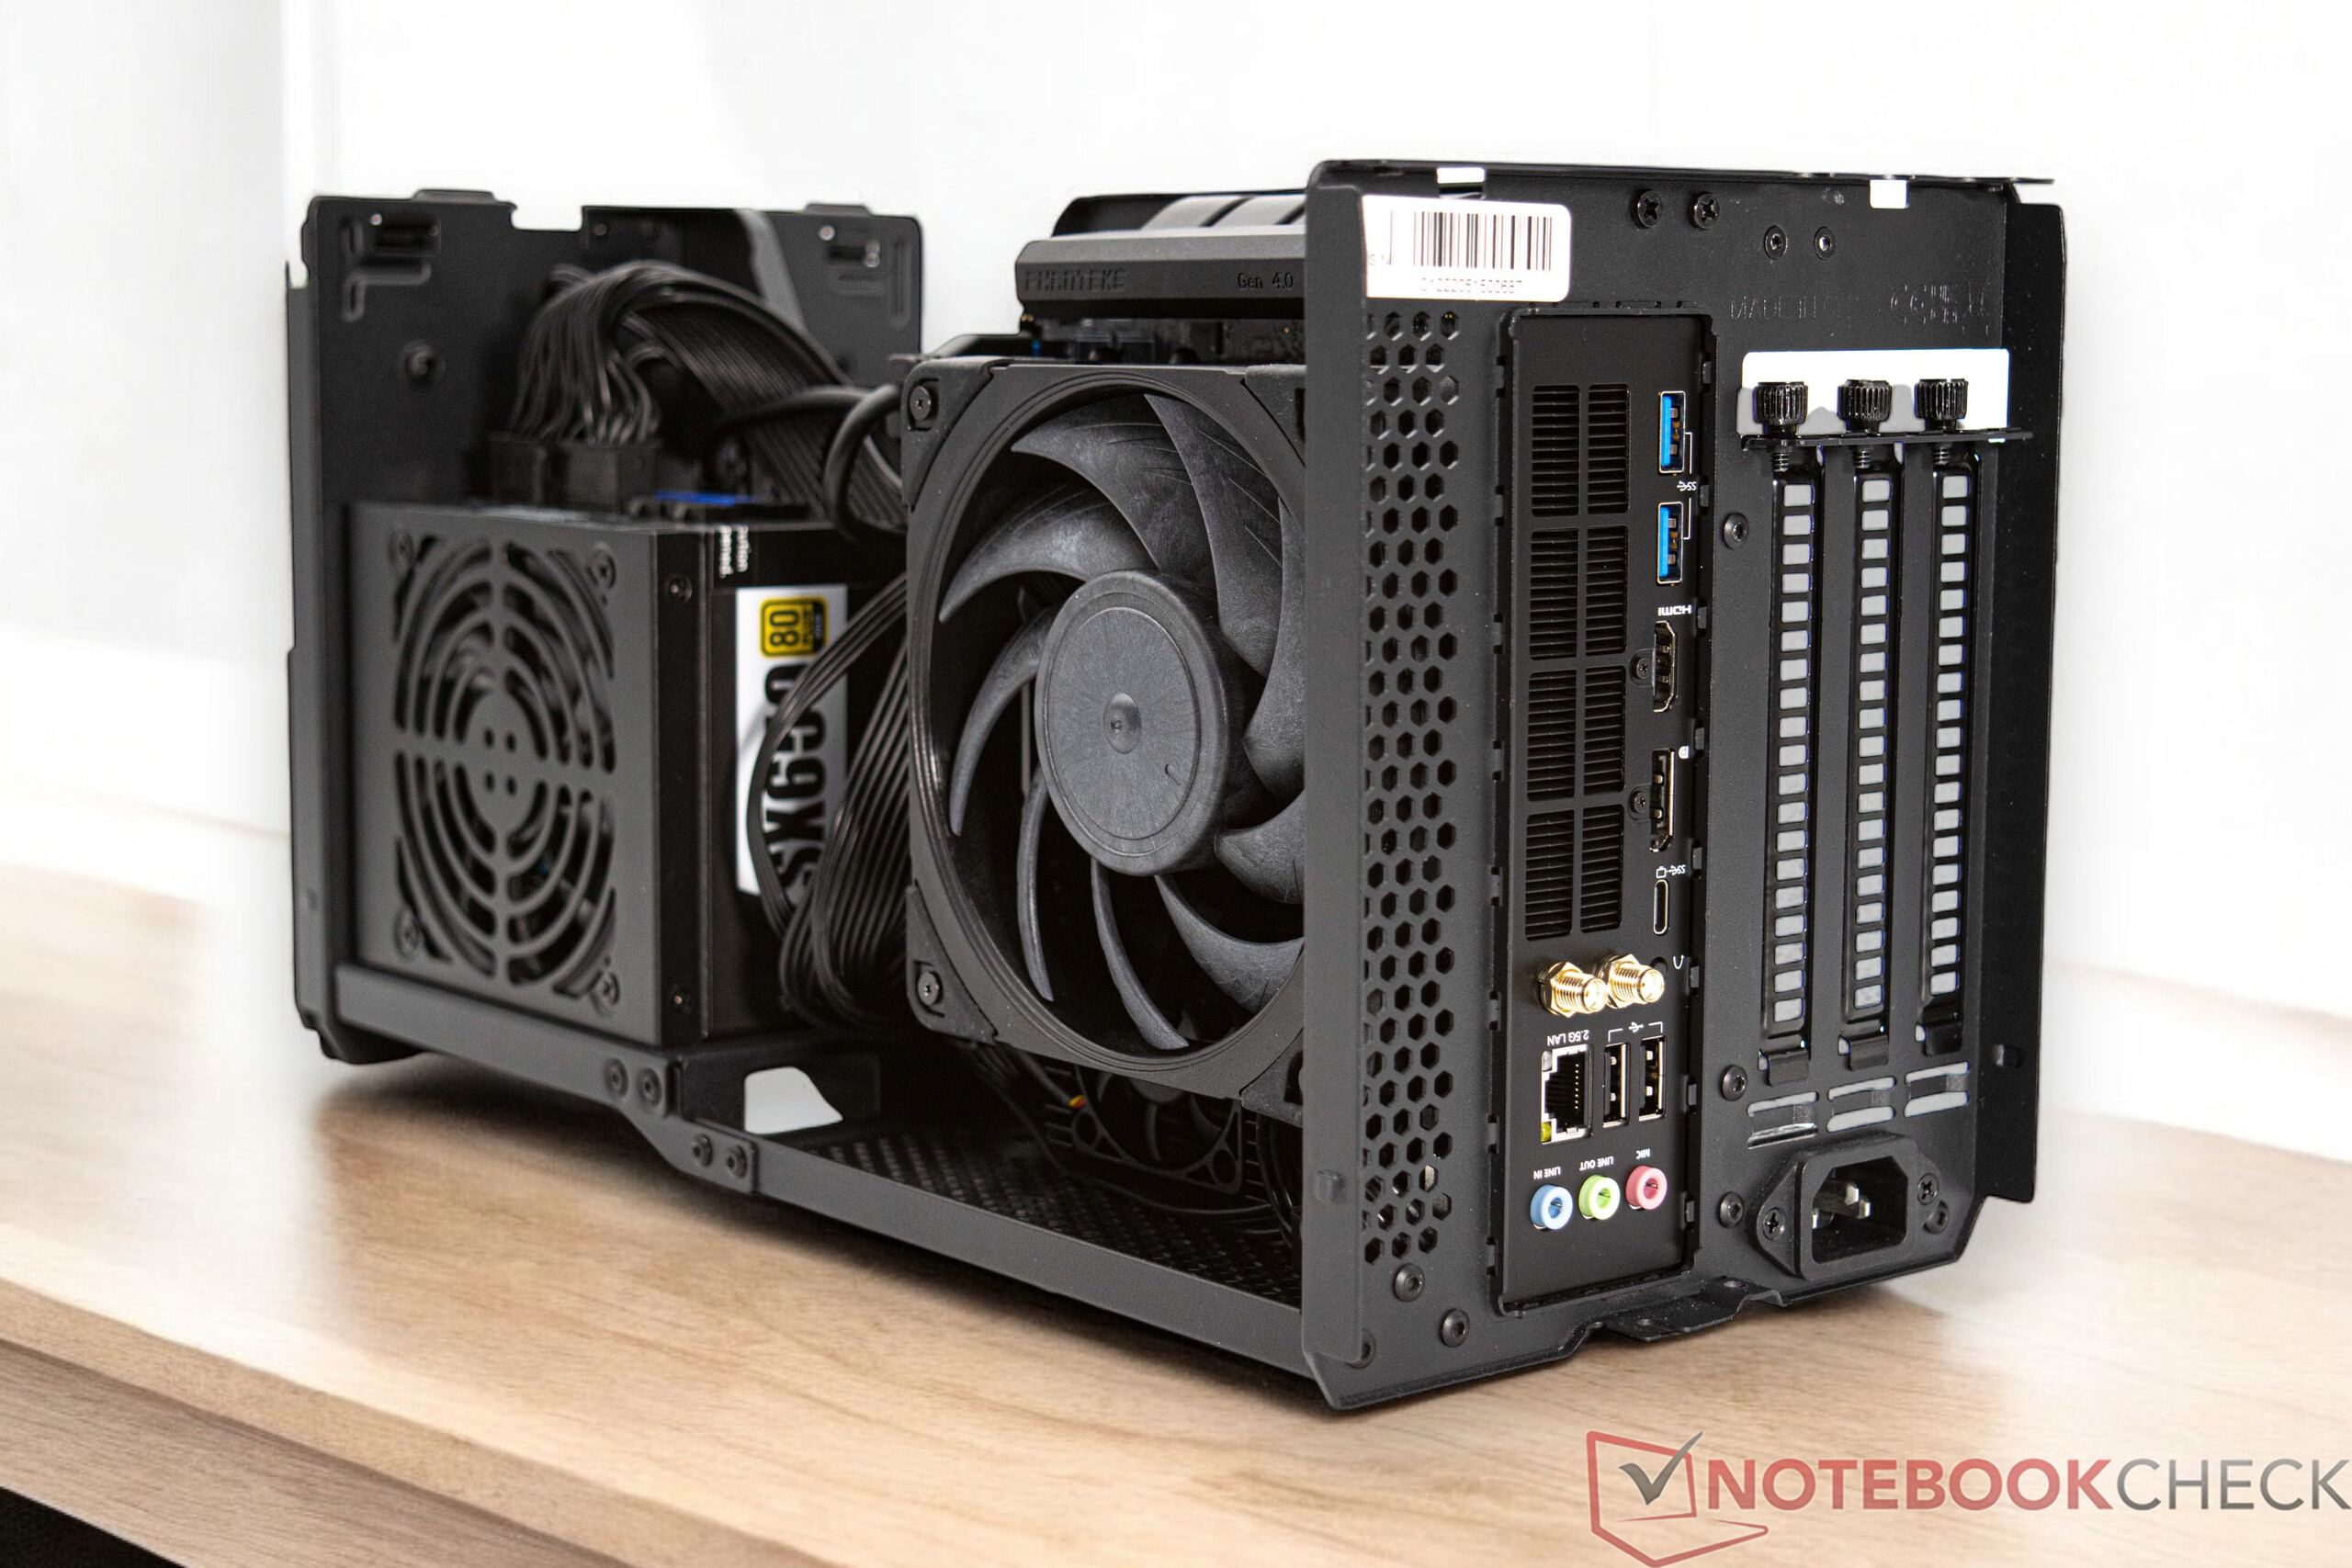
A Minisforum BD790i csatlakoztathatósága meglehetősen gyér. A hátlapon a hagyományos alaplapokhoz képest kevés csatlakozó található, bár a legfontosabb portok a fedélzeten vannak. Magán a lapon is található egy USB 3.2 csatlakozó, ami azt jelenti, hogy összesen 6 USB-A portot használhatunk. Sajnos egyéb csatlakozók, mint például ARGB fejléc vagy egy további USB-C port, nincsenek. Ami a ventilátorok kiválasztását illeti, az előre telepített hűtőre korlátozódik. Nincs alternatív lehetőség egy nagyobb teljesítményű hűtő beszerelésére. Jobb lenne, ha a feszültségátalakítókat külön hűtenék, hogy a felhasználónak lehetősége legyen saját hűtési megoldás telepítésére.
Processzor benchmarkok
A Minisforum BD790i alaplapot a laptopszektorban jelenleg elérhető egyik legerősebb processzorral szerelték fel. A AMD Ryzen 9 7945HX 16 Zen4 maggal rendelkezik, amelyek összesen 32 szál feldolgozására képesek. Teljesítmény szempontjából ez nagyon ígéretesen hangzik - és ez tesztjeinkben is bebizonyosodott. A teljesítmény-összehasonlításban az AMD Ryzen 9 7945HX az AMD Ryzen 9 7945HX között végzett AMD Ryzen 9 7900X és egy AMD Ryzen 9 7950X között. Ha az Intel processzorokkal való összehasonlítást nézzük, akkor az AMD Ryzen 9 7945HX teljesítményét egy Intel Core i7-14700K. A hagyományos asztali processzorokhoz képest az AMD Ryzen 9 7945HX legnagyobb előnye az energiafogyasztás. A mindössze 100 wattos fogyasztással a processzor lényegesen takarékosabb és a hűtése is könnyebb.
További összehasonlításokért és benchmarkokért tekintse meg a következő oldalainkat CPU-összehasonlító táblázatunkat.
| Performance rating - Percent | |
| Intel Core i9-14900K | |
| Intel Core i9-13900K | |
| AMD Ryzen 9 7950X | |
| AMD Ryzen 9 7950X3D | |
| Intel Core i7-14700K | |
| AMD Ryzen 9 7945HX | |
| AMD Ryzen 9 7900X | |
| Intel Core i5-14600K | |
| Intel Core i9-12900K | |
| AMD Ryzen 9 5950X | |
| Intel Core i5-13600K | |
| AMD Ryzen 5 9600X | |
| AMD Ryzen 7 7800X3D | |
| AMD Ryzen 7 7745HX | |
| AMD Ryzen 5 7600X | |
| Intel Core i5-12600K | |
| AMD Ryzen 7 7840HS | |
| AMD Ryzen 9 7940HS | |
| Intel Core i5-13400 | |
| Intel Core i5-12400F | |
| Cinebench R23 | |
| Single Core | |
| Intel Core i9-14900K | |
| Intel Core i9-13900K | |
| AMD Ryzen 5 9600X | |
| Intel Core i7-14700K | |
| Intel Core i5-14600K | |
| AMD Ryzen 9 7950X3D | |
| AMD Ryzen 9 7950X | |
| AMD Ryzen 9 7900X | |
| Intel Core i5-13600K | |
| Intel Core i9-12900K | |
| AMD Ryzen 5 7600X | |
| AMD Ryzen 9 7945HX | |
| Intel Core i5-12600K | |
| AMD Ryzen 7 7745HX | |
| AMD Ryzen 7 7800X3D | |
| AMD Ryzen 9 7940HS | |
| Intel Core i5-13400 | |
| AMD Ryzen 7 7840HS | |
| Intel Core i5-12400F | |
| AMD Ryzen 9 5950X | |
| Multi Core | |
| Intel Core i9-14900K | |
| Intel Core i9-13900K | |
| AMD Ryzen 9 7950X | |
| AMD Ryzen 9 7950X3D | |
| Intel Core i7-14700K | |
| AMD Ryzen 9 7945HX | |
| AMD Ryzen 9 7900X | |
| AMD Ryzen 9 5950X | |
| Intel Core i9-12900K | |
| Intel Core i5-14600K | |
| Intel Core i5-13600K | |
| AMD Ryzen 7 7745HX | |
| AMD Ryzen 7 7800X3D | |
| Intel Core i5-12600K | |
| AMD Ryzen 5 9600X | |
| AMD Ryzen 9 7940HS | |
| AMD Ryzen 7 7840HS | |
| Intel Core i5-13400 | |
| AMD Ryzen 5 7600X | |
| Intel Core i5-12400F | |
| Cinebench R20 | |
| CPU (Single Core) | |
| Intel Core i9-14900K | |
| AMD Ryzen 5 9600X | |
| Intel Core i7-14700K | |
| Intel Core i9-13900K | |
| AMD Ryzen 9 7950X | |
| AMD Ryzen 9 7950X3D | |
| Intel Core i5-14600K | |
| AMD Ryzen 9 7900X | |
| Intel Core i5-13600K | |
| Intel Core i9-12900K | |
| AMD Ryzen 5 7600X | |
| AMD Ryzen 9 7945HX | |
| Intel Core i5-12600K | |
| AMD Ryzen 7 7745HX | |
| AMD Ryzen 9 7940HS | |
| AMD Ryzen 7 7800X3D | |
| AMD Ryzen 7 7840HS | |
| Intel Core i5-13400 | |
| Intel Core i5-12400F | |
| AMD Ryzen 9 5950X | |
| CPU (Multi Core) | |
| Intel Core i9-14900K | |
| Intel Core i9-13900K | |
| AMD Ryzen 9 7950X | |
| AMD Ryzen 9 7950X3D | |
| Intel Core i7-14700K | |
| AMD Ryzen 9 7945HX | |
| AMD Ryzen 9 7900X | |
| AMD Ryzen 9 5950X | |
| Intel Core i9-12900K | |
| Intel Core i5-14600K | |
| Intel Core i5-13600K | |
| AMD Ryzen 7 7745HX | |
| AMD Ryzen 7 7800X3D | |
| AMD Ryzen 5 9600X | |
| Intel Core i5-12600K | |
| AMD Ryzen 9 7940HS | |
| AMD Ryzen 7 7840HS | |
| Intel Core i5-13400 | |
| AMD Ryzen 5 7600X | |
| Intel Core i5-12400F | |
| Cinebench R15 | |
| CPU Single 64Bit | |
| AMD Ryzen 5 9600X | |
| Intel Core i9-14900K | |
| AMD Ryzen 9 7950X | |
| Intel Core i9-13900K | |
| AMD Ryzen 9 7950X3D | |
| AMD Ryzen 9 7900X | |
| AMD Ryzen 5 7600X | |
| Intel Core i7-14700K | |
| AMD Ryzen 9 7945HX | |
| Intel Core i5-14600K | |
| AMD Ryzen 7 7745HX | |
| AMD Ryzen 7 7800X3D | |
| Intel Core i5-13600K | |
| Intel Core i9-12900K | |
| AMD Ryzen 9 7940HS | |
| AMD Ryzen 7 7840HS | |
| Intel Core i5-12600K | |
| AMD Ryzen 9 5950X | |
| Intel Core i5-13400 | |
| Intel Core i5-12400F | |
| CPU Multi 64Bit | |
| Intel Core i9-14900K | |
| AMD Ryzen 9 7950X | |
| Intel Core i9-13900K | |
| AMD Ryzen 9 7950X3D | |
| Intel Core i7-14700K | |
| AMD Ryzen 9 7945HX | |
| AMD Ryzen 9 7900X | |
| AMD Ryzen 9 5950X | |
| Intel Core i9-12900K | |
| Intel Core i5-13600K | |
| Intel Core i5-14600K | |
| AMD Ryzen 7 7745HX | |
| AMD Ryzen 7 7800X3D | |
| AMD Ryzen 9 7940HS | |
| AMD Ryzen 5 9600X | |
| AMD Ryzen 7 7840HS | |
| Intel Core i5-12600K | |
| AMD Ryzen 5 7600X | |
| Intel Core i5-13400 | |
| Intel Core i5-12400F | |
| Cinebench R11.5 | |
| CPU Single 64Bit | |
| Intel Core i9-14900K | |
| AMD Ryzen 5 9600X | |
| Intel Core i9-13900K | |
| AMD Ryzen 9 7950X | |
| AMD Ryzen 9 7950X3D | |
| AMD Ryzen 9 7900X | |
| AMD Ryzen 5 7600X | |
| Intel Core i7-14700K | |
| AMD Ryzen 9 7945HX | |
| Intel Core i5-14600K | |
| AMD Ryzen 7 7745HX | |
| Intel Core i9-12900K | |
| Intel Core i5-13600K | |
| AMD Ryzen 9 7940HS | |
| AMD Ryzen 7 7800X3D | |
| AMD Ryzen 7 7840HS | |
| Intel Core i5-12600K | |
| AMD Ryzen 9 5950X | |
| Intel Core i5-13400 | |
| Intel Core i5-12400F | |
| CPU Multi 64Bit | |
| Intel Core i9-14900K | |
| Intel Core i9-13900K | |
| AMD Ryzen 9 7950X | |
| AMD Ryzen 9 7950X3D | |
| AMD Ryzen 9 7945HX | |
| Intel Core i7-14700K | |
| AMD Ryzen 9 7900X | |
| AMD Ryzen 9 5950X | |
| Intel Core i9-12900K | |
| Intel Core i5-13600K | |
| Intel Core i5-14600K | |
| AMD Ryzen 7 7745HX | |
| AMD Ryzen 7 7800X3D | |
| AMD Ryzen 9 7940HS | |
| AMD Ryzen 5 9600X | |
| AMD Ryzen 7 7840HS | |
| Intel Core i5-12600K | |
| AMD Ryzen 5 7600X | |
| Intel Core i5-13400 | |
| Intel Core i5-12400F | |
| Cinebench R10 | |
| Rendering Single CPUs 64Bit | |
| Intel Core i9-14900K | |
| Intel Core i9-13900K | |
| AMD Ryzen 5 9600X | |
| Intel Core i7-14700K | |
| Intel Core i5-14600K | |
| AMD Ryzen 9 7900X | |
| AMD Ryzen 9 7950X | |
| Intel Core i5-13600K | |
| Intel Core i9-12900K | |
| AMD Ryzen 5 7600X | |
| AMD Ryzen 9 7945HX | |
| Intel Core i5-12600K | |
| AMD Ryzen 7 7745HX | |
| AMD Ryzen 9 7940HS | |
| AMD Ryzen 7 7800X3D | |
| AMD Ryzen 7 7840HS | |
| Intel Core i5-13400 | |
| Intel Core i5-12400F | |
| AMD Ryzen 9 5950X | |
| AMD Ryzen 9 7950X3D | |
| Rendering Multiple CPUs 64Bit | |
| Intel Core i9-14900K | |
| Intel Core i7-14700K | |
| Intel Core i9-13900K | |
| AMD Ryzen 9 7945HX | |
| AMD Ryzen 9 7950X | |
| AMD Ryzen 9 7900X | |
| Intel Core i5-14600K | |
| Intel Core i9-12900K | |
| Intel Core i5-13600K | |
| AMD Ryzen 9 5950X | |
| AMD Ryzen 5 9600X | |
| AMD Ryzen 7 7745HX | |
| AMD Ryzen 7 7800X3D | |
| AMD Ryzen 5 7600X | |
| Intel Core i5-12600K | |
| AMD Ryzen 9 7940HS | |
| AMD Ryzen 7 7840HS | |
| Intel Core i5-13400 | |
| AMD Ryzen 9 7950X3D | |
| Intel Core i5-12400F | |
| Blender - v2.79 BMW27 CPU | |
| Intel Core i5-12400F | |
| Intel Core i5-13400 | |
| AMD Ryzen 5 7600X | |
| AMD Ryzen 7 7840HS | |
| Intel Core i5-12600K | |
| AMD Ryzen 9 7940HS | |
| AMD Ryzen 5 9600X | |
| AMD Ryzen 7 7800X3D | |
| AMD Ryzen 7 7745HX | |
| Intel Core i5-13600K | |
| Intel Core i5-14600K | |
| Intel Core i9-12900K | |
| AMD Ryzen 9 5950X | |
| AMD Ryzen 9 7900X | |
| AMD Ryzen 9 7945HX | |
| Intel Core i7-14700K | |
| AMD Ryzen 9 7950X3D | |
| AMD Ryzen 9 7950X | |
| Intel Core i9-13900K | |
| Intel Core i9-14900K | |
| wPrime 2.10 | |
| 32m | |
| Intel Core i9-12900K | |
| Intel Core i5-12600K | |
| Intel Core i5-12400F | |
| Intel Core i5-13400 | |
| AMD Ryzen 5 7600X | |
| AMD Ryzen 9 7940HS | |
| AMD Ryzen 7 7840HS | |
| AMD Ryzen 5 9600X | |
| AMD Ryzen 9 5950X | |
| Intel Core i5-13600K | |
| AMD Ryzen 7 7800X3D | |
| Intel Core i5-14600K | |
| AMD Ryzen 7 7745HX | |
| Intel Core i7-14700K | |
| Intel Core i9-14900K | |
| AMD Ryzen 9 7950X3D | |
| AMD Ryzen 9 7945HX | |
| Intel Core i9-13900K | |
| AMD Ryzen 9 7900X | |
| AMD Ryzen 9 7950X | |
| 1024m | |
| Intel Core i5-13400 | |
| Intel Core i5-12600K | |
| Intel Core i9-12900K | |
| Intel Core i5-13600K | |
| Intel Core i5-14600K | |
| Intel Core i5-12400F | |
| Intel Core i7-14700K | |
| Intel Core i9-13900K | |
| AMD Ryzen 5 7600X | |
| Intel Core i9-14900K | |
| AMD Ryzen 7 7840HS | |
| AMD Ryzen 5 9600X | |
| AMD Ryzen 9 7940HS | |
| AMD Ryzen 9 5950X | |
| AMD Ryzen 7 7800X3D | |
| AMD Ryzen 7 7745HX | |
| AMD Ryzen 9 7900X | |
| AMD Ryzen 9 7945HX | |
| AMD Ryzen 9 7950X3D | |
| AMD Ryzen 9 7950X | |
| X264 HD Benchmark 4.0 | |
| Pass 1 | |
| Intel Core i9-14900K | |
| Intel Core i7-14700K | |
| Intel Core i9-13900K | |
| Intel Core i5-14600K | |
| AMD Ryzen 9 7950X3D | |
| Intel Core i5-13600K | |
| AMD Ryzen 9 7950X | |
| AMD Ryzen 9 7945HX | |
| AMD Ryzen 9 7900X | |
| Intel Core i9-12900K | |
| AMD Ryzen 5 7600X | |
| AMD Ryzen 5 9600X | |
| AMD Ryzen 7 7745HX | |
| AMD Ryzen 7 7800X3D | |
| AMD Ryzen 9 5950X | |
| Intel Core i5-12600K | |
| Intel Core i5-13400 | |
| AMD Ryzen 9 7940HS | |
| AMD Ryzen 7 7840HS | |
| Intel Core i5-12400F | |
| Pass 2 | |
| Intel Core i9-14900K | |
| Intel Core i9-13900K | |
| AMD Ryzen 9 7950X | |
| AMD Ryzen 9 7950X3D | |
| Intel Core i7-14700K | |
| AMD Ryzen 9 7945HX | |
| AMD Ryzen 9 7900X | |
| AMD Ryzen 9 5950X | |
| Intel Core i5-14600K | |
| Intel Core i9-12900K | |
| Intel Core i5-13600K | |
| AMD Ryzen 7 7745HX | |
| AMD Ryzen 7 7800X3D | |
| AMD Ryzen 5 9600X | |
| AMD Ryzen 9 7940HS | |
| AMD Ryzen 7 7840HS | |
| Intel Core i5-12600K | |
| AMD Ryzen 5 7600X | |
| Intel Core i5-13400 | |
| Intel Core i5-12400F | |
| WinRAR - Result | |
| AMD Ryzen 9 7900X | |
| AMD Ryzen 7 7800X3D | |
| AMD Ryzen 9 7950X | |
| AMD Ryzen 5 7600X | |
| Intel Core i9-14900K | |
| AMD Ryzen 9 7950X3D | |
| AMD Ryzen 9 7945HX | |
| Intel Core i9-13900K | |
| AMD Ryzen 5 9600X | |
| AMD Ryzen 7 7745HX | |
| Intel Core i7-14700K | |
| AMD Ryzen 9 5950X | |
| Intel Core i5-14600K | |
| Intel Core i5-13600K | |
| Intel Core i9-12900K | |
| Intel Core i5-13400 | |
| Intel Core i5-12400F | |
| AMD Ryzen 7 7840HS | |
| AMD Ryzen 9 7940HS | |
| Intel Core i5-12600K | |
| TrueCrypt | |
| AES Mean 100MB | |
| AMD Ryzen 9 7950X | |
| AMD Ryzen 9 7945HX | |
| Intel Core i9-13900K | |
| AMD Ryzen 9 5950X | |
| AMD Ryzen 9 7950X3D | |
| Intel Core i9-14900K | |
| Intel Core i7-14700K | |
| Intel Core i5-14600K | |
| Intel Core i5-13600K | |
| Intel Core i9-12900K | |
| AMD Ryzen 7 7745HX | |
| AMD Ryzen 7 7800X3D | |
| AMD Ryzen 7 7840HS | |
| AMD Ryzen 9 7900X | |
| AMD Ryzen 9 7940HS | |
| AMD Ryzen 5 9600X | |
| AMD Ryzen 5 7600X | |
| Intel Core i5-12600K | |
| Intel Core i5-13400 | |
| Intel Core i5-12400F | |
| Twofish Mean 100MB | |
| Intel Core i9-14900K | |
| Intel Core i9-13900K | |
| Intel Core i7-14700K | |
| AMD Ryzen 9 7950X | |
| AMD Ryzen 9 7950X3D | |
| AMD Ryzen 9 7945HX | |
| AMD Ryzen 9 5950X | |
| Intel Core i9-12900K | |
| Intel Core i5-14600K | |
| Intel Core i5-13600K | |
| AMD Ryzen 9 7900X | |
| Intel Core i5-12600K | |
| AMD Ryzen 7 7745HX | |
| AMD Ryzen 5 9600X | |
| AMD Ryzen 7 7800X3D | |
| AMD Ryzen 9 7940HS | |
| AMD Ryzen 7 7840HS | |
| Intel Core i5-13400 | |
| AMD Ryzen 5 7600X | |
| Intel Core i5-12400F | |
| Serpent Mean 100MB | |
| Intel Core i9-13900K | |
| AMD Ryzen 9 7950X | |
| AMD Ryzen 9 7950X3D | |
| Intel Core i9-14900K | |
| Intel Core i7-14700K | |
| AMD Ryzen 9 7945HX | |
| AMD Ryzen 9 5950X | |
| Intel Core i9-12900K | |
| Intel Core i5-14600K | |
| Intel Core i5-13600K | |
| AMD Ryzen 9 7900X | |
| AMD Ryzen 9 7940HS | |
| AMD Ryzen 7 7745HX | |
| AMD Ryzen 5 9600X | |
| Intel Core i5-12600K | |
| AMD Ryzen 7 7800X3D | |
| AMD Ryzen 7 7840HS | |
| Intel Core i5-13400 | |
| AMD Ryzen 5 7600X | |
| Intel Core i5-12400F | |
| Geekbench 5.5 | |
| Multi-Core | |
| Intel Core i9-14900K | |
| AMD Ryzen 9 7950X | |
| AMD Ryzen 9 7950X3D | |
| Intel Core i9-13900K | |
| Intel Core i7-14700K | |
| AMD Ryzen 9 7945HX | |
| AMD Ryzen 9 7900X | |
| Intel Core i9-12900K | |
| Intel Core i5-14600K | |
| AMD Ryzen 9 5950X | |
| Intel Core i5-13600K | |
| AMD Ryzen 7 7800X3D | |
| AMD Ryzen 7 7745HX | |
| Intel Core i5-12600K | |
| AMD Ryzen 5 9600X | |
| AMD Ryzen 7 7840HS | |
| Intel Core i5-13400 | |
| AMD Ryzen 5 7600X | |
| AMD Ryzen 9 7940HS | |
| Intel Core i5-12400F | |
| Single-Core | |
| AMD Ryzen 5 9600X | |
| AMD Ryzen 9 7950X | |
| AMD Ryzen 9 7950X3D | |
| Intel Core i9-13900K | |
| AMD Ryzen 9 7900X | |
| Intel Core i9-14900K | |
| AMD Ryzen 5 7600X | |
| AMD Ryzen 9 7945HX | |
| Intel Core i7-14700K | |
| AMD Ryzen 7 7745HX | |
| Intel Core i9-12900K | |
| AMD Ryzen 7 7800X3D | |
| Intel Core i5-14600K | |
| AMD Ryzen 9 7940HS | |
| Intel Core i5-13600K | |
| AMD Ryzen 7 7840HS | |
| Intel Core i5-12600K | |
| Intel Core i5-13400 | |
| Intel Core i5-12400F | |
| AMD Ryzen 9 5950X | |
| Geekbench 5.0 | |
| 5.0 Multi-Core | |
| Intel Core i9-14900K | |
| AMD Ryzen 9 7950X | |
| Intel Core i9-13900K | |
| AMD Ryzen 9 7950X3D | |
| Intel Core i7-14700K | |
| AMD Ryzen 9 7945HX | |
| AMD Ryzen 9 7900X | |
| Intel Core i9-12900K | |
| Intel Core i5-14600K | |
| Intel Core i5-13600K | |
| AMD Ryzen 9 5950X | |
| AMD Ryzen 7 7800X3D | |
| AMD Ryzen 7 7745HX | |
| Intel Core i5-12600K | |
| AMD Ryzen 5 9600X | |
| AMD Ryzen 7 7840HS | |
| AMD Ryzen 5 7600X | |
| Intel Core i5-13400 | |
| AMD Ryzen 9 7940HS | |
| Intel Core i5-12400F | |
| 5.0 Single-Core | |
| AMD Ryzen 5 9600X | |
| Intel Core i9-14900K | |
| AMD Ryzen 9 7950X | |
| Intel Core i9-13900K | |
| AMD Ryzen 9 7900X | |
| AMD Ryzen 9 7950X3D | |
| AMD Ryzen 5 7600X | |
| AMD Ryzen 9 7945HX | |
| Intel Core i7-14700K | |
| Intel Core i5-14600K | |
| AMD Ryzen 7 7745HX | |
| Intel Core i9-12900K | |
| AMD Ryzen 7 7800X3D | |
| Intel Core i5-13600K | |
| AMD Ryzen 7 7840HS | |
| AMD Ryzen 9 7940HS | |
| Intel Core i5-12600K | |
| Intel Core i5-13400 | |
| AMD Ryzen 9 5950X | |
| Intel Core i5-12400F | |
| Geekbench 4.4 | |
| 64 Bit Single-Core Score | |
| Intel Core i9-14900K | |
| AMD Ryzen 5 9600X | |
| Intel Core i9-13900K | |
| AMD Ryzen 9 7950X | |
| Intel Core i7-14700K | |
| AMD Ryzen 9 7950X3D | |
| AMD Ryzen 9 7900X | |
| AMD Ryzen 7 7800X3D | |
| AMD Ryzen 5 7600X | |
| Intel Core i5-14600K | |
| Intel Core i9-12900K | |
| Intel Core i5-13600K | |
| AMD Ryzen 9 7945HX | |
| AMD Ryzen 7 7745HX | |
| Intel Core i5-12600K | |
| AMD Ryzen 7 7840HS | |
| AMD Ryzen 9 7940HS | |
| Intel Core i5-13400 | |
| Intel Core i5-12400F | |
| AMD Ryzen 9 5950X | |
| 64 Bit Multi-Core Score | |
| AMD Ryzen 9 7950X | |
| Intel Core i9-14900K | |
| AMD Ryzen 9 7950X3D | |
| Intel Core i9-13900K | |
| Intel Core i7-14700K | |
| AMD Ryzen 9 7945HX | |
| AMD Ryzen 9 7900X | |
| Intel Core i5-14600K | |
| Intel Core i9-12900K | |
| AMD Ryzen 9 5950X | |
| Intel Core i5-13600K | |
| AMD Ryzen 7 7800X3D | |
| AMD Ryzen 7 7745HX | |
| AMD Ryzen 5 9600X | |
| AMD Ryzen 7 7840HS | |
| AMD Ryzen 5 7600X | |
| Intel Core i5-12600K | |
| AMD Ryzen 9 7940HS | |
| Intel Core i5-13400 | |
| Intel Core i5-12400F | |
| 3DMark 11 - 1280x720 Performance Physics | |
| AMD Ryzen 9 7950X3D | |
| AMD Ryzen 7 7800X3D | |
| Intel Core i7-14700K | |
| Intel Core i9-13900K | |
| Intel Core i9-14900K | |
| Intel Core i5-14600K | |
| Intel Core i5-13600K | |
| AMD Ryzen 9 7900X | |
| AMD Ryzen 9 7950X | |
| Intel Core i9-12900K | |
| AMD Ryzen 9 7945HX | |
| AMD Ryzen 7 7745HX | |
| AMD Ryzen 5 9600X | |
| AMD Ryzen 5 7600X | |
| AMD Ryzen 9 5950X | |
| Intel Core i5-12600K | |
| Intel Core i5-13400 | |
| AMD Ryzen 7 7840HS | |
| AMD Ryzen 9 7940HS | |
| Intel Core i5-12400F | |
| 7-Zip 18.03 | |
| 7z b 4 | |
| AMD Ryzen 9 7950X | |
| AMD Ryzen 9 7950X3D | |
| Intel Core i9-14900K | |
| Intel Core i9-13900K | |
| AMD Ryzen 9 7945HX | |
| Intel Core i7-14700K | |
| AMD Ryzen 9 5950X | |
| AMD Ryzen 9 7900X | |
| Intel Core i9-12900K | |
| Intel Core i5-14600K | |
| Intel Core i5-13600K | |
| AMD Ryzen 7 7800X3D | |
| AMD Ryzen 7 7745HX | |
| AMD Ryzen 7 7840HS | |
| AMD Ryzen 9 7940HS | |
| AMD Ryzen 5 7600X | |
| AMD Ryzen 5 9600X | |
| Intel Core i5-12600K | |
| Intel Core i5-13400 | |
| Intel Core i5-12400F | |
| 7z b 4 -mmt1 | |
| AMD Ryzen 9 7950X | |
| AMD Ryzen 9 7950X3D | |
| AMD Ryzen 9 7900X | |
| AMD Ryzen 7 7800X3D | |
| AMD Ryzen 5 7600X | |
| AMD Ryzen 5 9600X | |
| Intel Core i9-14900K | |
| AMD Ryzen 9 7945HX | |
| Intel Core i7-14700K | |
| AMD Ryzen 7 7745HX | |
| Intel Core i9-13900K | |
| AMD Ryzen 9 5950X | |
| Intel Core i5-14600K | |
| AMD Ryzen 9 7940HS | |
| Intel Core i9-12900K | |
| AMD Ryzen 7 7840HS | |
| Intel Core i5-13600K | |
| Intel Core i5-12600K | |
| Intel Core i5-13400 | |
| Intel Core i5-12400F | |
| HWBOT x265 Benchmark v2.2 - 4k Preset | |
| AMD Ryzen 9 7950X | |
| Intel Core i9-14900K | |
| Intel Core i9-13900K | |
| AMD Ryzen 9 7950X3D | |
| AMD Ryzen 9 7945HX | |
| Intel Core i7-14700K | |
| AMD Ryzen 9 7900X | |
| AMD Ryzen 9 5950X | |
| Intel Core i5-12600K | |
| Intel Core i9-12900K | |
| Intel Core i5-14600K | |
| Intel Core i5-13600K | |
| AMD Ryzen 7 7800X3D | |
| AMD Ryzen 7 7745HX | |
| AMD Ryzen 5 9600X | |
| AMD Ryzen 5 7600X | |
| AMD Ryzen 7 7840HS | |
| AMD Ryzen 9 7940HS | |
| Intel Core i5-13400 | |
| Intel Core i5-12400F | |
| R Benchmark 2.5 - Overall mean | |
| Intel Core i5-12400F | |
| Intel Core i5-13400 | |
| AMD Ryzen 9 5950X | |
| Intel Core i5-12600K | |
| AMD Ryzen 7 7840HS | |
| Intel Core i9-12900K | |
| AMD Ryzen 9 7940HS | |
| AMD Ryzen 7 7800X3D | |
| AMD Ryzen 7 7745HX | |
| Intel Core i5-13600K | |
| Intel Core i5-14600K | |
| AMD Ryzen 9 7945HX | |
| Intel Core i7-14700K | |
| AMD Ryzen 5 7600X | |
| AMD Ryzen 9 7900X | |
| AMD Ryzen 9 7950X3D | |
| AMD Ryzen 9 7950X | |
| Intel Core i9-13900K | |
| Intel Core i9-14900K | |
| AMD Ryzen 5 9600X | |
| LibreOffice - 20 Documents To PDF | |
| Intel Core i5-12600K | |
| AMD Ryzen 7 7840HS | |
| Intel Core i5-12400F | |
| AMD Ryzen 5 9600X | |
| AMD Ryzen 9 7940HS | |
| AMD Ryzen 9 5950X | |
| AMD Ryzen 7 7745HX | |
| AMD Ryzen 7 7800X3D | |
| Intel Core i9-12900K | |
| Intel Core i7-14700K | |
| Intel Core i5-13400 | |
| AMD Ryzen 9 7950X3D | |
| AMD Ryzen 5 7600X | |
| Intel Core i9-13900K | |
| AMD Ryzen 9 7950X | |
| AMD Ryzen 9 7945HX | |
| Intel Core i5-13600K | |
| AMD Ryzen 9 7900X | |
| Intel Core i9-14900K | |
| Intel Core i5-14600K | |
| WebXPRT 3 - Overall | |
| AMD Ryzen 9 7950X3D | |
| Intel Core i9-14900K | |
| AMD Ryzen 9 7900X | |
| AMD Ryzen 9 7950X | |
| AMD Ryzen 5 9600X | |
| AMD Ryzen 5 7600X | |
| Intel Core i9-13900K | |
| AMD Ryzen 9 7945HX | |
| Intel Core i5-14600K | |
| AMD Ryzen 7 7800X3D | |
| AMD Ryzen 7 7745HX | |
| Intel Core i7-14700K | |
| Intel Core i5-13600K | |
| AMD Ryzen 7 7840HS | |
| Intel Core i9-12900K | |
| Intel Core i5-13400 | |
| AMD Ryzen 9 7940HS | |
| Intel Core i5-12600K | |
| AMD Ryzen 9 5950X | |
| Intel Core i5-12400F | |
| Mozilla Kraken 1.1 - Total | |
| Intel Core i5-12400F | |
| AMD Ryzen 9 5950X | |
| Intel Core i5-13400 | |
| AMD Ryzen 7 7840HS | |
| Intel Core i5-12600K | |
| AMD Ryzen 7 7800X3D | |
| AMD Ryzen 9 7940HS | |
| Intel Core i9-12900K | |
| AMD Ryzen 7 7745HX | |
| Intel Core i5-13600K | |
| Intel Core i5-14600K | |
| AMD Ryzen 9 7945HX | |
| AMD Ryzen 5 7600X | |
| Intel Core i7-14700K | |
| AMD Ryzen 9 7950X3D | |
| AMD Ryzen 9 7950X | |
| Intel Core i9-13900K | |
| AMD Ryzen 9 7900X | |
| Intel Core i9-14900K | |
| AMD Ryzen 5 9600X | |
| 3DMark | |
| 1920x1080 Fire Strike Physics | |
| Intel Core i9-14900K | |
| Intel Core i9-13900K | |
| Intel Core i7-14700K | |
| AMD Ryzen 9 7950X3D | |
| AMD Ryzen 9 7900X | |
| AMD Ryzen 9 7950X | |
| Intel Core i5-14600K | |
| AMD Ryzen 9 5950X | |
| Intel Core i9-12900K | |
| AMD Ryzen 9 7945HX | |
| Intel Core i5-13600K | |
| AMD Ryzen 5 9600X | |
| AMD Ryzen 7 7800X3D | |
| AMD Ryzen 5 7600X | |
| Intel Core i5-12600K | |
| AMD Ryzen 7 7840HS | |
| AMD Ryzen 9 7940HS | |
| Intel Core i5-13400 | |
| Intel Core i5-12400F | |
| AMD Ryzen 7 7745HX | |
| 2560x1440 Time Spy CPU | |
| Intel Core i9-14900K | |
| Intel Core i7-14700K | |
| Intel Core i9-13900K | |
| Intel Core i5-14600K | |
| Intel Core i9-12900K | |
| AMD Ryzen 9 7950X3D | |
| Intel Core i5-13600K | |
| AMD Ryzen 9 7900X | |
| AMD Ryzen 9 7950X | |
| AMD Ryzen 7 7800X3D | |
| Intel Core i5-12600K | |
| AMD Ryzen 9 5950X | |
| Intel Core i5-13400 | |
| AMD Ryzen 9 7945HX | |
| AMD Ryzen 7 7840HS | |
| AMD Ryzen 7 7745HX | |
| AMD Ryzen 5 9600X | |
| AMD Ryzen 9 7940HS | |
| AMD Ryzen 5 7600X | |
| Intel Core i5-12400F | |
* ... a kisebb jobb
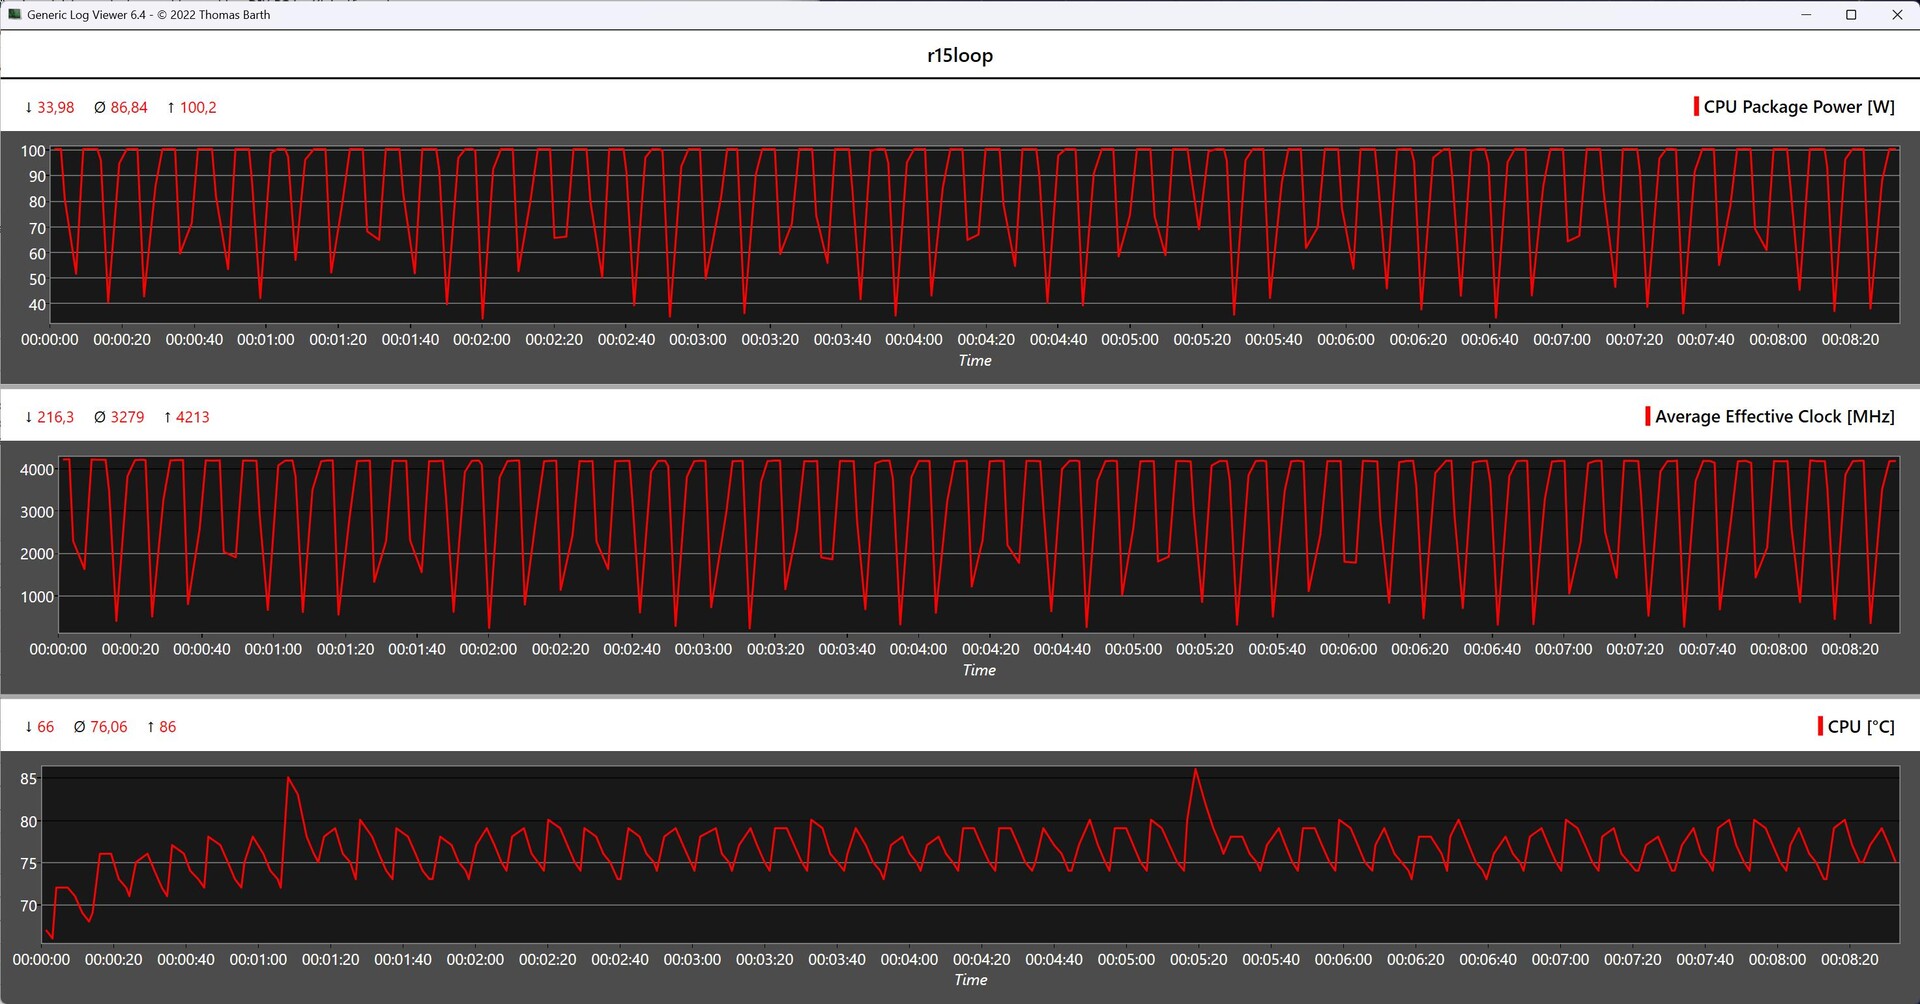
Cinebench eredmények AMD Ryzen 9 7945HX
A Minisforum BD790i alaplap az AMD Ryzen 9 7945HX processzorral kombinálva kiválóan teljesítette a Cinebench R15 folyamatos ciklusát. A 16 mag teljesítménye mind az 50 futtatás során stabil maradt, vagyis folyamatos terhelés mellett sem kell teljesítménycsökkenésre számítani. A gyárilag beszerelt hűtő jól teljesített ebben a tesztben.
A rendszer teljesítménye
A Minisforum BD790i alapú tesztrendszer nem mindig tudta tartani a lépést a versenytársakkal a rendszer teljesítményének összehasonlító tesztjei során. Ennek ellenére a rendszer teljesítménye általában elég magas volt. A nagy teljesítményű és ugyanakkor viszonylag takarékos AMD Ryzen 9 7945HX nem mutat gyengeségeket a mindennapi használat során. A gyors NVMe SSD és a DDR5 RAM kombinációja elegendő mozgásteret biztosít ahhoz, hogy még az energiaigényes feladatokkal is megbirkózzon.
| Performance rating - Percent | |
| AMD Ryzen 9 7950X3D, NVIDIA GeForce RTX 4090 -1! | |
| AMD Ryzen 9 7950X, NVIDIA GeForce RTX 3090 | |
| AMD Ryzen 9 7900X, NVIDIA GeForce RTX 3090 | |
| Intel Core i9-14900K, NVIDIA GeForce RTX 4090 | |
| AMD Ryzen 5 7600X, NVIDIA GeForce RTX 3090 | |
| Intel Core i9-13900K, NVIDIA GeForce RTX 3090 | |
| Intel Core i5-13600K, NVIDIA GeForce RTX 3090 | |
| Intel Core i5-14600K, NVIDIA GeForce RTX 4090 | |
| AMD Ryzen 7 7800X3D, NVIDIA GeForce RTX 4090 | |
| AMD Ryzen 9 5950X, NVIDIA Titan RTX | |
| Intel Core i9-12900K, NVIDIA Titan RTX | |
| Intel Core i5-13400, NVIDIA GeForce RTX 4090 | |
| AMD Ryzen 9 7945HX, AMD Radeon 610M | |
| Intel Core i5-12600K, NVIDIA Titan RTX | |
| AMD Ryzen 7 7745HX, AMD Radeon 610M | |
| AMD Ryzen 7 7840HS, AMD Radeon 780M | |
| AMD Ryzen 9 7940HS, AMD Radeon 780M | |
| Intel Core i5-12400F, NVIDIA GeForce RTX 4090 | |
| PCMark 10 | |
| Score | |
| Intel Core i9-14900K, NVIDIA GeForce RTX 4090 | |
| AMD Ryzen 9 7900X, NVIDIA GeForce RTX 3090 | |
| AMD Ryzen 9 7950X, NVIDIA GeForce RTX 3090 | |
| Intel Core i9-13900K, NVIDIA GeForce RTX 3090 | |
| Intel Core i5-14600K, NVIDIA GeForce RTX 4090 | |
| AMD Ryzen 7 7800X3D, NVIDIA GeForce RTX 4090 | |
| AMD Ryzen 5 7600X, NVIDIA GeForce RTX 3090 | |
| Intel Core i5-13600K, NVIDIA GeForce RTX 3090 | |
| AMD Ryzen 9 5950X, NVIDIA Titan RTX | |
| Intel Core i5-13400, NVIDIA GeForce RTX 4090 | |
| Intel Core i9-12900K, NVIDIA Titan RTX | |
| Intel Core i5-12600K, NVIDIA Titan RTX | |
| Intel Core i5-12400F, NVIDIA GeForce RTX 4090 | |
| AMD Ryzen 7 7840HS, AMD Radeon 780M | |
| AMD Ryzen 9 7940HS, AMD Radeon 780M | |
| AMD Ryzen 9 7945HX, AMD Radeon 610M | |
| AMD Ryzen 7 7745HX, AMD Radeon 610M | |
| Essentials | |
| Intel Core i9-13900K, NVIDIA GeForce RTX 3090 | |
| AMD Ryzen 9 7900X, NVIDIA GeForce RTX 3090 | |
| AMD Ryzen 9 7950X, NVIDIA GeForce RTX 3090 | |
| AMD Ryzen 9 7945HX, AMD Radeon 610M | |
| Intel Core i9-14900K, NVIDIA GeForce RTX 4090 | |
| Intel Core i5-13600K, NVIDIA GeForce RTX 3090 | |
| AMD Ryzen 5 7600X, NVIDIA GeForce RTX 3090 | |
| AMD Ryzen 9 7950X3D, NVIDIA GeForce RTX 4090 | |
| AMD Ryzen 7 7745HX, AMD Radeon 610M | |
| Intel Core i5-14600K, NVIDIA GeForce RTX 4090 | |
| AMD Ryzen 7 7800X3D, NVIDIA GeForce RTX 4090 | |
| AMD Ryzen 9 5950X, NVIDIA Titan RTX | |
| Intel Core i9-12900K, NVIDIA Titan RTX | |
| AMD Ryzen 7 7840HS, AMD Radeon 780M | |
| Intel Core i5-12600K, NVIDIA Titan RTX | |
| Intel Core i5-13400, NVIDIA GeForce RTX 4090 | |
| Intel Core i5-12400F, NVIDIA GeForce RTX 4090 | |
| AMD Ryzen 9 7940HS, AMD Radeon 780M | |
| Productivity | |
| AMD Ryzen 5 7600X, NVIDIA GeForce RTX 3090 | |
| AMD Ryzen 9 7950X3D, NVIDIA GeForce RTX 4090 | |
| AMD Ryzen 7 7800X3D, NVIDIA GeForce RTX 4090 | |
| Intel Core i5-14600K, NVIDIA GeForce RTX 4090 | |
| AMD Ryzen 9 7900X, NVIDIA GeForce RTX 3090 | |
| AMD Ryzen 9 7950X, NVIDIA GeForce RTX 3090 | |
| Intel Core i9-14900K, NVIDIA GeForce RTX 4090 | |
| Intel Core i5-13600K, NVIDIA GeForce RTX 3090 | |
| Intel Core i9-13900K, NVIDIA GeForce RTX 3090 | |
| AMD Ryzen 9 5950X, NVIDIA Titan RTX | |
| AMD Ryzen 9 7945HX, AMD Radeon 610M | |
| AMD Ryzen 7 7745HX, AMD Radeon 610M | |
| Intel Core i5-12600K, NVIDIA Titan RTX | |
| Intel Core i5-13400, NVIDIA GeForce RTX 4090 | |
| AMD Ryzen 7 7840HS, AMD Radeon 780M | |
| Intel Core i9-12900K, NVIDIA Titan RTX | |
| AMD Ryzen 9 7940HS, AMD Radeon 780M | |
| Intel Core i5-12400F, NVIDIA GeForce RTX 4090 | |
| CrossMark / Overall | |
| Intel Core i9-14900K, NVIDIA GeForce RTX 4090 | |
| Intel Core i9-13900K, NVIDIA GeForce RTX 3090 | |
| AMD Ryzen 9 7950X, NVIDIA GeForce RTX 3090 | |
| AMD Ryzen 9 7900X, NVIDIA GeForce RTX 3090 | |
| Intel Core i5-14600K, NVIDIA GeForce RTX 4090 | |
| Intel Core i5-13600K, NVIDIA GeForce RTX 3090 | |
| AMD Ryzen 9 7945HX, AMD Radeon 610M | |
| AMD Ryzen 5 7600X, NVIDIA GeForce RTX 3090 | |
| AMD Ryzen 7 7800X3D, NVIDIA GeForce RTX 4090 | |
| AMD Ryzen 9 7950X3D, NVIDIA GeForce RTX 4090 | |
| AMD Ryzen 7 7745HX, AMD Radeon 610M | |
| Intel Core i5-13400, NVIDIA GeForce RTX 4090 | |
| Intel Core i5-12400F, NVIDIA GeForce RTX 4090 | |
| AMD Ryzen 7 7840HS, AMD Radeon 780M | |
| AMD Ryzen 9 7940HS, AMD Radeon 780M | |
| AMD Ryzen 9 5950X, NVIDIA Titan RTX | |
| CrossMark / Productivity | |
| Intel Core i9-14900K, NVIDIA GeForce RTX 4090 | |
| Intel Core i9-13900K, NVIDIA GeForce RTX 3090 | |
| AMD Ryzen 9 7950X, NVIDIA GeForce RTX 3090 | |
| AMD Ryzen 9 7900X, NVIDIA GeForce RTX 3090 | |
| Intel Core i5-14600K, NVIDIA GeForce RTX 4090 | |
| Intel Core i5-13600K, NVIDIA GeForce RTX 3090 | |
| AMD Ryzen 5 7600X, NVIDIA GeForce RTX 3090 | |
| AMD Ryzen 9 7945HX, AMD Radeon 610M | |
| AMD Ryzen 7 7800X3D, NVIDIA GeForce RTX 4090 | |
| AMD Ryzen 7 7745HX, AMD Radeon 610M | |
| AMD Ryzen 9 7950X3D, NVIDIA GeForce RTX 4090 | |
| Intel Core i5-13400, NVIDIA GeForce RTX 4090 | |
| AMD Ryzen 9 7940HS, AMD Radeon 780M | |
| Intel Core i5-12400F, NVIDIA GeForce RTX 4090 | |
| AMD Ryzen 7 7840HS, AMD Radeon 780M | |
| AMD Ryzen 9 5950X, NVIDIA Titan RTX | |
| CrossMark / Creativity | |
| Intel Core i9-14900K, NVIDIA GeForce RTX 4090 | |
| AMD Ryzen 9 7950X, NVIDIA GeForce RTX 3090 | |
| Intel Core i9-13900K, NVIDIA GeForce RTX 3090 | |
| AMD Ryzen 9 7900X, NVIDIA GeForce RTX 3090 | |
| Intel Core i5-14600K, NVIDIA GeForce RTX 4090 | |
| AMD Ryzen 9 7950X3D, NVIDIA GeForce RTX 4090 | |
| AMD Ryzen 9 7945HX, AMD Radeon 610M | |
| AMD Ryzen 7 7800X3D, NVIDIA GeForce RTX 4090 | |
| AMD Ryzen 5 7600X, NVIDIA GeForce RTX 3090 | |
| Intel Core i5-13600K, NVIDIA GeForce RTX 3090 | |
| AMD Ryzen 7 7745HX, AMD Radeon 610M | |
| AMD Ryzen 7 7840HS, AMD Radeon 780M | |
| Intel Core i5-13400, NVIDIA GeForce RTX 4090 | |
| AMD Ryzen 9 7940HS, AMD Radeon 780M | |
| Intel Core i5-12400F, NVIDIA GeForce RTX 4090 | |
| AMD Ryzen 9 5950X, NVIDIA Titan RTX | |
| CrossMark / Responsiveness | |
| Intel Core i9-13900K, NVIDIA GeForce RTX 3090 | |
| Intel Core i9-14900K, NVIDIA GeForce RTX 4090 | |
| Intel Core i5-13600K, NVIDIA GeForce RTX 3090 | |
| AMD Ryzen 9 7950X, NVIDIA GeForce RTX 3090 | |
| AMD Ryzen 9 7900X, NVIDIA GeForce RTX 3090 | |
| AMD Ryzen 5 7600X, NVIDIA GeForce RTX 3090 | |
| Intel Core i5-14600K, NVIDIA GeForce RTX 4090 | |
| AMD Ryzen 7 7800X3D, NVIDIA GeForce RTX 4090 | |
| AMD Ryzen 9 7945HX, AMD Radeon 610M | |
| AMD Ryzen 7 7745HX, AMD Radeon 610M | |
| Intel Core i5-13400, NVIDIA GeForce RTX 4090 | |
| Intel Core i5-12400F, NVIDIA GeForce RTX 4090 | |
| AMD Ryzen 9 7950X3D, NVIDIA GeForce RTX 4090 | |
| AMD Ryzen 9 7940HS, AMD Radeon 780M | |
| AMD Ryzen 7 7840HS, AMD Radeon 780M | |
| AMD Ryzen 9 5950X, NVIDIA Titan RTX | |
| AIDA64 / Memory Copy | |
| Intel Core i9-14900K, NVIDIA GeForce RTX 4090 | |
| Intel Core i9-14900K, NVIDIA GeForce RTX 4090 | |
| Intel Core i5-14600K, NVIDIA GeForce RTX 4090 | |
| Intel Core i9-13900K, NVIDIA GeForce RTX 3090 | |
| AMD Ryzen 9 7950X3D, NVIDIA GeForce RTX 4090 | |
| Intel Core i9-12900K, NVIDIA Titan RTX | |
| AMD Ryzen 9 7950X, NVIDIA GeForce RTX 3090 | |
| Intel Core i5-13400, NVIDIA GeForce RTX 4090 | |
| Intel Core i5-13600K, NVIDIA GeForce RTX 3090 | |
| Intel Core i5-12400F, NVIDIA GeForce RTX 4090 | |
| Intel Core i5-12600K, NVIDIA Titan RTX | |
| Az osztály átlaga Desktop (54743 - 98416, n=21, az elmúlt 2 évben) | |
| AMD Ryzen 9 7900X, NVIDIA GeForce RTX 3090 | |
| AMD Ryzen 7 7840HS, AMD Radeon 780M | |
| AMD Ryzen 7 7800X3D, NVIDIA GeForce RTX 4090 | |
| AMD Ryzen 9 7940HS, AMD Radeon 780M | |
| AMD Ryzen 5 7600X, NVIDIA GeForce RTX 3090 | |
| AMD Ryzen 9 5950X, NVIDIA Titan RTX | |
| AMD Ryzen 9 7945HX, AMD Radeon 610M | |
| AMD Ryzen 7 7745HX, AMD Radeon 610M | |
| Átlagos AMD Ryzen 9 7945HX (48948 - 57953, n=7) | |
| AIDA64 / Memory Read | |
| Intel Core i9-14900K, NVIDIA GeForce RTX 4090 | |
| Intel Core i9-14900K, NVIDIA GeForce RTX 4090 | |
| Intel Core i5-14600K, NVIDIA GeForce RTX 4090 | |
| Intel Core i9-13900K, NVIDIA GeForce RTX 3090 | |
| Intel Core i9-12900K, NVIDIA Titan RTX | |
| AMD Ryzen 9 7950X3D, NVIDIA GeForce RTX 4090 | |
| AMD Ryzen 9 7950X, NVIDIA GeForce RTX 3090 | |
| Intel Core i5-13400, NVIDIA GeForce RTX 4090 | |
| Intel Core i5-12600K, NVIDIA Titan RTX | |
| Intel Core i5-13600K, NVIDIA GeForce RTX 3090 | |
| Az osztály átlaga Desktop (58375 - 110448, n=21, az elmúlt 2 évben) | |
| AMD Ryzen 9 7900X, NVIDIA GeForce RTX 3090 | |
| Intel Core i5-12400F, NVIDIA GeForce RTX 4090 | |
| AMD Ryzen 9 7945HX, AMD Radeon 610M | |
| AMD Ryzen 9 5950X, NVIDIA Titan RTX | |
| AMD Ryzen 7 7800X3D, NVIDIA GeForce RTX 4090 | |
| AMD Ryzen 7 7840HS, AMD Radeon 780M | |
| AMD Ryzen 9 7940HS, AMD Radeon 780M | |
| Átlagos AMD Ryzen 9 7945HX (56910 - 67753, n=7) | |
| AMD Ryzen 5 7600X, NVIDIA GeForce RTX 3090 | |
| AMD Ryzen 7 7745HX, AMD Radeon 610M | |
| AIDA64 / Memory Write | |
| AMD Ryzen 7 7800X3D, NVIDIA GeForce RTX 4090 | |
| AMD Ryzen 7 7840HS, AMD Radeon 780M | |
| AMD Ryzen 9 7950X3D, NVIDIA GeForce RTX 4090 | |
| Intel Core i5-14600K, NVIDIA GeForce RTX 4090 | |
| Intel Core i9-14900K, NVIDIA GeForce RTX 4090 | |
| Intel Core i9-14900K, NVIDIA GeForce RTX 4090 | |
| AMD Ryzen 5 7600X, NVIDIA GeForce RTX 3090 | |
| AMD Ryzen 9 7950X, NVIDIA GeForce RTX 3090 | |
| AMD Ryzen 9 7940HS, AMD Radeon 780M | |
| Az osztály átlaga Desktop (60635 - 93889, n=21, az elmúlt 2 évben) | |
| AMD Ryzen 9 7900X, NVIDIA GeForce RTX 3090 | |
| Intel Core i9-13900K, NVIDIA GeForce RTX 3090 | |
| Intel Core i5-13400, NVIDIA GeForce RTX 4090 | |
| Intel Core i5-12600K, NVIDIA Titan RTX | |
| Intel Core i5-12400F, NVIDIA GeForce RTX 4090 | |
| Intel Core i9-12900K, NVIDIA Titan RTX | |
| Intel Core i5-13600K, NVIDIA GeForce RTX 3090 | |
| AMD Ryzen 7 7745HX, AMD Radeon 610M | |
| AMD Ryzen 9 7945HX, AMD Radeon 610M | |
| Átlagos AMD Ryzen 9 7945HX (58602 - 70063, n=7) | |
| AMD Ryzen 9 5950X, NVIDIA Titan RTX | |
| AIDA64 / Memory Latency | |
| AMD Ryzen 7 7840HS, AMD Radeon 780M | |
| Az osztály átlaga Desktop (68.5 - 168, n=21, az elmúlt 2 évben) | |
| AMD Ryzen 9 7940HS, AMD Radeon 780M | |
| Átlagos AMD Ryzen 9 7945HX (77.1 - 91.3, n=7) | |
| Intel Core i5-13600K, NVIDIA GeForce RTX 3090 | |
| AMD Ryzen 7 7745HX, AMD Radeon 610M | |
| Intel Core i5-12400F, NVIDIA GeForce RTX 4090 | |
| Intel Core i5-13400, NVIDIA GeForce RTX 4090 | |
| AMD Ryzen 9 7945HX, AMD Radeon 610M | |
| Intel Core i9-13900K, NVIDIA GeForce RTX 3090 | |
| Intel Core i9-14900K, NVIDIA GeForce RTX 4090 | |
| Intel Core i9-14900K, NVIDIA GeForce RTX 4090 | |
| Intel Core i5-14600K, NVIDIA GeForce RTX 4090 | |
| AMD Ryzen 7 7800X3D, NVIDIA GeForce RTX 4090 | |
| AMD Ryzen 9 5950X, NVIDIA Titan RTX | |
| AMD Ryzen 9 7950X3D, NVIDIA GeForce RTX 4090 | |
| AMD Ryzen 5 7600X, NVIDIA GeForce RTX 3090 | |
| AMD Ryzen 9 7900X, NVIDIA GeForce RTX 3090 | |
| AMD Ryzen 9 7950X, NVIDIA GeForce RTX 3090 | |
* ... a kisebb jobb
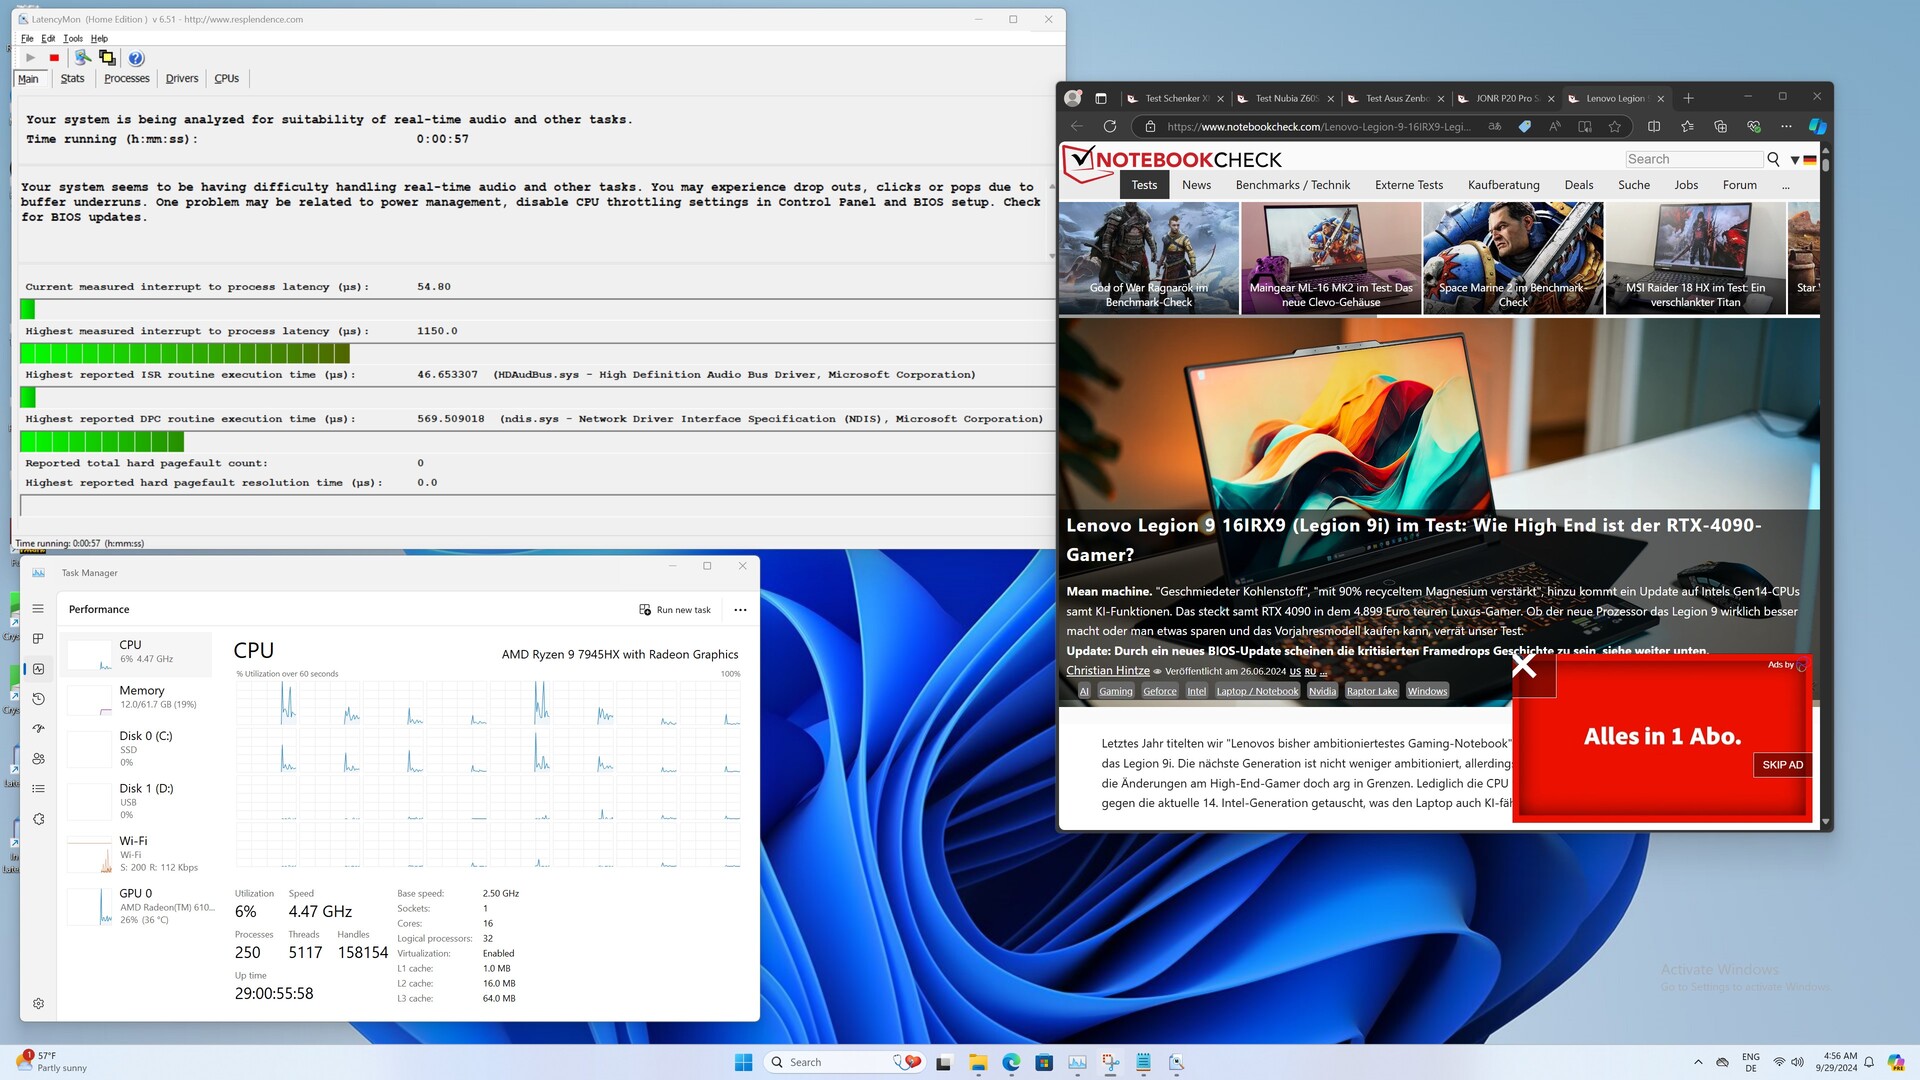
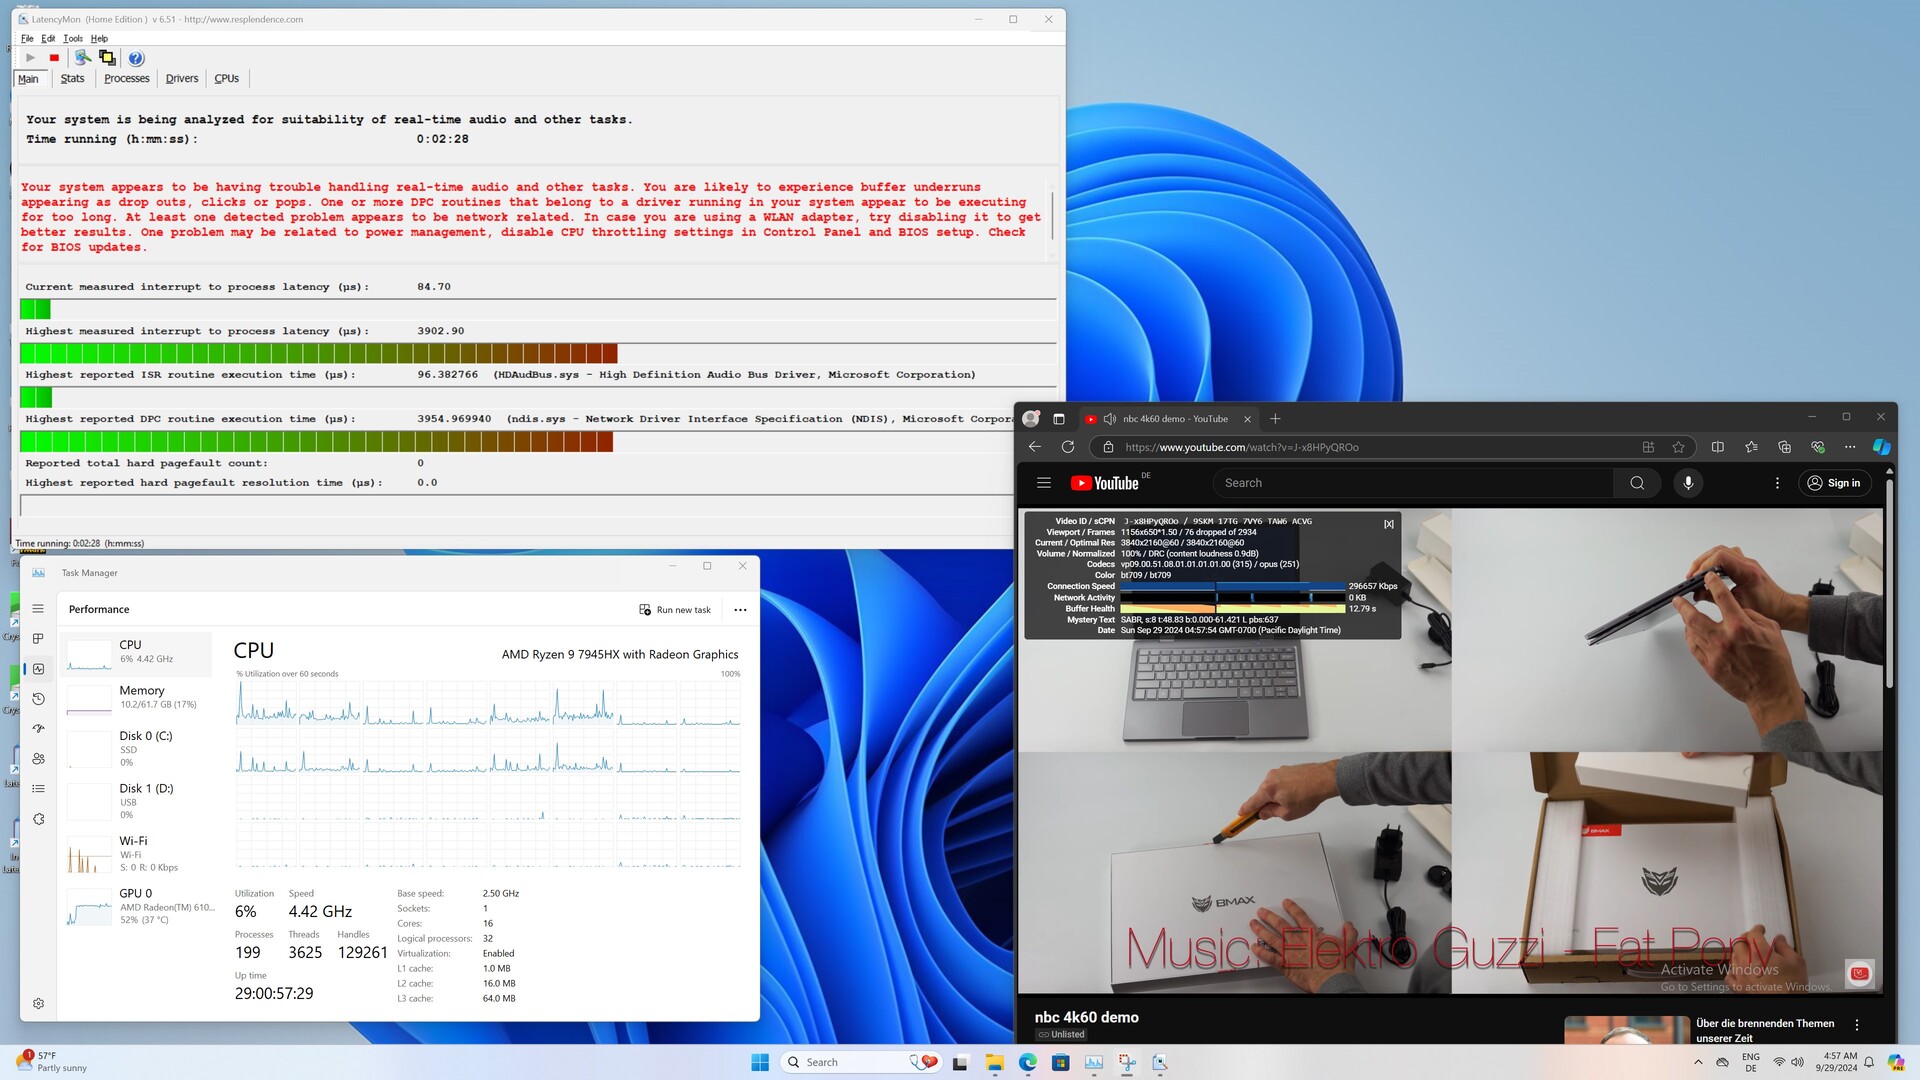
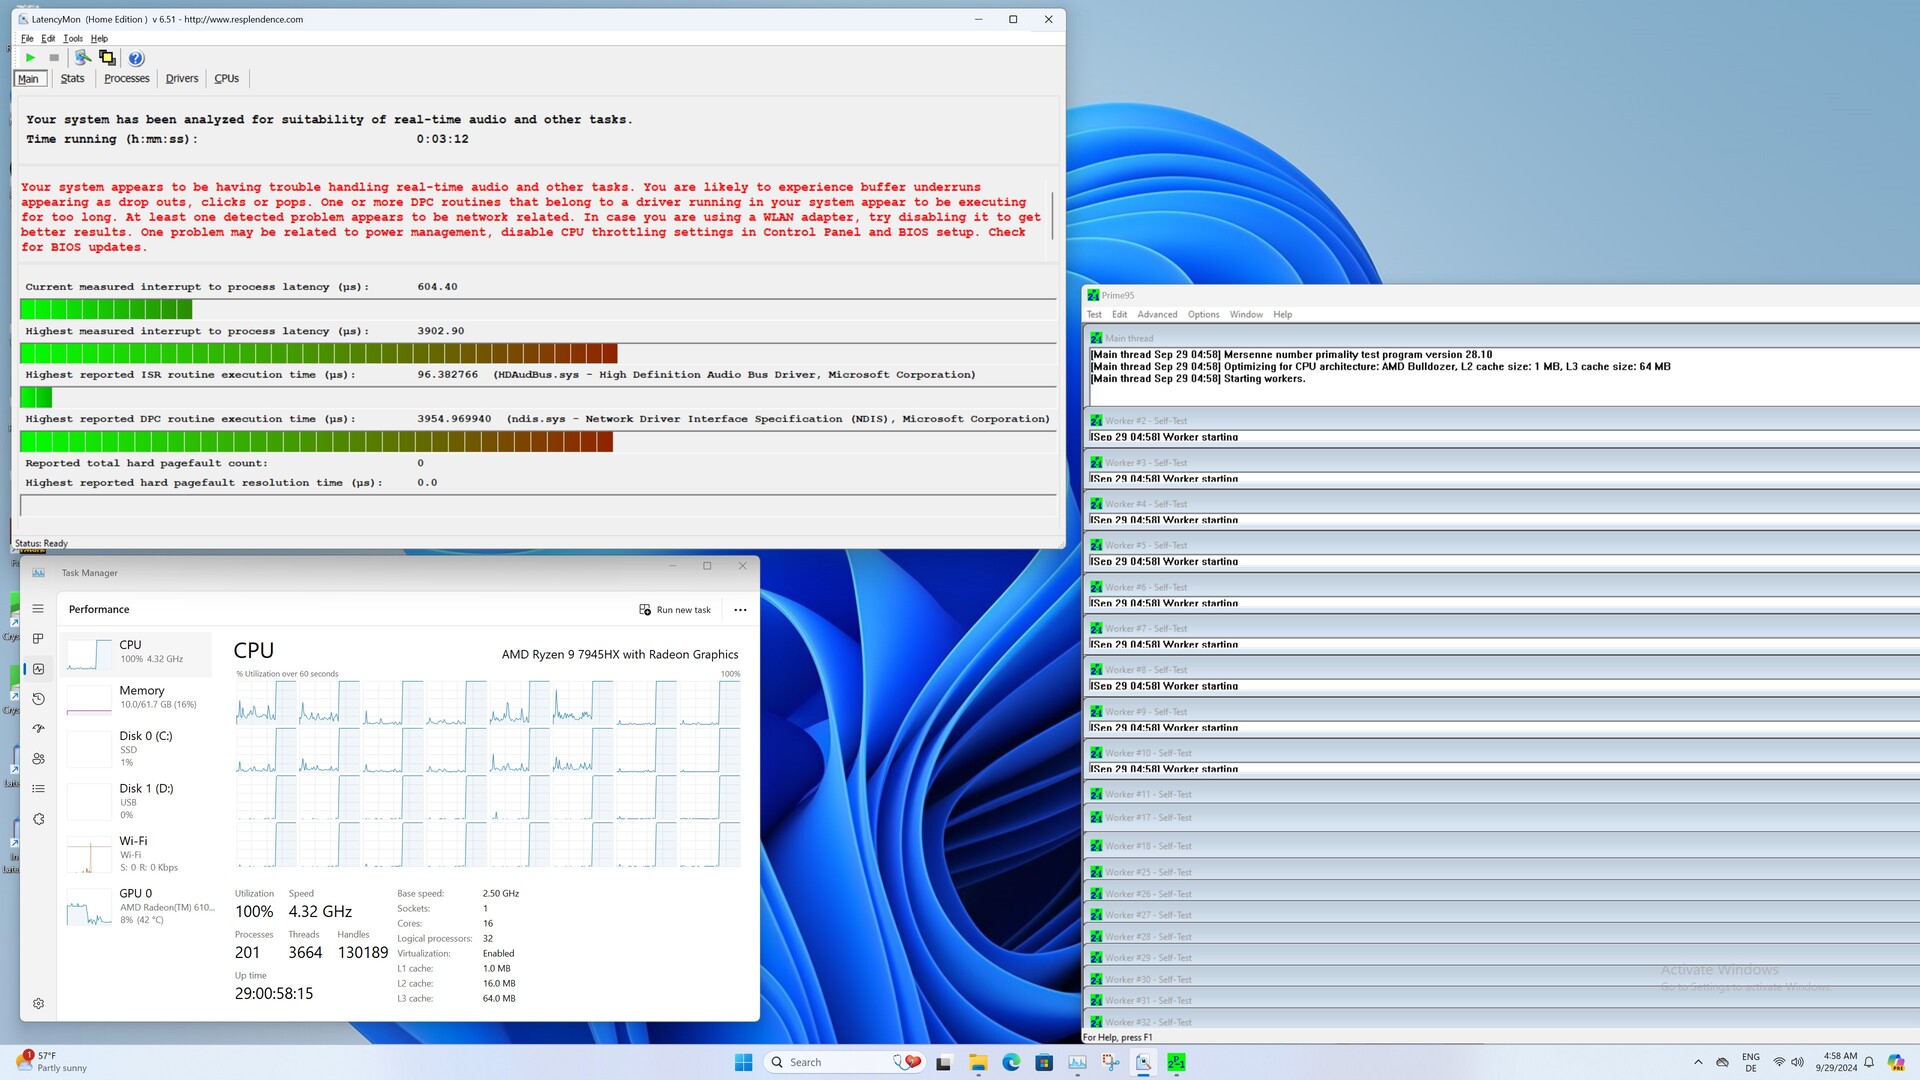
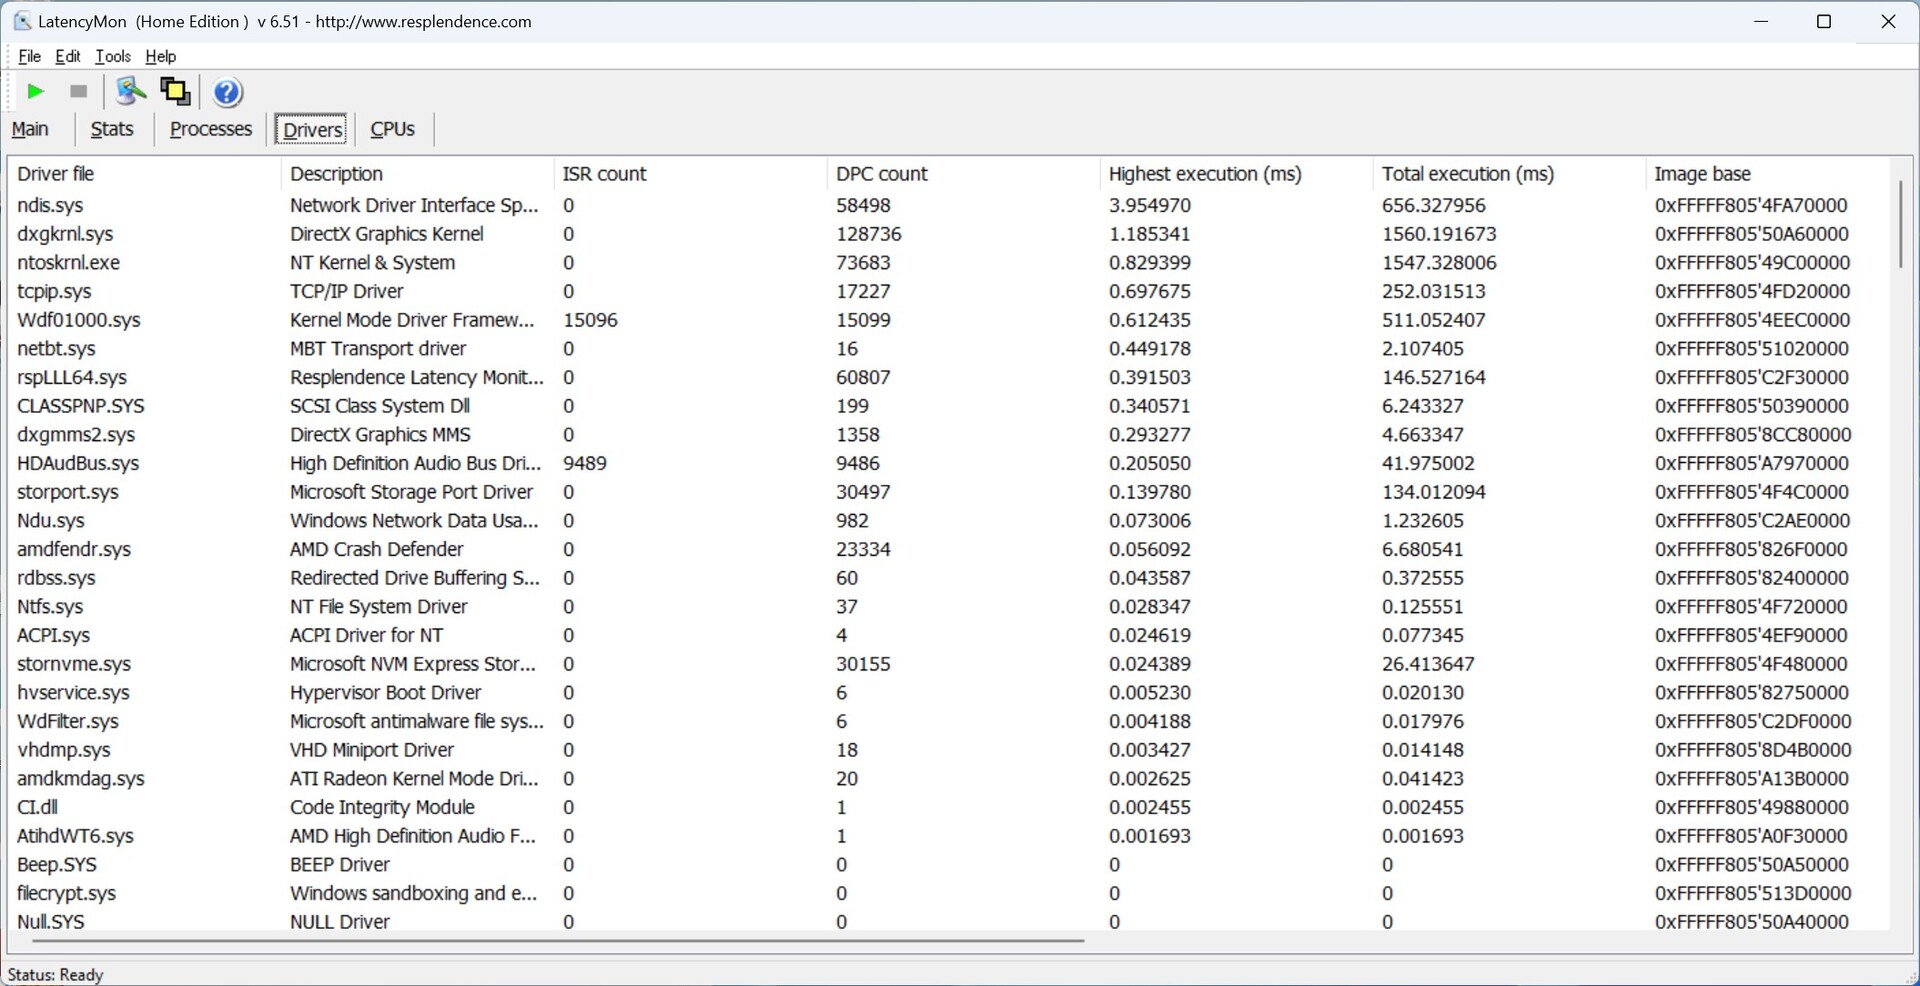
DPC késleltetések
A Minisforum BD790i alapú tesztrendszerünkben viszonylag magas késleltetési időt mértünk. Megnövekedett értékeket dokumentáltunk még egyszerű webes szörfözés közben is. Ezek tovább nőttek a 4K-s tesztvideók lejátszásakor, ami azt jelenti, hogy a rendszer ebben a konfigurációban nem tűnik alkalmasnak valós idejű videó- és hanganyagok feldolgozására.
| DPC Latencies / LatencyMon - interrupt to process latency (max), Web, Youtube, Prime95 | |
| Minisforum BD790i | |
| Minisforum EliteMini UM780 XTX | |
| Minisforum Venus Series UM790 Pro | |
| Minisforum BD770i | |
* ... a kisebb jobb
Tárolóeszközök
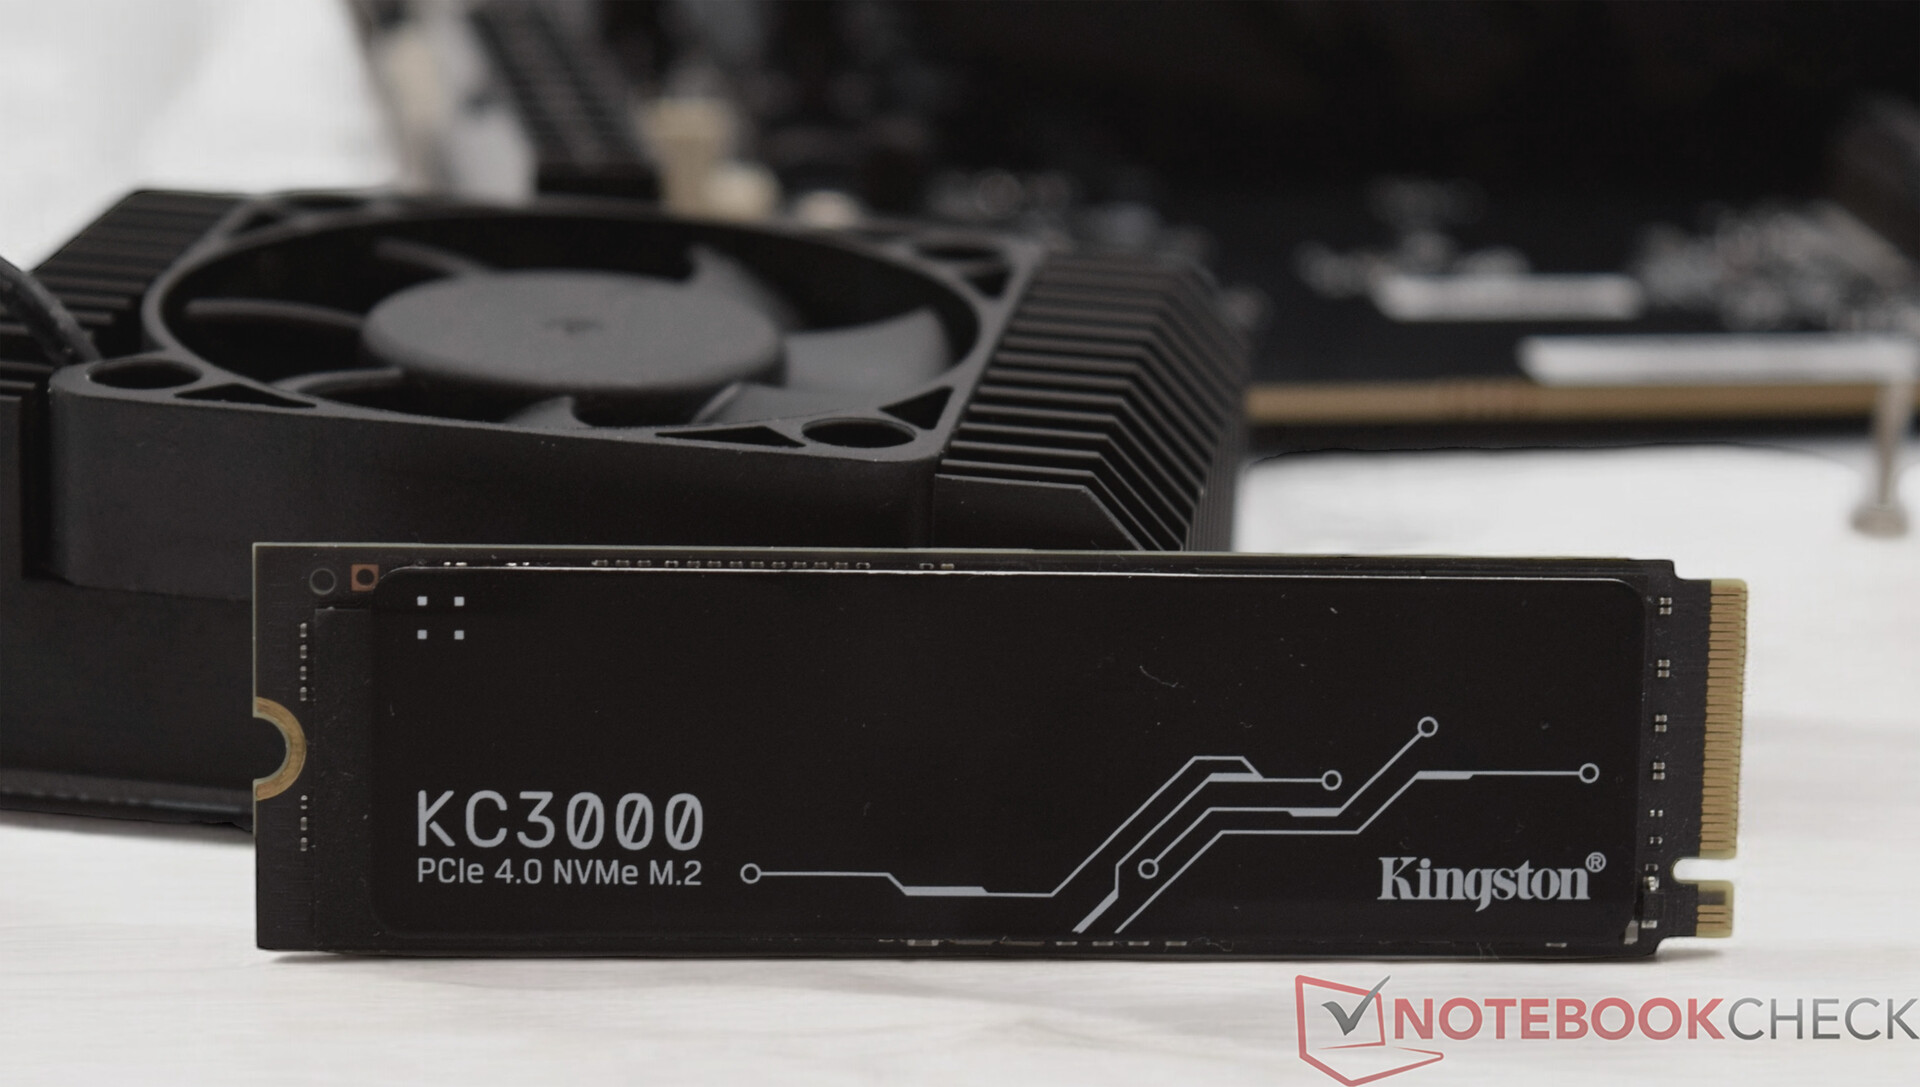
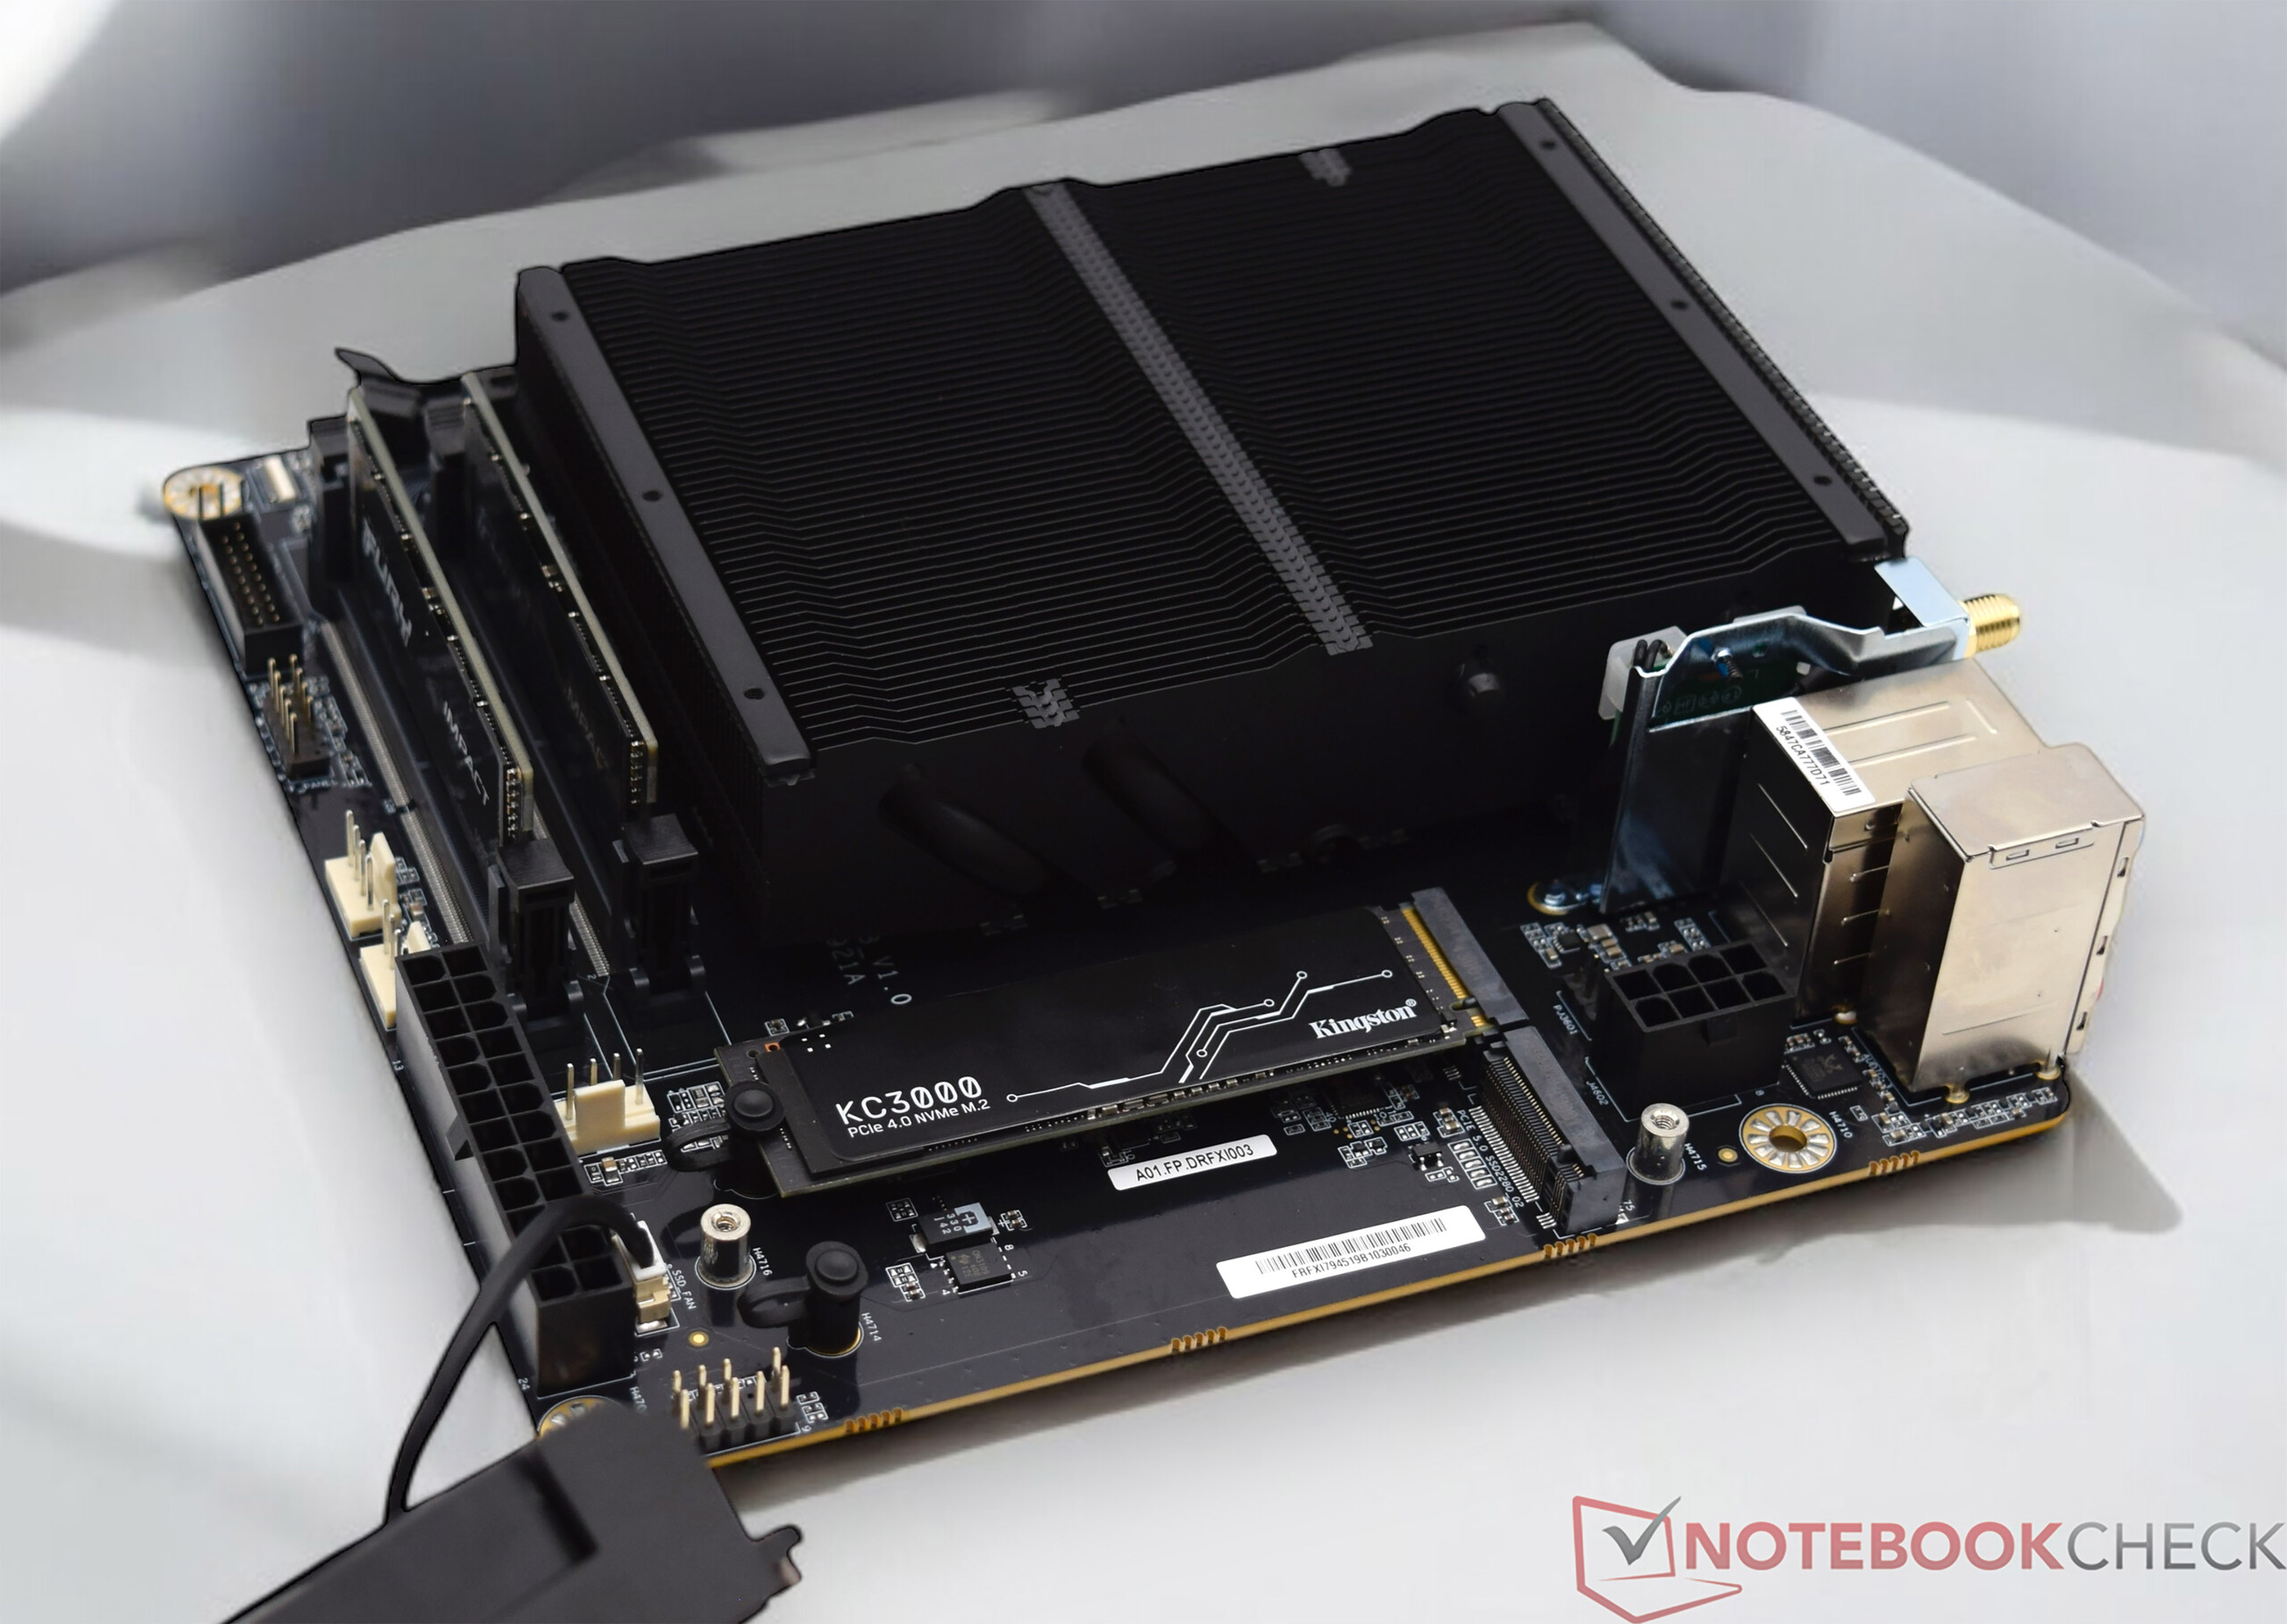
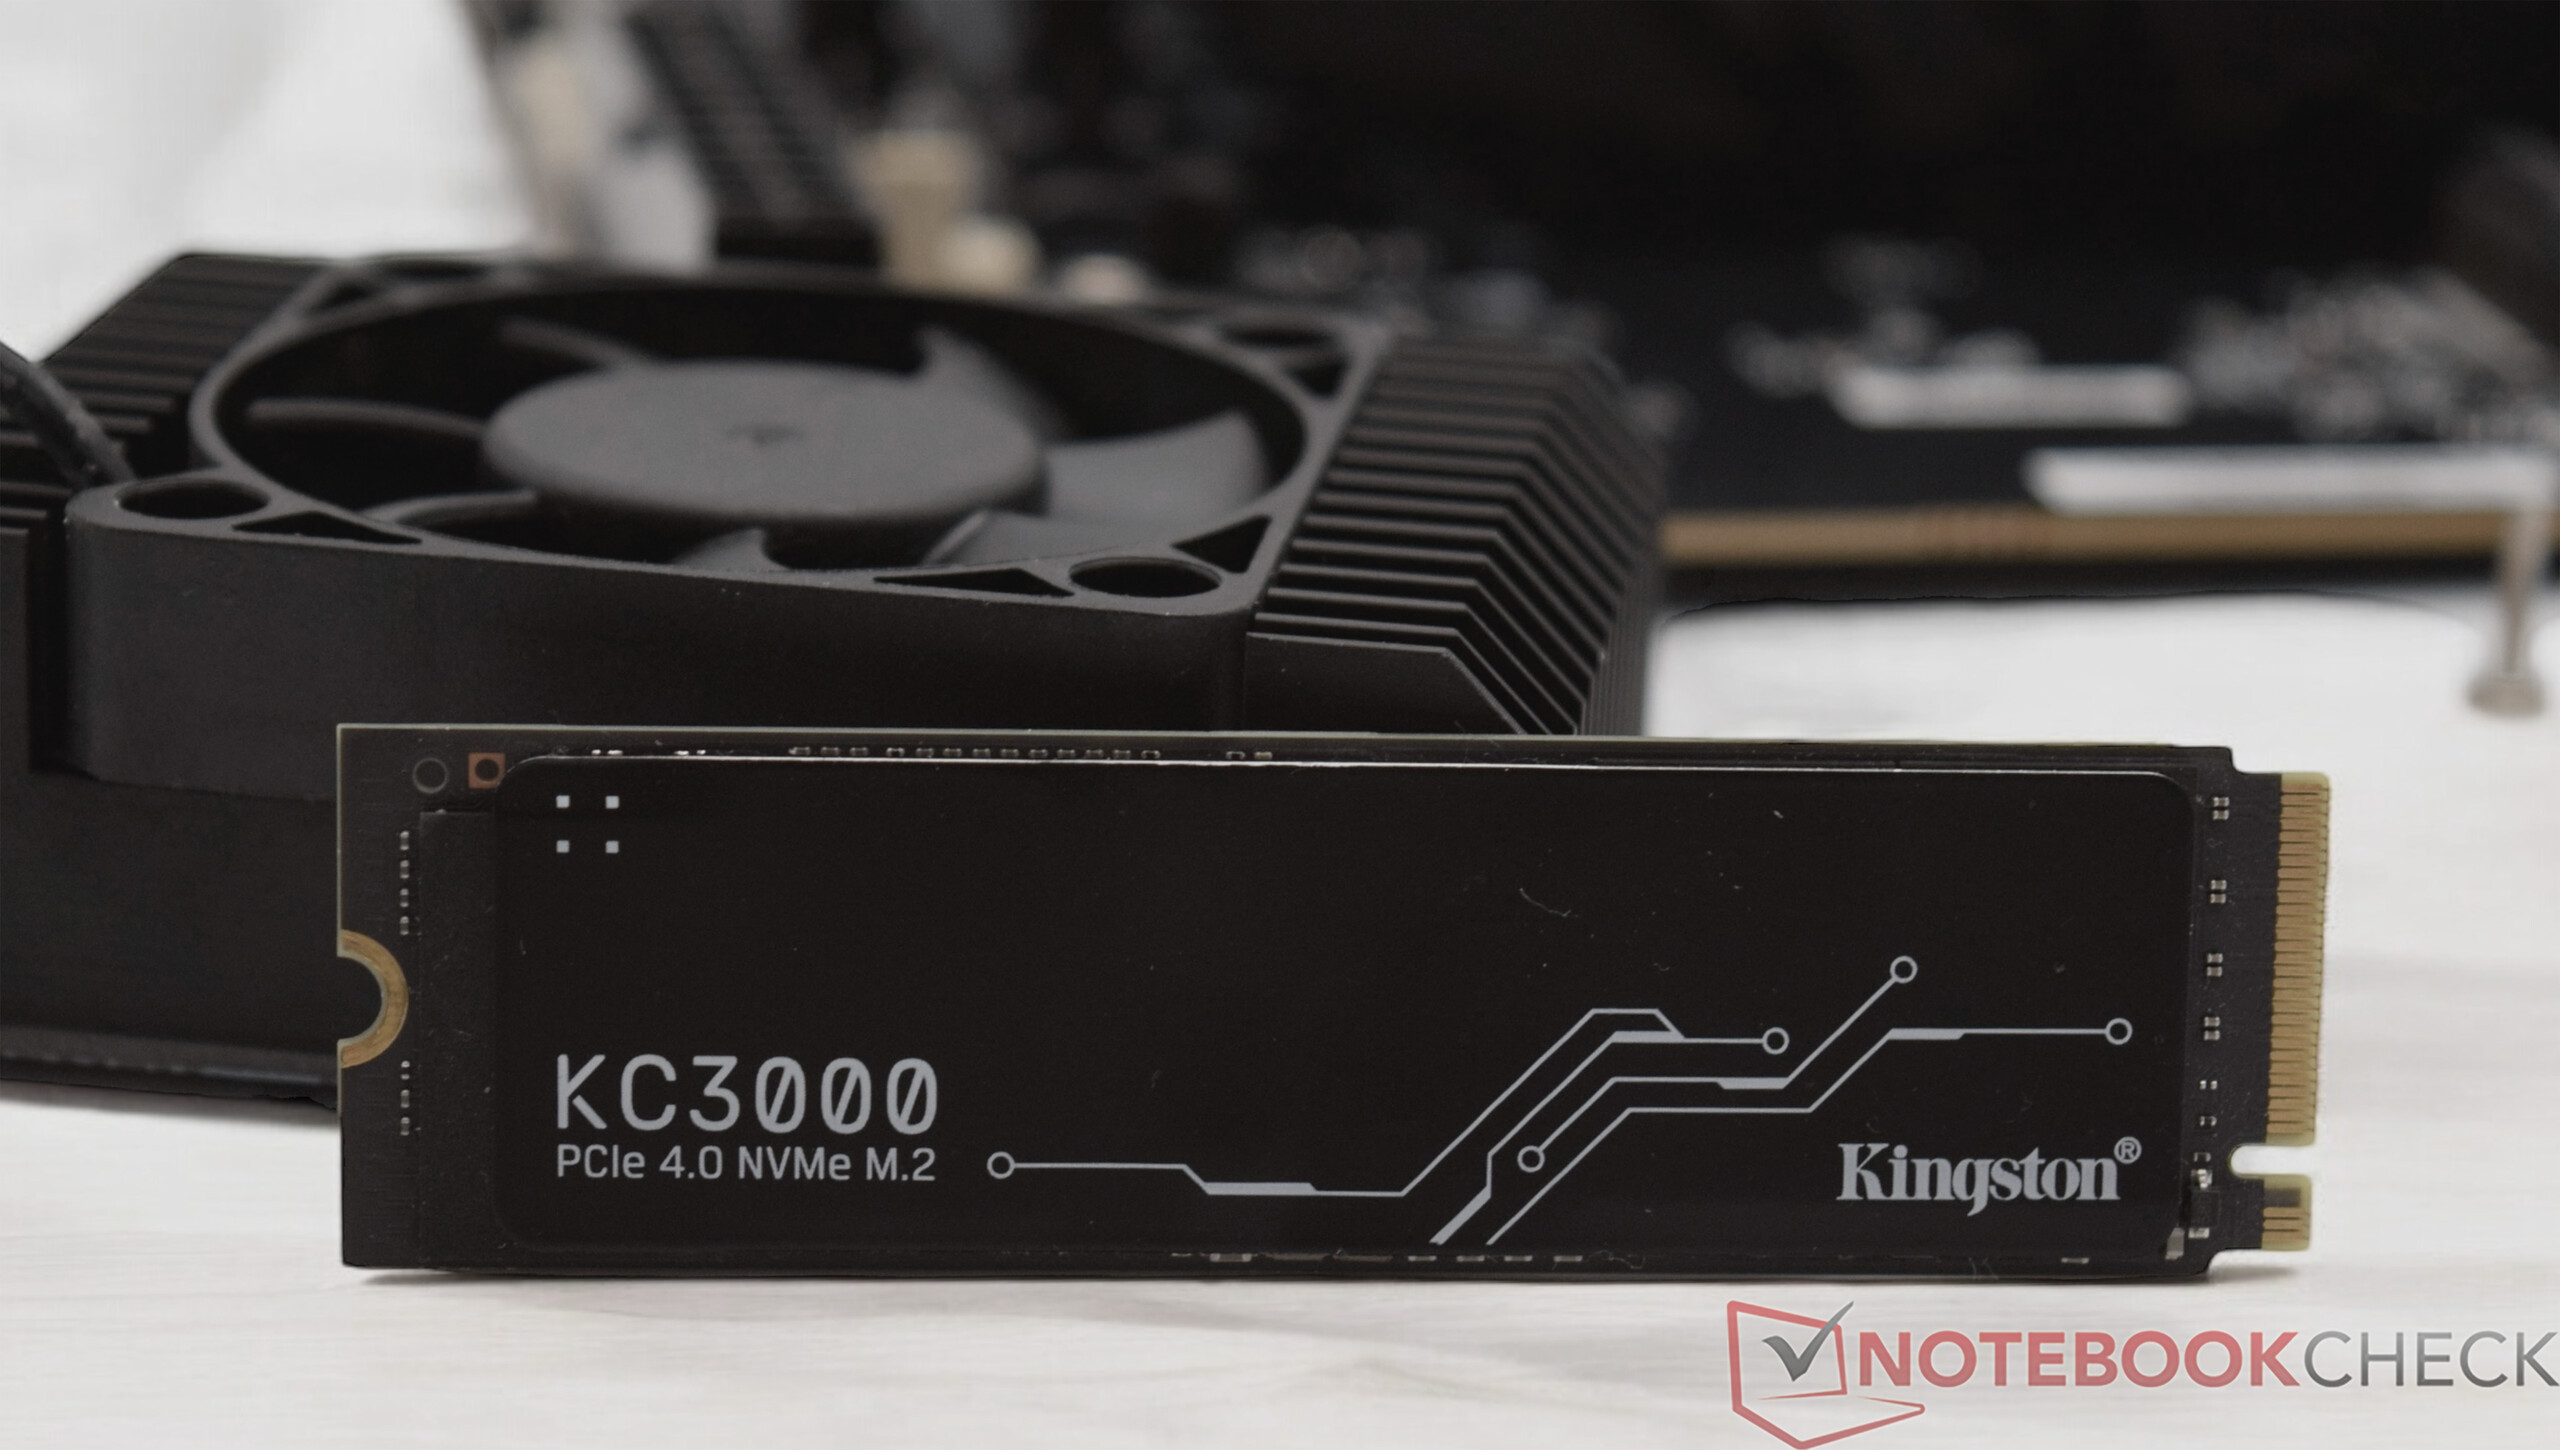
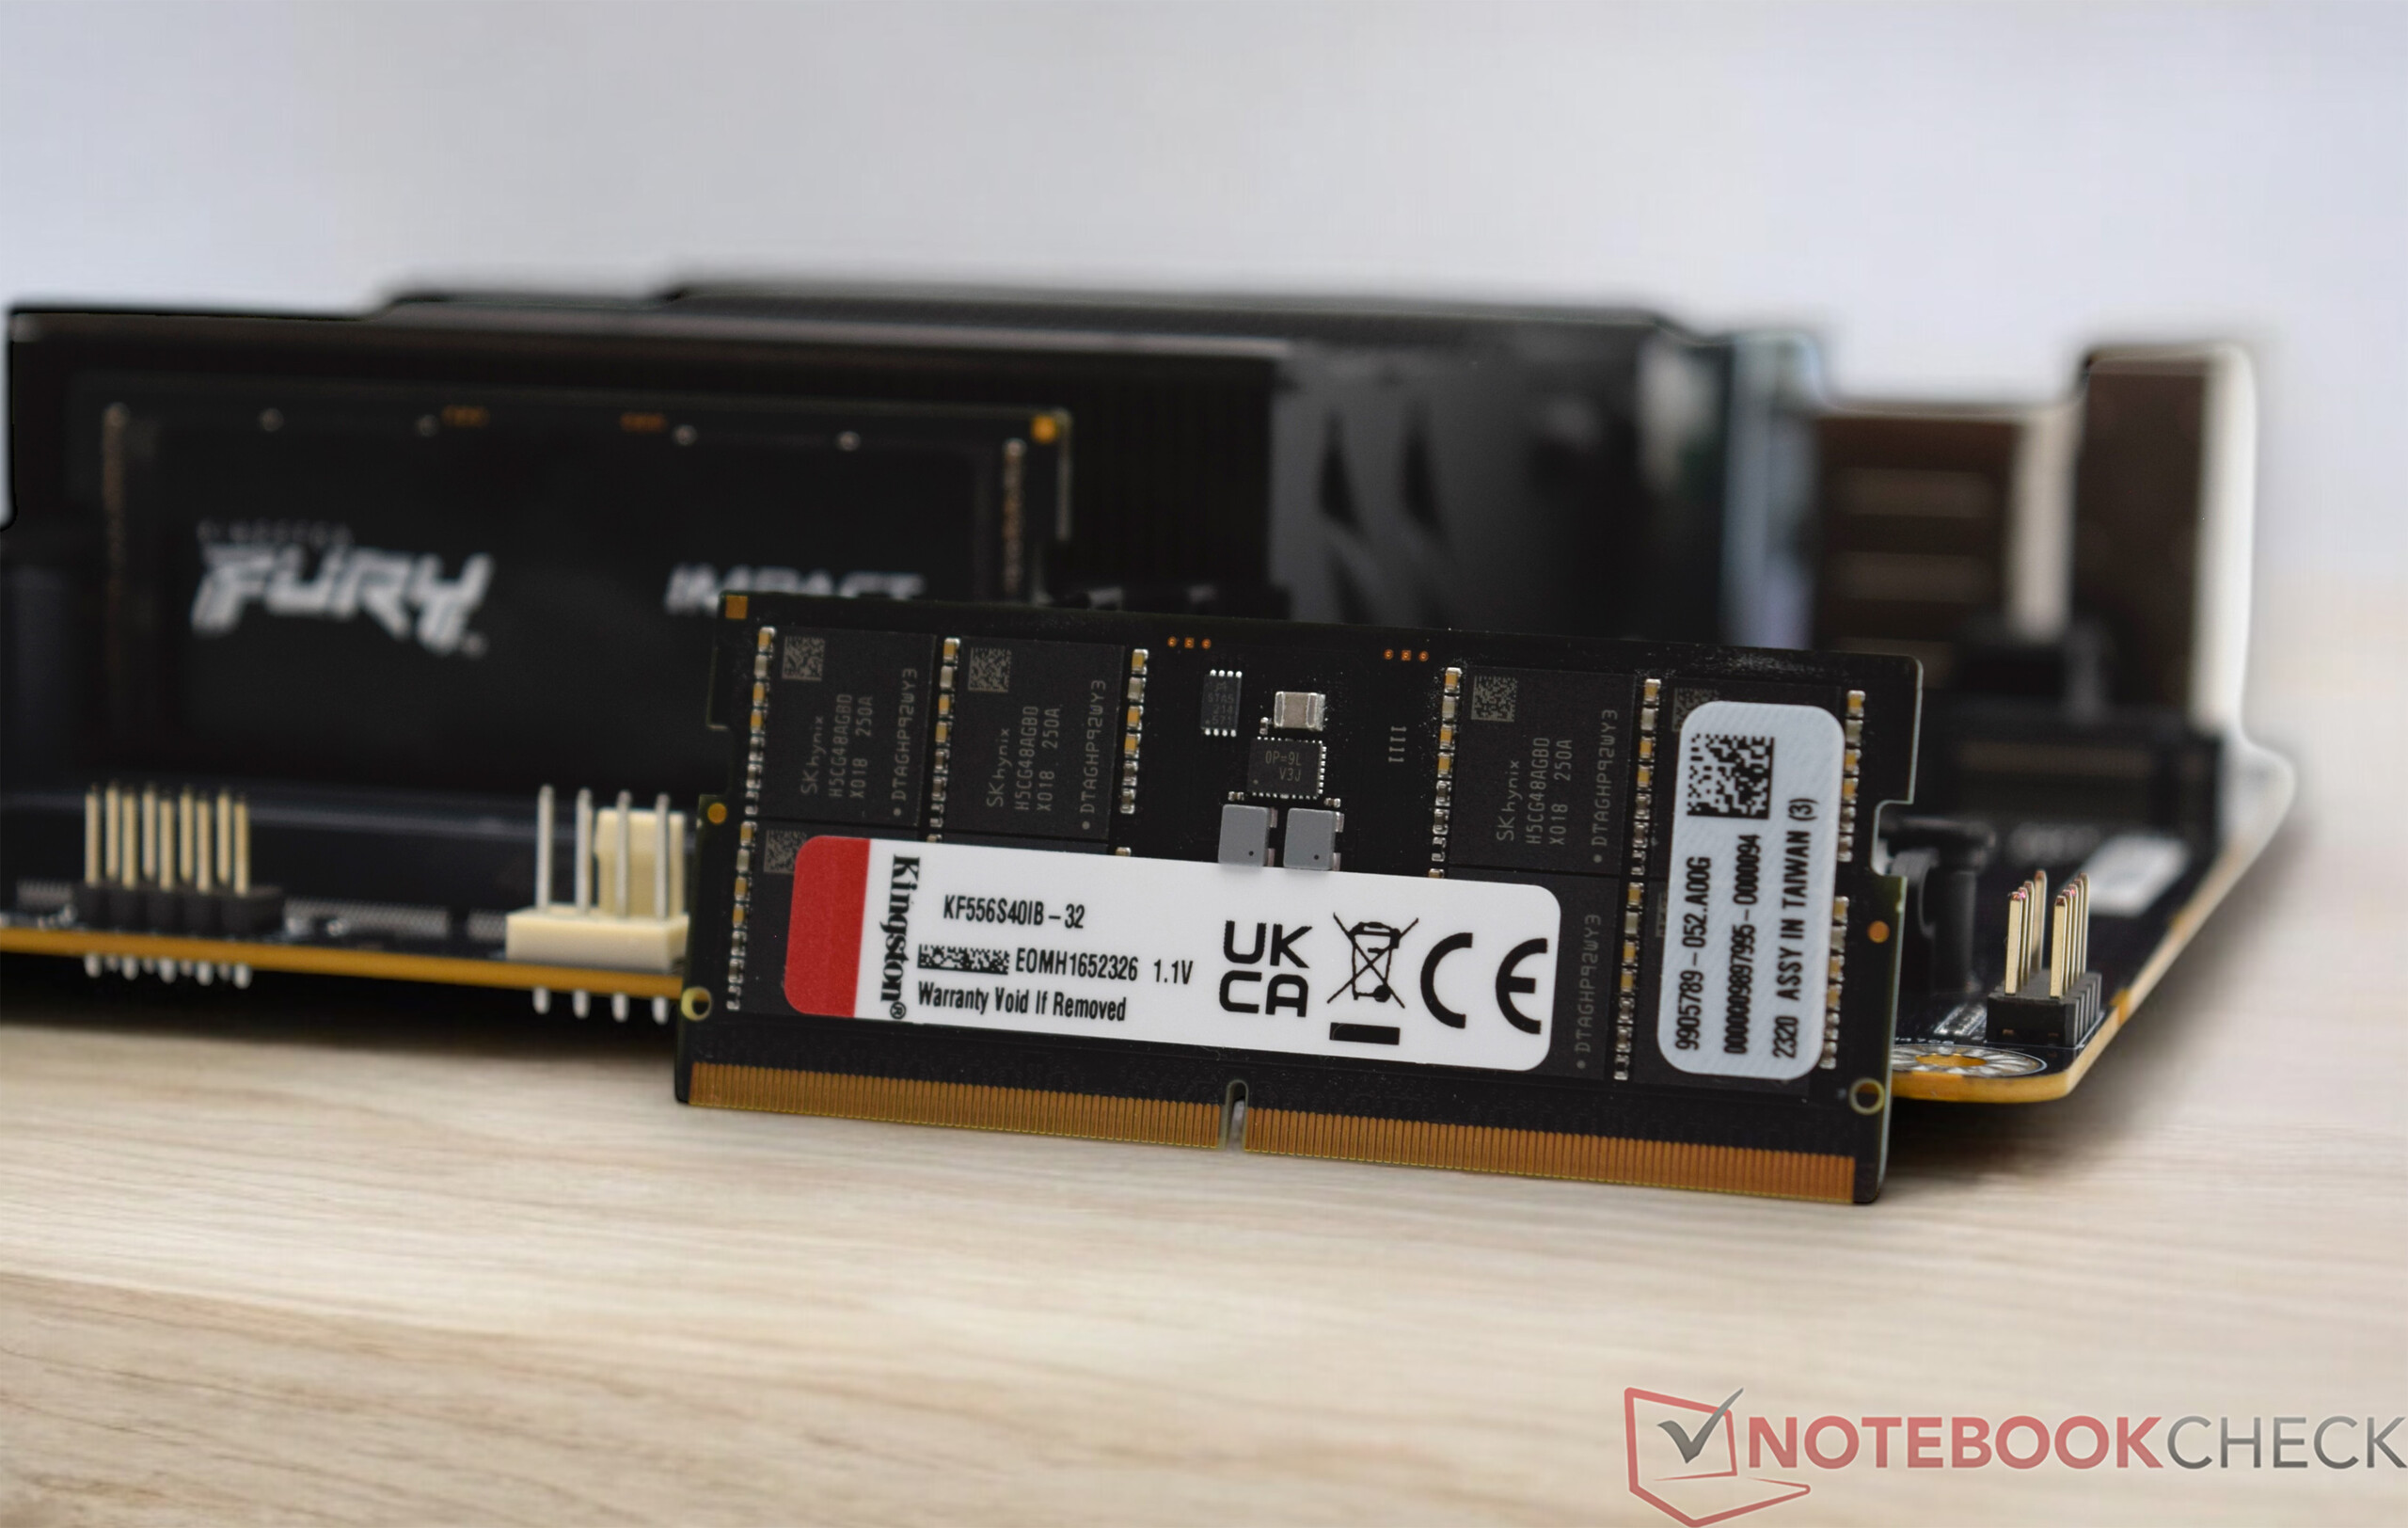
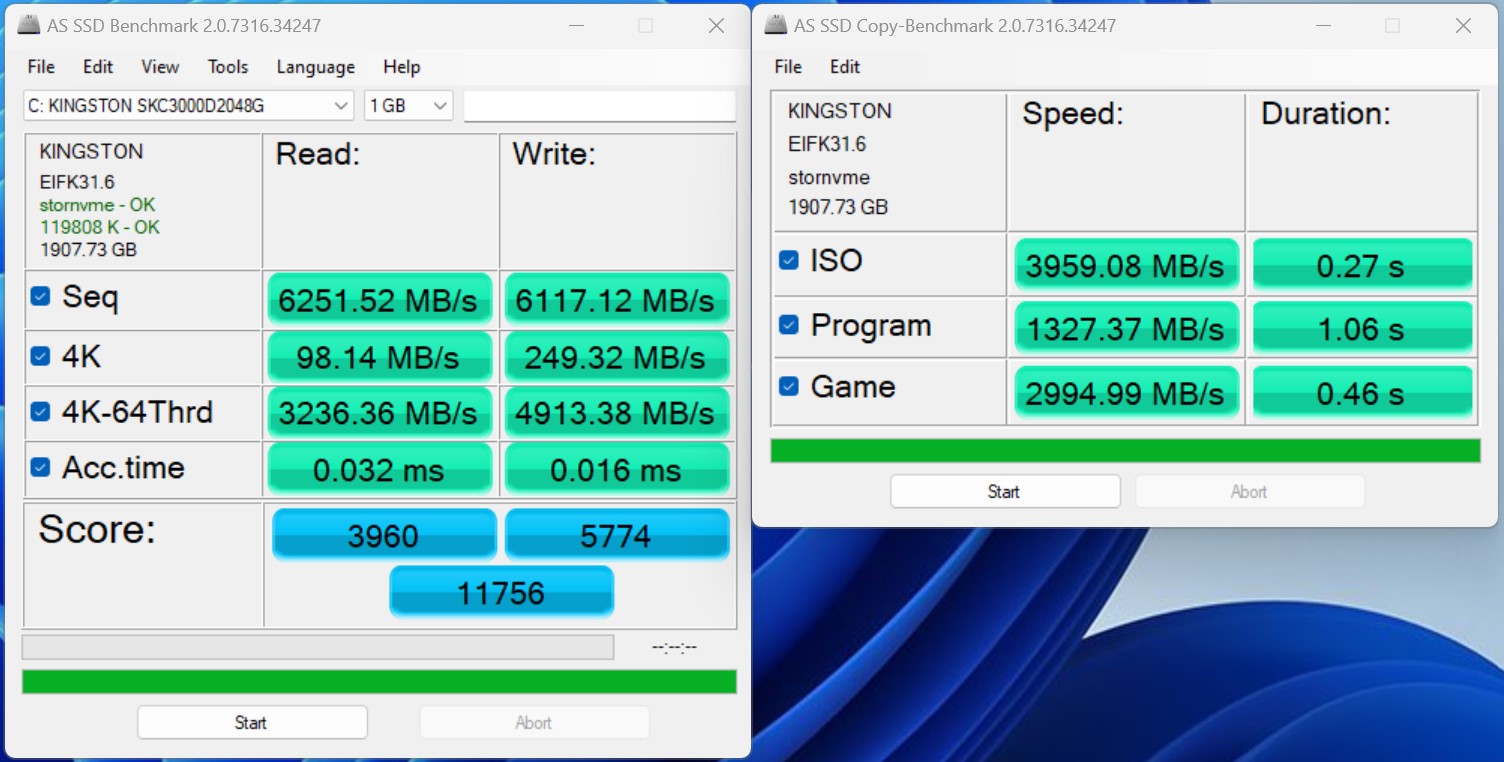
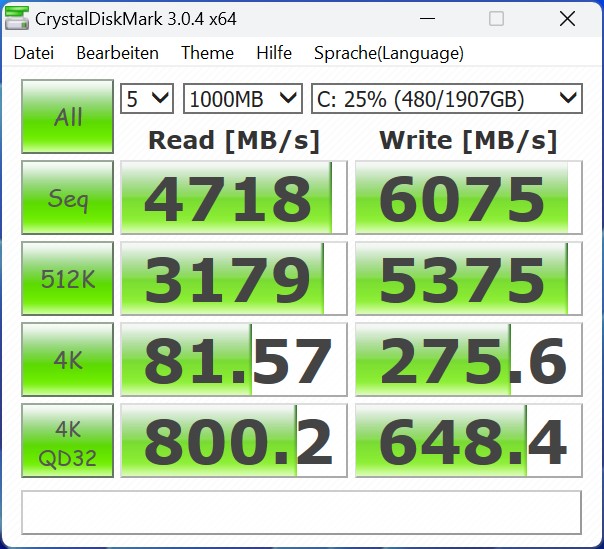
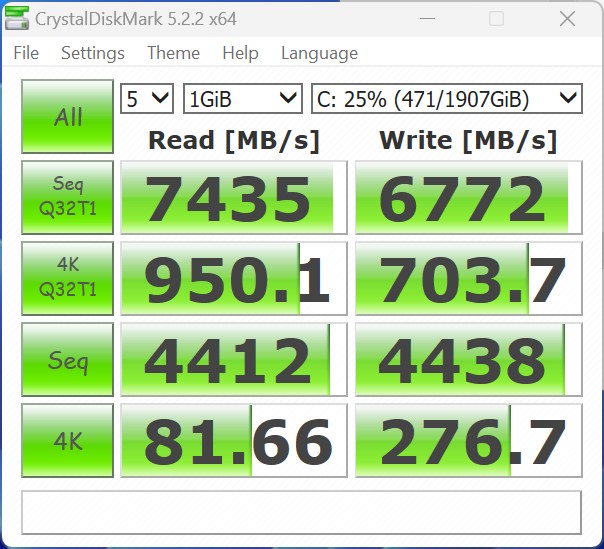
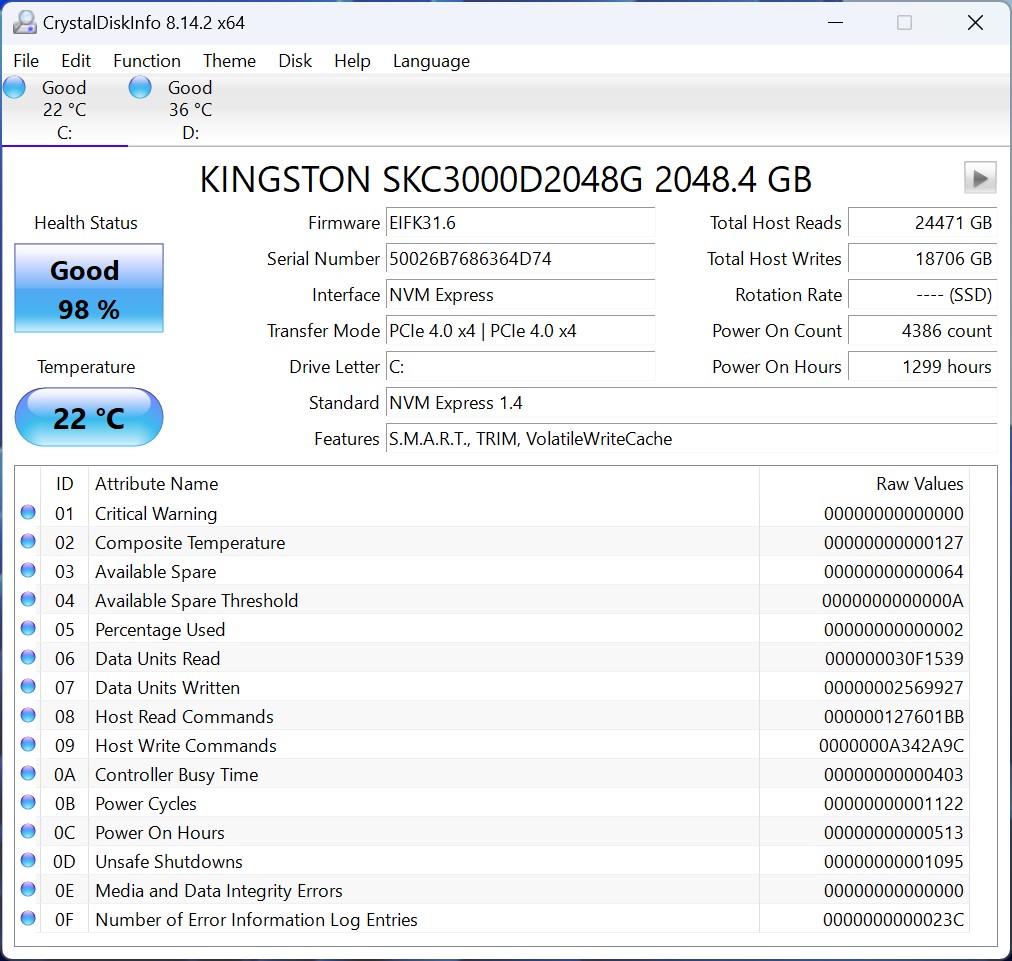
Amint azt a felülvizsgálat elején említettük, a Minisforum csak magát a BD790i alaplapot szállítja. Ahhoz, hogy egy komplett rendszert üzembe helyezhessünk, a hiányzó alkatrészekről, például a RAM-ról, az SSD-ről, a tápegységről és a CPU ventilátorról magunknak kell gondoskodnunk. SSD-nek egy Kingston KC3000-es, 2 TB-os tárhellyel rendelkező SSD-t választottunk. A modell PCIe 4.0 x4-en keresztül csatlakozik, és nem használja ki teljesen az interfész előnyeit, mivel a Minisforum BD790i technikailag két PCIe 5.0 SSD-t támogat. Mindkét M.2-es interfész az alaplap tetején található. Egy kis hűtőbordával fedett, kis ventilátorral is felszerelt SSD-nknek nem okozott gondot a stabil teljesítmény biztosítása. Megnyugtathatunk mindenkit, aki azt gondolja, hogy ez a kis ventilátor fülfájást okoz, hiszen a ventilátor kellemesen halk, és nem hallatszik a CPU ventilátor mellett.
További összehasonlításokért és teljesítményértékelésekért kérjük, olvassa el a összehasonlító táblázatunk.
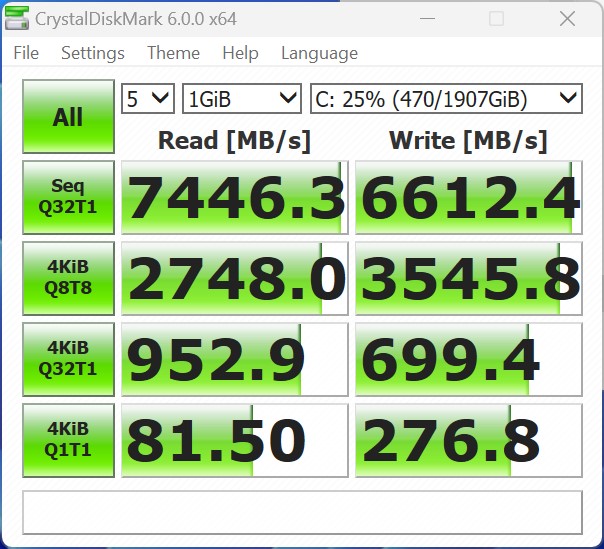

Reading continuous performance: DiskSpd Read Loop, Queue Depth 8
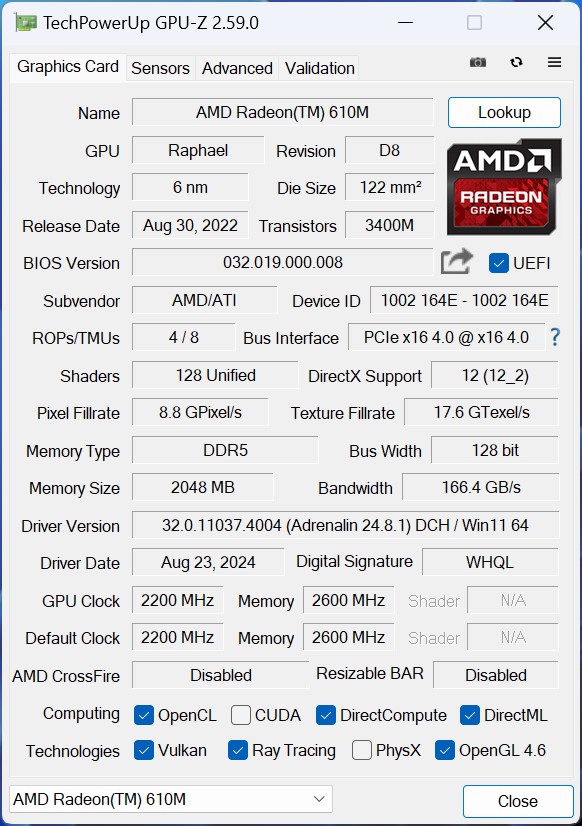
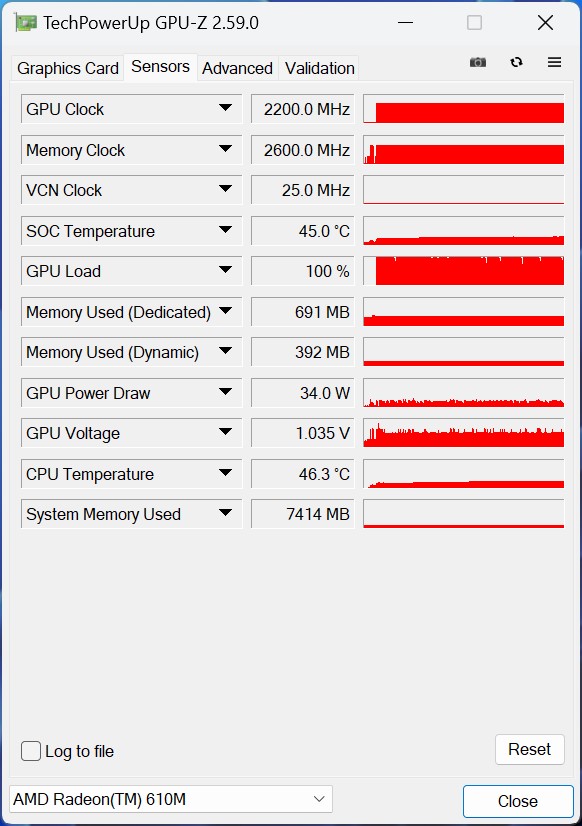
Grafikus kártya - Az AMD Radeon 610M mint iGPU
A AMD Ryzen 9 7945HX csak egy egyszerű grafikus megoldást tartalmaz iGPU-ként, amely a következő névre hallgat AMD Radeon 610M. Ez továbbra is az RDNA2 architektúrán alapul, és mindössze 2 CU-t kínál, ami azt jelenti, hogy összesen csak 128 shader egység áll rendelkezésre a 3D-s számításokhoz. Összehasonlítva a AMD Ryzen 7 7745HX, amely a Minisforum BD770i, nincs több 3D-s teljesítmény. Ennek fényében az eredményeik szinte azonosak. Összehasonlítva egy AMD Radeon 780M, az AMD Radeon 610M-nek nincs esélye. Véleményünk szerint ettől a gyenge grafikus megoldástól nem szabad többet várni az egyszerű képkimenetnél.
További összehasonlítások és benchmarkok találhatók a következő oldalunkon GPU-összehasonlító táblázatunkban.
| Performance rating - Percent | |
| AMD Radeon 780M, AMD Ryzen 7 7840HS | |
| AMD Radeon 780M, AMD Ryzen 9 7940HS | |
| AMD Radeon RX Vega 7, AMD Ryzen 5 5600U | |
| Intel UHD Graphics 64EUs (Alder Lake 12th Gen), Intel Core i7-12650H | |
| Intel UHD Graphics Xe 32EUs (Tiger Lake-H), Intel Core i7-11800H | |
| AMD Radeon 610M, AMD Ryzen 9 7945HX | |
| AMD Radeon 610M, AMD Ryzen 7 7745HX | |
| Átlagos AMD Radeon 610M | |
| 3DMark 11 - 1280x720 Performance GPU | |
| AMD Radeon 780M, AMD Ryzen 7 7840HS | |
| AMD Radeon 780M, AMD Ryzen 9 7940HS | |
| AMD Radeon RX Vega 7, AMD Ryzen 5 5600U | |
| Intel UHD Graphics 64EUs (Alder Lake 12th Gen), Intel Core i7-12650H | |
| AMD Radeon 610M, AMD Ryzen 9 7945HX | |
| AMD Radeon 610M, AMD Ryzen 7 7745HX | |
| Intel UHD Graphics Xe 32EUs (Tiger Lake-H), Intel Core i7-11800H | |
| Átlagos AMD Radeon 610M (1029 - 3399, n=7) | |
| 3DMark | |
| 2560x1440 Time Spy Graphics | |
| AMD Radeon 780M, AMD Ryzen 7 7840HS | |
| AMD Radeon 780M, AMD Ryzen 9 7940HS | |
| AMD Radeon RX Vega 7, AMD Ryzen 5 5600U | |
| Intel UHD Graphics 64EUs (Alder Lake 12th Gen), Intel Core i7-12650H | |
| AMD Radeon 610M, AMD Ryzen 9 7945HX | |
| Intel UHD Graphics Xe 32EUs (Tiger Lake-H), Intel Core i7-11800H | |
| AMD Radeon 610M, AMD Ryzen 7 7745HX | |
| Átlagos AMD Radeon 610M (224 - 669, n=5) | |
| 1920x1080 Fire Strike Graphics | |
| AMD Radeon 780M, AMD Ryzen 7 7840HS | |
| AMD Radeon 780M, AMD Ryzen 9 7940HS | |
| Intel UHD Graphics 64EUs (Alder Lake 12th Gen), Intel Core i7-12650H | |
| AMD Radeon RX Vega 7, AMD Ryzen 5 5600U | |
| Intel UHD Graphics Xe 32EUs (Tiger Lake-H), Intel Core i7-11800H | |
| AMD Radeon 610M, AMD Ryzen 7 7745HX | |
| AMD Radeon 610M, AMD Ryzen 9 7945HX | |
| Átlagos AMD Radeon 610M (781 - 2305, n=7) | |
| Fire Strike Extreme Score | |
| AMD Radeon 780M, AMD Ryzen 7 7840HS | |
| AMD Radeon 780M, AMD Ryzen 9 7940HS | |
| Intel UHD Graphics 64EUs (Alder Lake 12th Gen), Intel Core i7-12650H | |
| AMD Radeon RX Vega 7, AMD Ryzen 5 5600U | |
| Intel UHD Graphics Xe 32EUs (Tiger Lake-H), Intel Core i7-11800H | |
| AMD Radeon 610M, AMD Ryzen 9 7945HX | |
| Átlagos AMD Radeon 610M (530 - 1041, n=4) | |
| AMD Radeon 610M, AMD Ryzen 7 7745HX | |
| 1280x720 Cloud Gate Standard Graphics | |
| AMD Radeon 780M, AMD Ryzen 7 7840HS | |
| AMD Radeon 780M, AMD Ryzen 9 7940HS | |
| AMD Radeon RX Vega 7, AMD Ryzen 5 5600U | |
| Intel UHD Graphics 64EUs (Alder Lake 12th Gen), Intel Core i7-12650H | |
| Intel UHD Graphics Xe 32EUs (Tiger Lake-H), Intel Core i7-11800H | |
| AMD Radeon 610M, AMD Ryzen 7 7745HX | |
| Átlagos AMD Radeon 610M (11389 - 15902, n=7) | |
| AMD Radeon 610M, AMD Ryzen 9 7945HX | |
| Performance rating - Percent | |
| Minisforum EliteMini UM780 XTX | |
| Minisforum Venus Series UM790 Pro | |
| NiPoGi AD08 | |
| Minisforum Mars Series MC560 | |
| Minisforum BD790i | |
| Acemagic AD15 | |
| Minisforum BD770i | |
| Átlagos AMD Radeon 610M | |
| Unigine Heaven 4.0 | |
| Extreme Preset OpenGL | |
| Minisforum EliteMini UM780 XTX | |
| Minisforum Venus Series UM790 Pro | |
| NiPoGi AD08 | |
| Minisforum Mars Series MC560 | |
| Minisforum BD770i | |
| Acemagic AD15 | |
| Minisforum BD790i | |
| Átlagos AMD Radeon 610M (11.7 - 13.6, n=5) | |
| Extreme Preset DX11 | |
| Minisforum EliteMini UM780 XTX | |
| Minisforum Venus Series UM790 Pro | |
| NiPoGi AD08 | |
| Minisforum Mars Series MC560 | |
| Acemagic AD15 | |
| Minisforum BD770i | |
| Minisforum BD790i | |
| Átlagos AMD Radeon 610M (10.9 - 12.3, n=5) | |
| Unigine Valley 1.0 | |
| 1920x1080 Extreme HD DirectX AA:x8 | |
| Minisforum EliteMini UM780 XTX | |
| Minisforum Venus Series UM790 Pro | |
| Minisforum Mars Series MC560 | |
| NiPoGi AD08 | |
| Minisforum BD770i | |
| Minisforum BD790i | |
| Átlagos AMD Radeon 610M (9.8 - 10, n=4) | |
| Acemagic AD15 | |
| 1920x1080 Extreme HD Preset OpenGL AA:x8 | |
| Minisforum EliteMini UM780 XTX | |
| Minisforum Venus Series UM790 Pro | |
| NiPoGi AD08 | |
| Minisforum Mars Series MC560 | |
| Acemagic AD15 | |
| Minisforum BD770i | |
| Minisforum BD790i | |
| Átlagos AMD Radeon 610M (9.1 - 9.6, n=4) | |
| ComputeMark v2.1 | |
| 1024x600 Normal, Score | |
| Minisforum Venus Series UM790 Pro | |
| Minisforum EliteMini UM780 XTX | |
| Minisforum Mars Series MC560 | |
| NiPoGi AD08 | |
| Minisforum BD770i | |
| Minisforum BD790i | |
| Acemagic AD15 | |
| Átlagos AMD Radeon 610M (517 - 1669, n=5) | |
| 1024x600 Normal, Fluid 3DTex | |
| Minisforum EliteMini UM780 XTX | |
| Minisforum Venus Series UM790 Pro | |
| Minisforum Mars Series MC560 | |
| Minisforum BD770i | |
| Minisforum BD790i | |
| NiPoGi AD08 | |
| Átlagos AMD Radeon 610M (109 - 239, n=5) | |
| Acemagic AD15 | |
| 1024x600 Normal, Fluid 2DTexArr | |
| Minisforum EliteMini UM780 XTX | |
| Minisforum Venus Series UM790 Pro | |
| Minisforum Mars Series MC560 | |
| NiPoGi AD08 | |
| Minisforum BD770i | |
| Minisforum BD790i | |
| Átlagos AMD Radeon 610M (84 - 197, n=5) | |
| Acemagic AD15 | |
| 1024x600 Normal, Mandel Vector | |
| Minisforum Venus Series UM790 Pro | |
| Minisforum EliteMini UM780 XTX | |
| Minisforum Mars Series MC560 | |
| NiPoGi AD08 | |
| Minisforum BD770i | |
| Minisforum BD790i | |
| Átlagos AMD Radeon 610M (109 - 326, n=5) | |
| Acemagic AD15 | |
| 1024x600 Normal, Mandel Scalar | |
| Minisforum Venus Series UM790 Pro | |
| Minisforum EliteMini UM780 XTX | |
| Minisforum Mars Series MC560 | |
| NiPoGi AD08 | |
| Minisforum BD790i | |
| Minisforum BD770i | |
| Átlagos AMD Radeon 610M (87 - 502, n=5) | |
| Acemagic AD15 | |
| 1024x600 Normal, QJuliaRayTrace | |
| Minisforum Venus Series UM790 Pro | |
| Minisforum EliteMini UM780 XTX | |
| Minisforum Mars Series MC560 | |
| NiPoGi AD08 | |
| Acemagic AD15 | |
| Minisforum BD770i | |
| Minisforum BD790i | |
| Átlagos AMD Radeon 610M (128 - 427, n=5) | |
| Affinity Photo 2 - Combined (Single / Multi GPU) | |
| Minisforum BD790i | |
| NiPoGi AD08 | |
| Átlagos AMD Radeon 610M (889 - 5750, n=4) | |
| Acemagic AD15 | |
| Minisforum EliteMini UM780 XTX | |
| Minisforum Mars Series MC560 | |
| Minisforum Venus Series UM790 Pro | |
| Minisforum BD770i | |
| 3DMark 06 Standard Score | 20555 pontok | |
| 3DMark Vantage P Result | 12092 pontok | |
| 3DMark 11 Performance | 3873 pontok | |
| 3DMark Ice Storm Standard Score | 41556 pontok | |
| 3DMark Cloud Gate Standard Score | 14629 pontok | |
| 3DMark Fire Strike Score | 2156 pontok | |
| 3DMark Fire Strike Extreme Score | 530 pontok | |
| 3DMark Time Spy Score | 740 pontok | |
Segítség | ||
Játékos teljesítmény - AMD Radeon 610M
Azért, hogy jobban értékelhessük a AMD Radeon 610M3D-s teljesítményének jobb megítélése érdekében néhány játéktesztnek vetettük alá. Sajnos a kis teljesítményű iGPU nem tudott jó képkockaértékekkel büszkélkedni. Az AMD Radeon 610M még a régebbi játékok lejátszásakor is nehezen tudott megfelelő képkockasebességet megjeleníteni a képernyőn. Az AMD Radeon 780M-mel felszerelt modellek érezhetően jobb teljesítményt nyújtottak. Még így is, a korlátok egy AMD Radeon 780M határai határait is gyorsan elérte, így csak a dedikált grafikus kártya használata maradt, ha a legújabb játékokat is élvezni szeretné.
Az iGPU teljesítményének más grafikus kártyákkal való összehasonlításáért tekintse meg a következő oldalunkat GPU-játékok listája.
| The Witcher 3 | |
| 1024x768 Low Graphics & Postprocessing | |
| Minisforum EliteMini UM780 XTX | |
| Minisforum Venus Series UM790 Pro | |
| NiPoGi AD08 | |
| Minisforum Mars Series MC560 | |
| Acemagic AD15 | |
| Minisforum BD790i | |
| Minisforum BD770i | |
| 1920x1080 High Graphics & Postprocessing (Nvidia HairWorks Off) | |
| Minisforum EliteMini UM780 XTX | |
| Minisforum Venus Series UM790 Pro | |
| NiPoGi AD08 | |
| Minisforum Mars Series MC560 | |
| Acemagic AD15 | |
| Minisforum BD790i | |
| Minisforum BD770i | |
| Borderlands 3 | |
| 1280x720 Very Low Overall Quality (DX11) | |
| Minisforum EliteMini UM780 XTX | |
| Minisforum Venus Series UM790 Pro | |
| Minisforum Mars Series MC560 | |
| NiPoGi AD08 | |
| Minisforum BD770i | |
| Minisforum BD790i | |
| Acemagic AD15 | |
| 1920x1080 High Overall Quality (DX11) | |
| Minisforum EliteMini UM780 XTX | |
| Minisforum Venus Series UM790 Pro | |
| Minisforum Mars Series MC560 | |
| NiPoGi AD08 | |
| Minisforum BD770i | |
| Minisforum BD790i | |
| Acemagic AD15 | |
| GTA V | |
| 1024x768 Lowest Settings possible | |
| Minisforum EliteMini UM780 XTX | |
| Minisforum Venus Series UM790 Pro | |
| Minisforum BD770i | |
| Minisforum BD790i | |
| Minisforum Mars Series MC560 | |
| NiPoGi AD08 | |
| Acemagic AD15 | |
| 1920x1080 High/On (Advanced Graphics Off) AA:2xMSAA + FX AF:8x | |
| Minisforum EliteMini UM780 XTX | |
| Minisforum Venus Series UM790 Pro | |
| Minisforum Mars Series MC560 | |
| Minisforum BD770i | |
| Minisforum BD790i | |
| NiPoGi AD08 | |
| Acemagic AD15 | |
| Far Cry 5 | |
| 1280x720 Low Preset AA:T | |
| Minisforum EliteMini UM780 XTX | |
| Minisforum Venus Series UM790 Pro | |
| Minisforum Mars Series MC560 | |
| NiPoGi AD08 | |
| Minisforum BD770i | |
| Acemagic AD15 | |
| Minisforum BD790i | |
| 1920x1080 High Preset AA:T | |
| Minisforum EliteMini UM780 XTX | |
| Minisforum Venus Series UM790 Pro | |
| NiPoGi AD08 | |
| Minisforum Mars Series MC560 | |
| Minisforum BD770i | |
| Acemagic AD15 | |
| Minisforum BD790i | |
| Far Cry New Dawn | |
| 1280x720 Low Preset | |
| Minisforum EliteMini UM780 XTX | |
| Minisforum Venus Series UM790 Pro | |
| NiPoGi AD08 | |
| Minisforum Mars Series MC560 | |
| Minisforum BD770i | |
| Minisforum BD790i | |
| Acemagic AD15 | |
| 1920x1080 High Preset | |
| Minisforum EliteMini UM780 XTX | |
| Minisforum Venus Series UM790 Pro | |
| NiPoGi AD08 | |
| Minisforum Mars Series MC560 | |
| Minisforum BD770i | |
| Minisforum BD790i | |
| Acemagic AD15 | |
| Tiny Tina's Wonderlands | |
| 1280x720 Lowest Preset (DX12) | |
| Minisforum EliteMini UM780 XTX | |
| Minisforum Venus Series UM790 Pro | |
| Minisforum Mars Series MC560 | |
| Minisforum BD770i | |
| Minisforum BD790i | |
| Acemagic AD15 | |
| 1920x1080 High Preset (DX12) | |
| Minisforum EliteMini UM780 XTX | |
| Minisforum Venus Series UM790 Pro | |
| Minisforum Mars Series MC560 | |
| Minisforum BD770i | |
| Minisforum BD790i | |
| Acemagic AD15 | |
| Metro Exodus | |
| 1280x720 Low Quality AF:4x | |
| Minisforum EliteMini UM780 XTX | |
| Minisforum Venus Series UM790 Pro | |
| NiPoGi AD08 | |
| Minisforum BD770i | |
| Minisforum BD790i | |
| 1920x1080 High Quality AF:16x | |
| Minisforum EliteMini UM780 XTX | |
| Minisforum Venus Series UM790 Pro | |
| NiPoGi AD08 | |
| Minisforum BD770i | |
| Minisforum BD790i | |
| Shadow of the Tomb Raider | |
| 1280x720 Lowest Preset | |
| Minisforum EliteMini UM780 XTX | |
| Minisforum Venus Series UM790 Pro | |
| NiPoGi AD08 | |
| Minisforum BD770i | |
| Minisforum BD790i | |
| Acemagic AD15 | |
| 1920x1080 High Preset AA:SM | |
| Minisforum EliteMini UM780 XTX | |
| Minisforum Venus Series UM790 Pro | |
| NiPoGi AD08 | |
| Minisforum BD770i | |
| Acemagic AD15 | |
| Minisforum BD790i | |
| Strange Brigade | |
| 1280x720 lowest AF:1 | |
| Minisforum EliteMini UM780 XTX | |
| Minisforum Venus Series UM790 Pro | |
| Minisforum Mars Series MC560 | |
| NiPoGi AD08 | |
| Minisforum BD770i | |
| Acemagic AD15 | |
| Minisforum BD790i | |
| 1920x1080 high AA:high AF:8 | |
| Minisforum EliteMini UM780 XTX | |
| Minisforum Venus Series UM790 Pro | |
| Minisforum Mars Series MC560 | |
| NiPoGi AD08 | |
| Minisforum BD770i | |
| Acemagic AD15 | |
| Minisforum BD790i | |
| alacsony | közepes | magas | ultra | |
|---|---|---|---|---|
| GTA V (2015) | 131.2 | 99.5 | 21.6 | 9.61 |
| The Witcher 3 (2015) | 44.5 | 27 | 13.9 | 7.8 |
| Final Fantasy XV Benchmark (2018) | 25.9 | 11.4 | 7.97 | |
| X-Plane 11.11 (2018) | 39.8 | 23.5 | 20.8 | |
| Far Cry 5 (2018) | 25 | 13 | 12 | 11 |
| Strange Brigade (2018) | 20.9 | 18.8 | 14.3 | 12 |
| Shadow of the Tomb Raider (2018) | 35.7 | 12.5 | 11.5 | 9.4 |
| Far Cry New Dawn (2019) | 32 | 15 | 14 | 12 |
| Metro Exodus (2019) | 25.1 | 10.6 | 7.73 | 6.41 |
| Borderlands 3 (2019) | 38.1 | 14.3 | 8.43 | 6.4 |
| Tiny Tina's Wonderlands (2022) | 16.3 | 12.8 | 8.41 |
A Minisforum BD790i egy Nvidia GeForce RTX 4090 processzorral
A Minisforum BD790i alaplap ideális egy kompakt játékrendszer alapjául. Az AMD Ryzen 9 7945HX bőséges teljesítményt nyújt, és még a CPU-t igénylő játékok sem terhelik túl a 16 magos komponenst semmilyen módon. A szintetikus benchmarkokat vizsgálva csak kisebb különbségek mutatkoznak a különböző rendszerek között. A Minisforum BD790i alaplap teljes PCIe x16-os interfésszel rendelkezik, amely már támogatja az 5.0-s szabványt. Ez azt jelenti, hogy a következő hónapokban várhatóan megjelenő grafikus kártyák is teljes sávszélességükkel üzemeltethetők, ami tovább támasztja alá ennek az alkatrésznek a jövőbemutató tulajdonságait. Használtuk a Palit GeForce RTX 4090 Gamerock OC RTX 4090 Gamerock OC játéktesztjeinkhez. A grafikus kártya mérete miatt a tesztekhez a Minisforum BD790i-t kellett használnunk egy nyitott felállásban. A grafikus kártya egyszerűen túl nagy a Phanteks Enthoo Evolv Shift XT tokhoz.
A játék benchmarkok elemzéséhez először nézzük meg a teljesítményt a CPU határán. Itt voltak a legnagyobb különbségek a különböző processzorok között. Tesztrendszerünk nagyjából azt a teljesítményszintet nyújtotta, ami egy AMD Ryzen 5 9600X-től elvárható. Egy Intel Core i9-14900K elérhető távolságon belül volt, és csak kicsivel nyújtott nagyobb teljesítményt. Amikor növeltük a felbontást és a részletességet, a processzor teljesítménye egyre inkább háttérbe szorult. A GPU-határértéknél az összes összehasonlító eszköz sokkal közelebb volt egymáshoz, vagyis valódi különbség alig volt észrevehető. Az AMD Ryzen 9 7945HX és a Palit GeForce RTX 4090 Gamerock OC Gamerock OC kombinációja következetesen biztosította a lenyűgöző játékteljesítményt, amely semmivel sem marad el a hagyományos asztali számítógépekétől.
Az összehasonlításban felsorolt rendszerek mindegyikét ugyanazzal a grafikus kártyával teszteltük, egy Palit GeForce RTX 4090 Gamerock OC.
| Performance rating - Percent | |
| AMD Ryzen 5 9600X, NVIDIA GeForce RTX 4090 | |
| Intel Core i9-14900K, NVIDIA GeForce RTX 4090 | |
| Intel Core i5-14600K, NVIDIA GeForce RTX 4090 | |
| AMD Ryzen 7 7745HX, NVIDIA GeForce RTX 4090 | |
| AMD Ryzen 9 7950X, NVIDIA GeForce RTX 4090 | |
| AMD Ryzen 7 7800X3D, NVIDIA GeForce RTX 4090 | |
| Intel Core i7-13700, NVIDIA GeForce RTX 4090 | |
| AMD Ryzen 9 7945HX, NVIDIA GeForce RTX 4090 | |
| Intel Core i7-12700, NVIDIA GeForce RTX 4090 | |
| Intel Core i5-13400, NVIDIA GeForce RTX 4090 | |
| 3DMark 11 - 1280x720 Performance GPU | |
| AMD Ryzen 7 7745HX, NVIDIA GeForce RTX 4090 | |
| AMD Ryzen 7 7800X3D, NVIDIA GeForce RTX 4090 | |
| Intel Core i5-14600K, NVIDIA GeForce RTX 4090 | |
| AMD Ryzen 9 7950X, NVIDIA GeForce RTX 4090 | |
| Intel Core i7-13700, NVIDIA GeForce RTX 4090 | |
| Intel Core i7-12700, NVIDIA GeForce RTX 4090 | |
| Intel Core i5-13400, NVIDIA GeForce RTX 4090 | |
| AMD Ryzen 5 9600X, NVIDIA GeForce RTX 4090 | |
| Intel Core i9-14900K, NVIDIA GeForce RTX 4090 | |
| AMD Ryzen 9 7945HX, NVIDIA GeForce RTX 4090 | |
| 3DMark | |
| 2560x1440 Time Spy Graphics | |
| AMD Ryzen 7 7745HX, NVIDIA GeForce RTX 4090 | |
| Intel Core i5-14600K, NVIDIA GeForce RTX 4090 | |
| Intel Core i9-14900K, NVIDIA GeForce RTX 4090 | |
| AMD Ryzen 7 7800X3D, NVIDIA GeForce RTX 4090 | |
| AMD Ryzen 5 9600X, NVIDIA GeForce RTX 4090 | |
| Intel Core i7-13700, NVIDIA GeForce RTX 4090 | |
| AMD Ryzen 9 7950X, NVIDIA GeForce RTX 4090 | |
| Intel Core i7-12700, NVIDIA GeForce RTX 4090 | |
| Intel Core i5-13400, NVIDIA GeForce RTX 4090 | |
| AMD Ryzen 9 7945HX, NVIDIA GeForce RTX 4090 | |
| 1920x1080 Fire Strike Graphics | |
| AMD Ryzen 7 7745HX, NVIDIA GeForce RTX 4090 | |
| Intel Core i5-14600K, NVIDIA GeForce RTX 4090 | |
| Intel Core i7-12700, NVIDIA GeForce RTX 4090 | |
| Intel Core i7-13700, NVIDIA GeForce RTX 4090 | |
| AMD Ryzen 5 9600X, NVIDIA GeForce RTX 4090 | |
| Intel Core i5-13400, NVIDIA GeForce RTX 4090 | |
| AMD Ryzen 7 7800X3D, NVIDIA GeForce RTX 4090 | |
| AMD Ryzen 9 7950X, NVIDIA GeForce RTX 4090 | |
| AMD Ryzen 9 7945HX, NVIDIA GeForce RTX 4090 | |
| Intel Core i9-14900K, NVIDIA GeForce RTX 4090 | |
| 3840x2160 Fire Strike Ultra Graphics | |
| AMD Ryzen 7 7800X3D, NVIDIA GeForce RTX 4090 | |
| AMD Ryzen 7 7745HX, NVIDIA GeForce RTX 4090 | |
| Intel Core i5-14600K, NVIDIA GeForce RTX 4090 | |
| Intel Core i7-13700, NVIDIA GeForce RTX 4090 | |
| Intel Core i5-13400, NVIDIA GeForce RTX 4090 | |
| AMD Ryzen 9 7950X, NVIDIA GeForce RTX 4090 | |
| Intel Core i9-14900K, NVIDIA GeForce RTX 4090 | |
| AMD Ryzen 5 9600X, NVIDIA GeForce RTX 4090 | |
| AMD Ryzen 9 7945HX, NVIDIA GeForce RTX 4090 | |
| Intel Core i7-12700, NVIDIA GeForce RTX 4090 | |
| Unigine Superposition | |
| 1280x720 720p Low | |
| AMD Ryzen 5 9600X, NVIDIA GeForce RTX 4090 | |
| Intel Core i9-14900K, NVIDIA GeForce RTX 4090 | |
| AMD Ryzen 7 7800X3D, NVIDIA GeForce RTX 4090 | |
| AMD Ryzen 9 7950X, NVIDIA GeForce RTX 4090 | |
| AMD Ryzen 7 7745HX, NVIDIA GeForce RTX 4090 | |
| Intel Core i7-13700, NVIDIA GeForce RTX 4090 | |
| Intel Core i5-14600K, NVIDIA GeForce RTX 4090 | |
| AMD Ryzen 9 7945HX, NVIDIA GeForce RTX 4090 | |
| Intel Core i7-12700, NVIDIA GeForce RTX 4090 | |
| Intel Core i5-13400, NVIDIA GeForce RTX 4090 | |
| 1920x1080 1080p High | |
| Intel Core i9-14900K, NVIDIA GeForce RTX 4090 | |
| AMD Ryzen 5 9600X, NVIDIA GeForce RTX 4090 | |
| AMD Ryzen 7 7800X3D, NVIDIA GeForce RTX 4090 | |
| AMD Ryzen 9 7950X, NVIDIA GeForce RTX 4090 | |
| AMD Ryzen 7 7745HX, NVIDIA GeForce RTX 4090 | |
| Intel Core i7-13700, NVIDIA GeForce RTX 4090 | |
| Intel Core i5-14600K, NVIDIA GeForce RTX 4090 | |
| AMD Ryzen 9 7945HX, NVIDIA GeForce RTX 4090 | |
| Intel Core i7-12700, NVIDIA GeForce RTX 4090 | |
| Intel Core i5-13400, NVIDIA GeForce RTX 4090 | |
| 1920x1080 1080p Extreme | |
| AMD Ryzen 7 7800X3D, NVIDIA GeForce RTX 4090 | |
| AMD Ryzen 7 7745HX, NVIDIA GeForce RTX 4090 | |
| Intel Core i5-14600K, NVIDIA GeForce RTX 4090 | |
| Intel Core i9-14900K, NVIDIA GeForce RTX 4090 | |
| AMD Ryzen 9 7950X, NVIDIA GeForce RTX 4090 | |
| Intel Core i7-13700, NVIDIA GeForce RTX 4090 | |
| Intel Core i5-13400, NVIDIA GeForce RTX 4090 | |
| Intel Core i7-12700, NVIDIA GeForce RTX 4090 | |
| AMD Ryzen 9 7945HX, NVIDIA GeForce RTX 4090 | |
| AMD Ryzen 5 9600X, NVIDIA GeForce RTX 4090 | |
| 3840x2160 4k Optimized | |
| AMD Ryzen 9 7950X, NVIDIA GeForce RTX 4090 | |
| Intel Core i7-13700, NVIDIA GeForce RTX 4090 | |
| Intel Core i9-14900K, NVIDIA GeForce RTX 4090 | |
| Intel Core i5-14600K, NVIDIA GeForce RTX 4090 | |
| AMD Ryzen 7 7800X3D, NVIDIA GeForce RTX 4090 | |
| AMD Ryzen 7 7745HX, NVIDIA GeForce RTX 4090 | |
| AMD Ryzen 5 9600X, NVIDIA GeForce RTX 4090 | |
| AMD Ryzen 9 7945HX, NVIDIA GeForce RTX 4090 | |
| Intel Core i7-12700, NVIDIA GeForce RTX 4090 | |
| Intel Core i5-13400, NVIDIA GeForce RTX 4090 | |
| 7680x4320 8k Optimized | |
| AMD Ryzen 9 7950X, NVIDIA GeForce RTX 4090 | |
| Intel Core i7-13700, NVIDIA GeForce RTX 4090 | |
| Intel Core i7-12700, NVIDIA GeForce RTX 4090 | |
| Intel Core i5-13400, NVIDIA GeForce RTX 4090 | |
| Intel Core i9-14900K, NVIDIA GeForce RTX 4090 | |
| Intel Core i5-14600K, NVIDIA GeForce RTX 4090 | |
| AMD Ryzen 7 7800X3D, NVIDIA GeForce RTX 4090 | |
| AMD Ryzen 7 7745HX, NVIDIA GeForce RTX 4090 | |
| AMD Ryzen 9 7945HX, NVIDIA GeForce RTX 4090 | |
| AMD Ryzen 5 9600X, NVIDIA GeForce RTX 4090 | |
| Unigine Valley 1.0 | |
| 1920x1080 Extreme HD DirectX AA:x8 | |
| AMD Ryzen 5 9600X, NVIDIA GeForce RTX 4090 | |
| Intel Core i9-14900K, NVIDIA GeForce RTX 4090 | |
| Intel Core i5-14600K, NVIDIA GeForce RTX 4090 | |
| AMD Ryzen 9 7950X, NVIDIA GeForce RTX 4090 | |
| Intel Core i7-13700, NVIDIA GeForce RTX 4090 | |
| AMD Ryzen 9 7945HX, NVIDIA GeForce RTX 4090 | |
| AMD Ryzen 7 7745HX, NVIDIA GeForce RTX 4090 | |
| AMD Ryzen 7 7800X3D, NVIDIA GeForce RTX 4090 | |
| Intel Core i7-12700, NVIDIA GeForce RTX 4090 | |
| Intel Core i5-13400, NVIDIA GeForce RTX 4090 | |
| 1920x1080 Extreme HD Preset OpenGL AA:x8 | |
| AMD Ryzen 5 9600X, NVIDIA GeForce RTX 4090 | |
| Intel Core i9-14900K, NVIDIA GeForce RTX 4090 | |
| Intel Core i5-14600K, NVIDIA GeForce RTX 4090 | |
| Intel Core i7-13700, NVIDIA GeForce RTX 4090 | |
| AMD Ryzen 9 7950X, NVIDIA GeForce RTX 4090 | |
| AMD Ryzen 7 7745HX, NVIDIA GeForce RTX 4090 | |
| AMD Ryzen 7 7800X3D, NVIDIA GeForce RTX 4090 | |
| AMD Ryzen 9 7945HX, NVIDIA GeForce RTX 4090 | |
| Intel Core i7-12700, NVIDIA GeForce RTX 4090 | |
| Intel Core i5-13400, NVIDIA GeForce RTX 4090 | |
| Unigine Heaven 4.0 | |
| Extreme Preset OpenGL | |
| AMD Ryzen 5 9600X, NVIDIA GeForce RTX 4090 | |
| Intel Core i9-14900K, NVIDIA GeForce RTX 4090 | |
| AMD Ryzen 7 7745HX, NVIDIA GeForce RTX 4090 | |
| AMD Ryzen 9 7945HX, NVIDIA GeForce RTX 4090 | |
| Intel Core i5-14600K, NVIDIA GeForce RTX 4090 | |
| AMD Ryzen 9 7950X, NVIDIA GeForce RTX 4090 | |
| Intel Core i7-13700, NVIDIA GeForce RTX 4090 | |
| AMD Ryzen 7 7800X3D, NVIDIA GeForce RTX 4090 | |
| Intel Core i7-12700, NVIDIA GeForce RTX 4090 | |
| Intel Core i5-13400, NVIDIA GeForce RTX 4090 | |
| Extreme Preset DX11 | |
| AMD Ryzen 9 7950X, NVIDIA GeForce RTX 4090 | |
| Intel Core i9-14900K, NVIDIA GeForce RTX 4090 | |
| AMD Ryzen 9 7945HX, NVIDIA GeForce RTX 4090 | |
| AMD Ryzen 5 9600X, NVIDIA GeForce RTX 4090 | |
| AMD Ryzen 7 7745HX, NVIDIA GeForce RTX 4090 | |
| Intel Core i5-14600K, NVIDIA GeForce RTX 4090 | |
| AMD Ryzen 7 7800X3D, NVIDIA GeForce RTX 4090 | |
| Intel Core i7-13700, NVIDIA GeForce RTX 4090 | |
| Intel Core i7-12700, NVIDIA GeForce RTX 4090 | |
| Intel Core i5-13400, NVIDIA GeForce RTX 4090 | |
| ComputeMark v2.1 | |
| 1024x600 Normal, Score | |
| AMD Ryzen 7 7745HX, NVIDIA GeForce RTX 4090 | |
| Intel Core i5-14600K, NVIDIA GeForce RTX 4090 | |
| AMD Ryzen 9 7945HX, NVIDIA GeForce RTX 4090 | |
| AMD Ryzen 5 9600X, NVIDIA GeForce RTX 4090 | |
| AMD Ryzen 9 7950X, NVIDIA GeForce RTX 4090 | |
| Intel Core i9-14900K, NVIDIA GeForce RTX 4090 | |
| Intel Core i7-12700, NVIDIA GeForce RTX 4090 | |
| AMD Ryzen 7 7800X3D, NVIDIA GeForce RTX 4090 | |
| Intel Core i5-13400, NVIDIA GeForce RTX 4090 | |
| Intel Core i7-13700, NVIDIA GeForce RTX 4090 | |
| 1024x600 Normal, Fluid 3DTex | |
| AMD Ryzen 7 7800X3D, NVIDIA GeForce RTX 4090 | |
| Intel Core i5-14600K, NVIDIA GeForce RTX 4090 | |
| Intel Core i7-13700, NVIDIA GeForce RTX 4090 | |
| AMD Ryzen 9 7945HX, NVIDIA GeForce RTX 4090 | |
| Intel Core i5-13400, NVIDIA GeForce RTX 4090 | |
| AMD Ryzen 5 9600X, NVIDIA GeForce RTX 4090 | |
| Intel Core i7-12700, NVIDIA GeForce RTX 4090 | |
| AMD Ryzen 9 7950X, NVIDIA GeForce RTX 4090 | |
| AMD Ryzen 7 7745HX, NVIDIA GeForce RTX 4090 | |
| Intel Core i9-14900K, NVIDIA GeForce RTX 4090 | |
| 1024x600 Normal, Fluid 2DTexArr | |
| AMD Ryzen 9 7945HX, NVIDIA GeForce RTX 4090 | |
| AMD Ryzen 5 9600X, NVIDIA GeForce RTX 4090 | |
| AMD Ryzen 7 7745HX, NVIDIA GeForce RTX 4090 | |
| Intel Core i5-14600K, NVIDIA GeForce RTX 4090 | |
| Intel Core i9-14900K, NVIDIA GeForce RTX 4090 | |
| AMD Ryzen 9 7950X, NVIDIA GeForce RTX 4090 | |
| Intel Core i7-12700, NVIDIA GeForce RTX 4090 | |
| Intel Core i7-13700, NVIDIA GeForce RTX 4090 | |
| AMD Ryzen 7 7800X3D, NVIDIA GeForce RTX 4090 | |
| Intel Core i5-13400, NVIDIA GeForce RTX 4090 | |
| 1024x600 Normal, Mandel Vector | |
| AMD Ryzen 7 7745HX, NVIDIA GeForce RTX 4090 | |
| AMD Ryzen 9 7945HX, NVIDIA GeForce RTX 4090 | |
| Intel Core i5-14600K, NVIDIA GeForce RTX 4090 | |
| AMD Ryzen 9 7950X, NVIDIA GeForce RTX 4090 | |
| AMD Ryzen 5 9600X, NVIDIA GeForce RTX 4090 | |
| Intel Core i9-14900K, NVIDIA GeForce RTX 4090 | |
| Intel Core i7-13700, NVIDIA GeForce RTX 4090 | |
| Intel Core i7-12700, NVIDIA GeForce RTX 4090 | |
| AMD Ryzen 7 7800X3D, NVIDIA GeForce RTX 4090 | |
| Intel Core i5-13400, NVIDIA GeForce RTX 4090 | |
| 1024x600 Normal, Mandel Scalar | |
| AMD Ryzen 7 7745HX, NVIDIA GeForce RTX 4090 | |
| Intel Core i5-14600K, NVIDIA GeForce RTX 4090 | |
| Intel Core i9-14900K, NVIDIA GeForce RTX 4090 | |
| AMD Ryzen 9 7945HX, NVIDIA GeForce RTX 4090 | |
| AMD Ryzen 7 7800X3D, NVIDIA GeForce RTX 4090 | |
| AMD Ryzen 9 7950X, NVIDIA GeForce RTX 4090 | |
| AMD Ryzen 5 9600X, NVIDIA GeForce RTX 4090 | |
| Intel Core i7-12700, NVIDIA GeForce RTX 4090 | |
| Intel Core i7-13700, NVIDIA GeForce RTX 4090 | |
| Intel Core i5-13400, NVIDIA GeForce RTX 4090 | |
| 1024x600 Normal, QJuliaRayTrace | |
| AMD Ryzen 7 7745HX, NVIDIA GeForce RTX 4090 | |
| AMD Ryzen 5 9600X, NVIDIA GeForce RTX 4090 | |
| Intel Core i5-14600K, NVIDIA GeForce RTX 4090 | |
| AMD Ryzen 9 7950X, NVIDIA GeForce RTX 4090 | |
| AMD Ryzen 9 7945HX, NVIDIA GeForce RTX 4090 | |
| Intel Core i9-14900K, NVIDIA GeForce RTX 4090 | |
| Intel Core i5-13400, NVIDIA GeForce RTX 4090 | |
| Intel Core i7-12700, NVIDIA GeForce RTX 4090 | |
| Intel Core i7-13700, NVIDIA GeForce RTX 4090 | |
| AMD Ryzen 7 7800X3D, NVIDIA GeForce RTX 4090 | |
Performance comparison at CPU limit at 720p
| Performance rating - Percent | |
| AMD Ryzen 7 7800X3D, NVIDIA GeForce RTX 4090 | |
| Intel Core i9-14900K, NVIDIA GeForce RTX 4090 | |
| AMD Ryzen 5 9600X, NVIDIA GeForce RTX 4090 | |
| AMD Ryzen 9 7950X, NVIDIA GeForce RTX 4090 | |
| Intel Core i5-14600K, NVIDIA GeForce RTX 4090 | |
| Intel Core i7-13700, NVIDIA GeForce RTX 4090 | |
| AMD Ryzen 7 7745HX, NVIDIA GeForce RTX 4090 | |
| AMD Ryzen 9 7945HX, NVIDIA GeForce RTX 4090 | |
| Intel Core i7-12700, NVIDIA GeForce RTX 4090 | |
| Intel Core i5-13400, NVIDIA GeForce RTX 4090 | |
| F1 22 - 1280x720 Ultra Low Preset AA:T AF:16x | |
| AMD Ryzen 7 7800X3D, NVIDIA GeForce RTX 4090 | |
| Intel Core i9-14900K, NVIDIA GeForce RTX 4090 | |
| AMD Ryzen 9 7950X, NVIDIA GeForce RTX 4090 | |
| AMD Ryzen 5 9600X, NVIDIA GeForce RTX 4090 | |
| Intel Core i5-14600K, NVIDIA GeForce RTX 4090 | |
| AMD Ryzen 7 7745HX, NVIDIA GeForce RTX 4090 | |
| Intel Core i7-13700, NVIDIA GeForce RTX 4090 | |
| AMD Ryzen 9 7945HX, NVIDIA GeForce RTX 4090 | |
| Intel Core i7-12700, NVIDIA GeForce RTX 4090 | |
| Intel Core i5-13400, NVIDIA GeForce RTX 4090 | |
| Far Cry 5 - 1280x720 Low Preset AA:T | |
| AMD Ryzen 7 7800X3D, NVIDIA GeForce RTX 4090 | |
| AMD Ryzen 5 9600X, NVIDIA GeForce RTX 4090 | |
| Intel Core i9-14900K, NVIDIA GeForce RTX 4090 | |
| Intel Core i5-14600K, NVIDIA GeForce RTX 4090 | |
| AMD Ryzen 9 7950X, NVIDIA GeForce RTX 4090 | |
| Intel Core i7-13700, NVIDIA GeForce RTX 4090 | |
| AMD Ryzen 7 7745HX, NVIDIA GeForce RTX 4090 | |
| Intel Core i7-12700, NVIDIA GeForce RTX 4090 | |
| AMD Ryzen 9 7945HX, NVIDIA GeForce RTX 4090 | |
| Intel Core i5-13400, NVIDIA GeForce RTX 4090 | |
| X-Plane 11.11 - 1280x720 low (fps_test=1) | |
| Intel Core i9-14900K, NVIDIA GeForce RTX 4090 | |
| AMD Ryzen 5 9600X, NVIDIA GeForce RTX 4090 | |
| Intel Core i5-14600K, NVIDIA GeForce RTX 4090 | |
| AMD Ryzen 9 7950X, NVIDIA GeForce RTX 4090 | |
| AMD Ryzen 7 7800X3D, NVIDIA GeForce RTX 4090 | |
| Intel Core i7-13700, NVIDIA GeForce RTX 4090 | |
| AMD Ryzen 9 7945HX, NVIDIA GeForce RTX 4090 | |
| AMD Ryzen 7 7745HX, NVIDIA GeForce RTX 4090 | |
| Intel Core i7-12700, NVIDIA GeForce RTX 4090 | |
| Intel Core i5-13400, NVIDIA GeForce RTX 4090 | |
| Final Fantasy XV Benchmark - 1280x720 Lite Quality | |
| AMD Ryzen 7 7745HX, NVIDIA GeForce RTX 4090 | |
| AMD Ryzen 5 9600X, NVIDIA GeForce RTX 4090 | |
| AMD Ryzen 9 7950X, NVIDIA GeForce RTX 4090 | |
| Intel Core i7-13700, NVIDIA GeForce RTX 4090 | |
| AMD Ryzen 7 7800X3D, NVIDIA GeForce RTX 4090 | |
| Intel Core i5-14600K, NVIDIA GeForce RTX 4090 | |
| Intel Core i9-14900K, NVIDIA GeForce RTX 4090 | |
| AMD Ryzen 9 7945HX, NVIDIA GeForce RTX 4090 | |
| Intel Core i7-12700, NVIDIA GeForce RTX 4090 | |
| Intel Core i5-13400, NVIDIA GeForce RTX 4090 | |
| Dota 2 Reborn - 1280x720 min (0/3) fastest | |
| AMD Ryzen 7 7800X3D, NVIDIA GeForce RTX 4090 | |
| AMD Ryzen 9 7950X, NVIDIA GeForce RTX 4090 | |
| Intel Core i9-14900K, NVIDIA GeForce RTX 4090 | |
| AMD Ryzen 5 9600X, NVIDIA GeForce RTX 4090 | |
| AMD Ryzen 9 7945HX, NVIDIA GeForce RTX 4090 | |
| Intel Core i5-14600K, NVIDIA GeForce RTX 4090 | |
| AMD Ryzen 7 7745HX, NVIDIA GeForce RTX 4090 | |
| Intel Core i7-13700, NVIDIA GeForce RTX 4090 | |
| Intel Core i7-12700, NVIDIA GeForce RTX 4090 | |
| Intel Core i5-13400, NVIDIA GeForce RTX 4090 | |
| The Witcher 3 - 1024x768 Low Graphics & Postprocessing | |
| AMD Ryzen 7 7800X3D, NVIDIA GeForce RTX 4090 | |
| AMD Ryzen 9 7950X, NVIDIA GeForce RTX 4090 | |
| Intel Core i9-14900K, NVIDIA GeForce RTX 4090 | |
| AMD Ryzen 5 9600X, NVIDIA GeForce RTX 4090 | |
| AMD Ryzen 9 7945HX, NVIDIA GeForce RTX 4090 | |
| AMD Ryzen 7 7745HX, NVIDIA GeForce RTX 4090 | |
| Intel Core i7-13700, NVIDIA GeForce RTX 4090 | |
| Intel Core i5-14600K, NVIDIA GeForce RTX 4090 | |
| Intel Core i7-12700, NVIDIA GeForce RTX 4090 | |
| Intel Core i5-13400, NVIDIA GeForce RTX 4090 | |
| GTA V - 1024x768 Lowest Settings possible | |
| AMD Ryzen 7 7800X3D, NVIDIA GeForce RTX 4090 | |
| AMD Ryzen 9 7950X, NVIDIA GeForce RTX 4090 | |
| AMD Ryzen 5 9600X, NVIDIA GeForce RTX 4090 | |
| Intel Core i9-14900K, NVIDIA GeForce RTX 4090 | |
| Intel Core i7-13700, NVIDIA GeForce RTX 4090 | |
| Intel Core i5-14600K, NVIDIA GeForce RTX 4090 | |
| AMD Ryzen 7 7745HX, NVIDIA GeForce RTX 4090 | |
| AMD Ryzen 9 7945HX, NVIDIA GeForce RTX 4090 | |
| Intel Core i7-12700, NVIDIA GeForce RTX 4090 | |
| Intel Core i5-13400, NVIDIA GeForce RTX 4090 | |
| Borderlands 3 - 1280x720 Very Low Overall Quality (DX11) | |
| AMD Ryzen 7 7800X3D, NVIDIA GeForce RTX 4090 | |
| Intel Core i9-14900K, NVIDIA GeForce RTX 4090 | |
| AMD Ryzen 9 7950X, NVIDIA GeForce RTX 4090 | |
| Intel Core i5-14600K, NVIDIA GeForce RTX 4090 | |
| AMD Ryzen 5 9600X, NVIDIA GeForce RTX 4090 | |
| Intel Core i7-13700, NVIDIA GeForce RTX 4090 | |
| AMD Ryzen 9 7945HX, NVIDIA GeForce RTX 4090 | |
| AMD Ryzen 7 7745HX, NVIDIA GeForce RTX 4090 | |
| Intel Core i7-12700, NVIDIA GeForce RTX 4090 | |
| Intel Core i5-13400, NVIDIA GeForce RTX 4090 | |
| Far Cry New Dawn - 1280x720 Low Preset | |
| AMD Ryzen 7 7800X3D, NVIDIA GeForce RTX 4090 | |
| Intel Core i9-14900K, NVIDIA GeForce RTX 4090 | |
| AMD Ryzen 5 9600X, NVIDIA GeForce RTX 4090 | |
| Intel Core i5-14600K, NVIDIA GeForce RTX 4090 | |
| Intel Core i7-13700, NVIDIA GeForce RTX 4090 | |
| AMD Ryzen 9 7950X, NVIDIA GeForce RTX 4090 | |
| Intel Core i7-12700, NVIDIA GeForce RTX 4090 | |
| AMD Ryzen 7 7745HX, NVIDIA GeForce RTX 4090 | |
| AMD Ryzen 9 7945HX, NVIDIA GeForce RTX 4090 | |
| Intel Core i5-13400, NVIDIA GeForce RTX 4090 | |
| Shadow of the Tomb Raider - 1280x720 Lowest Preset | |
| AMD Ryzen 7 7800X3D, NVIDIA GeForce RTX 4090 | |
| Intel Core i9-14900K, NVIDIA GeForce RTX 4090 | |
| AMD Ryzen 9 7950X, NVIDIA GeForce RTX 4090 | |
| AMD Ryzen 5 9600X, NVIDIA GeForce RTX 4090 | |
| Intel Core i5-14600K, NVIDIA GeForce RTX 4090 | |
| AMD Ryzen 7 7745HX, NVIDIA GeForce RTX 4090 | |
| AMD Ryzen 9 7945HX, NVIDIA GeForce RTX 4090 | |
| Intel Core i7-13700, NVIDIA GeForce RTX 4090 | |
| Intel Core i7-12700, NVIDIA GeForce RTX 4090 | |
| Intel Core i5-13400, NVIDIA GeForce RTX 4090 | |
| Tiny Tina's Wonderlands - 1280x720 Lowest Preset (DX12) | |
| AMD Ryzen 7 7800X3D, NVIDIA GeForce RTX 4090 | |
| Intel Core i9-14900K, NVIDIA GeForce RTX 4090 | |
| AMD Ryzen 9 7950X, NVIDIA GeForce RTX 4090 | |
| Intel Core i5-14600K, NVIDIA GeForce RTX 4090 | |
| AMD Ryzen 5 9600X, NVIDIA GeForce RTX 4090 | |
| AMD Ryzen 7 7745HX, NVIDIA GeForce RTX 4090 | |
| Intel Core i7-13700, NVIDIA GeForce RTX 4090 | |
| AMD Ryzen 9 7945HX, NVIDIA GeForce RTX 4090 | |
| Intel Core i7-12700, NVIDIA GeForce RTX 4090 | |
| Intel Core i5-13400, NVIDIA GeForce RTX 4090 | |
| Strange Brigade - 1280x720 lowest AF:1 | |
| Intel Core i9-14900K, NVIDIA GeForce RTX 4090 | |
| AMD Ryzen 7 7800X3D, NVIDIA GeForce RTX 4090 | |
| AMD Ryzen 5 9600X, NVIDIA GeForce RTX 4090 | |
| Intel Core i5-14600K, NVIDIA GeForce RTX 4090 | |
| AMD Ryzen 9 7950X, NVIDIA GeForce RTX 4090 | |
| AMD Ryzen 7 7745HX, NVIDIA GeForce RTX 4090 | |
| Intel Core i7-13700, NVIDIA GeForce RTX 4090 | |
| AMD Ryzen 9 7945HX, NVIDIA GeForce RTX 4090 | |
| Intel Core i7-12700, NVIDIA GeForce RTX 4090 | |
| Intel Core i5-13400, NVIDIA GeForce RTX 4090 | |
| Metro Exodus - 1280x720 Low Quality AF:4x | |
| AMD Ryzen 7 7800X3D, NVIDIA GeForce RTX 4090 | |
| AMD Ryzen 5 9600X, NVIDIA GeForce RTX 4090 | |
| Intel Core i9-14900K, NVIDIA GeForce RTX 4090 | |
| AMD Ryzen 9 7950X, NVIDIA GeForce RTX 4090 | |
| Intel Core i5-14600K, NVIDIA GeForce RTX 4090 | |
| AMD Ryzen 7 7745HX, NVIDIA GeForce RTX 4090 | |
| AMD Ryzen 9 7945HX, NVIDIA GeForce RTX 4090 | |
| Intel Core i7-13700, NVIDIA GeForce RTX 4090 | |
| Intel Core i7-12700, NVIDIA GeForce RTX 4090 | |
| Intel Core i5-13400, NVIDIA GeForce RTX 4090 | |
| F1 2020 - 1280x720 Ultra Low Preset | |
| AMD Ryzen 7 7800X3D, NVIDIA GeForce RTX 4090 | |
| AMD Ryzen 5 9600X, NVIDIA GeForce RTX 4090 | |
| Intel Core i9-14900K, NVIDIA GeForce RTX 4090 | |
| AMD Ryzen 9 7950X, NVIDIA GeForce RTX 4090 | |
| AMD Ryzen 7 7745HX, NVIDIA GeForce RTX 4090 | |
| AMD Ryzen 9 7945HX, NVIDIA GeForce RTX 4090 | |
| Intel Core i7-13700, NVIDIA GeForce RTX 4090 | |
| Intel Core i5-14600K, NVIDIA GeForce RTX 4090 | |
| Intel Core i7-12700, NVIDIA GeForce RTX 4090 | |
| Intel Core i5-13400, NVIDIA GeForce RTX 4090 | |
| F1 2021 - 1280x720 Ultra Low Preset | |
| AMD Ryzen 7 7800X3D, NVIDIA GeForce RTX 4090 | |
| Intel Core i9-14900K, NVIDIA GeForce RTX 4090 | |
| AMD Ryzen 9 7950X, NVIDIA GeForce RTX 4090 | |
| AMD Ryzen 5 9600X, NVIDIA GeForce RTX 4090 | |
| AMD Ryzen 7 7745HX, NVIDIA GeForce RTX 4090 | |
| Intel Core i7-13700, NVIDIA GeForce RTX 4090 | |
| Intel Core i5-14600K, NVIDIA GeForce RTX 4090 | |
| AMD Ryzen 9 7945HX, NVIDIA GeForce RTX 4090 | |
| Intel Core i7-12700, NVIDIA GeForce RTX 4090 | |
| Intel Core i5-13400, NVIDIA GeForce RTX 4090 | |
Performance comparison at GPU limit at 2,160p
| Performance rating - Percent | |
| AMD Ryzen 7 7800X3D, NVIDIA GeForce RTX 4090 | |
| Intel Core i9-14900K, NVIDIA GeForce RTX 4090 -1! | |
| Intel Core i5-14600K, NVIDIA GeForce RTX 4090 | |
| AMD Ryzen 9 7950X, NVIDIA GeForce RTX 4090 | |
| AMD Ryzen 5 9600X, NVIDIA GeForce RTX 4090 | |
| Intel Core i7-13700, NVIDIA GeForce RTX 4090 | |
| AMD Ryzen 7 7745HX, NVIDIA GeForce RTX 4090 | |
| AMD Ryzen 9 7945HX, NVIDIA GeForce RTX 4090 | |
| Intel Core i7-12700, NVIDIA GeForce RTX 4090 | |
| Intel Core i5-13400, NVIDIA GeForce RTX 4090 | |
| F1 22 - 3840x2160 Ultra High Preset AA:T AF:16x | |
| AMD Ryzen 5 9600X, NVIDIA GeForce RTX 4090 | |
| AMD Ryzen 9 7945HX, NVIDIA GeForce RTX 4090 | |
| AMD Ryzen 7 7745HX, NVIDIA GeForce RTX 4090 | |
| AMD Ryzen 7 7800X3D, NVIDIA GeForce RTX 4090 | |
| Intel Core i9-14900K, NVIDIA GeForce RTX 4090 | |
| Intel Core i5-14600K, NVIDIA GeForce RTX 4090 | |
| AMD Ryzen 9 7950X, NVIDIA GeForce RTX 4090 | |
| Intel Core i7-13700, NVIDIA GeForce RTX 4090 | |
| Intel Core i7-12700, NVIDIA GeForce RTX 4090 | |
| Intel Core i5-13400, NVIDIA GeForce RTX 4090 | |
| Far Cry 5 - 3840x2160 Ultra Preset AA:T | |
| AMD Ryzen 7 7800X3D, NVIDIA GeForce RTX 4090 | |
| Intel Core i5-14600K, NVIDIA GeForce RTX 4090 | |
| Intel Core i9-14900K, NVIDIA GeForce RTX 4090 | |
| AMD Ryzen 9 7950X, NVIDIA GeForce RTX 4090 | |
| Intel Core i7-13700, NVIDIA GeForce RTX 4090 | |
| AMD Ryzen 5 9600X, NVIDIA GeForce RTX 4090 | |
| Intel Core i7-12700, NVIDIA GeForce RTX 4090 | |
| AMD Ryzen 7 7745HX, NVIDIA GeForce RTX 4090 | |
| AMD Ryzen 9 7945HX, NVIDIA GeForce RTX 4090 | |
| Intel Core i5-13400, NVIDIA GeForce RTX 4090 | |
| Final Fantasy XV Benchmark - 3840x2160 High Quality | |
| Intel Core i9-14900K, NVIDIA GeForce RTX 4090 | |
| Intel Core i5-14600K, NVIDIA GeForce RTX 4090 | |
| AMD Ryzen 9 7950X, NVIDIA GeForce RTX 4090 | |
| AMD Ryzen 7 7745HX, NVIDIA GeForce RTX 4090 | |
| AMD Ryzen 7 7800X3D, NVIDIA GeForce RTX 4090 | |
| Intel Core i7-13700, NVIDIA GeForce RTX 4090 | |
| Intel Core i7-12700, NVIDIA GeForce RTX 4090 | |
| AMD Ryzen 9 7945HX, NVIDIA GeForce RTX 4090 | |
| AMD Ryzen 5 9600X, NVIDIA GeForce RTX 4090 | |
| Intel Core i5-13400, NVIDIA GeForce RTX 4090 | |
| Dota 2 Reborn - 3840x2160 ultra (3/3) best looking | |
| AMD Ryzen 7 7800X3D, NVIDIA GeForce RTX 4090 | |
| AMD Ryzen 9 7950X, NVIDIA GeForce RTX 4090 | |
| Intel Core i9-14900K, NVIDIA GeForce RTX 4090 | |
| AMD Ryzen 5 9600X, NVIDIA GeForce RTX 4090 | |
| Intel Core i5-14600K, NVIDIA GeForce RTX 4090 | |
| Intel Core i7-13700, NVIDIA GeForce RTX 4090 | |
| AMD Ryzen 9 7945HX, NVIDIA GeForce RTX 4090 | |
| AMD Ryzen 7 7745HX, NVIDIA GeForce RTX 4090 | |
| Intel Core i7-12700, NVIDIA GeForce RTX 4090 | |
| Intel Core i5-13400, NVIDIA GeForce RTX 4090 | |
| The Witcher 3 - 3840x2160 High Graphics & Postprocessing (Nvidia HairWorks Off) | |
| AMD Ryzen 9 7945HX, NVIDIA GeForce RTX 4090 | |
| Intel Core i5-14600K, NVIDIA GeForce RTX 4090 | |
| AMD Ryzen 9 7950X, NVIDIA GeForce RTX 4090 | |
| Intel Core i5-13400, NVIDIA GeForce RTX 4090 | |
| Intel Core i7-13700, NVIDIA GeForce RTX 4090 | |
| Intel Core i7-12700, NVIDIA GeForce RTX 4090 | |
| AMD Ryzen 7 7800X3D, NVIDIA GeForce RTX 4090 | |
| AMD Ryzen 7 7745HX, NVIDIA GeForce RTX 4090 | |
| AMD Ryzen 5 9600X, NVIDIA GeForce RTX 4090 | |
| GTA V - 3840x2160 Highest AA:4xMSAA + FX AF:16x | |
| AMD Ryzen 7 7800X3D, NVIDIA GeForce RTX 4090 | |
| Intel Core i9-14900K, NVIDIA GeForce RTX 4090 | |
| Intel Core i5-14600K, NVIDIA GeForce RTX 4090 | |
| AMD Ryzen 5 9600X, NVIDIA GeForce RTX 4090 | |
| AMD Ryzen 9 7950X, NVIDIA GeForce RTX 4090 | |
| Intel Core i7-13700, NVIDIA GeForce RTX 4090 | |
| AMD Ryzen 7 7745HX, NVIDIA GeForce RTX 4090 | |
| AMD Ryzen 9 7945HX, NVIDIA GeForce RTX 4090 | |
| Intel Core i7-12700, NVIDIA GeForce RTX 4090 | |
| Intel Core i5-13400, NVIDIA GeForce RTX 4090 | |
| Borderlands 3 - 3840x2160 Badass Overall Quality (DX11) | |
| Intel Core i9-14900K, NVIDIA GeForce RTX 4090 | |
| AMD Ryzen 7 7800X3D, NVIDIA GeForce RTX 4090 | |
| Intel Core i5-14600K, NVIDIA GeForce RTX 4090 | |
| AMD Ryzen 9 7950X, NVIDIA GeForce RTX 4090 | |
| AMD Ryzen 9 7945HX, NVIDIA GeForce RTX 4090 | |
| Intel Core i7-13700, NVIDIA GeForce RTX 4090 | |
| AMD Ryzen 5 9600X, NVIDIA GeForce RTX 4090 | |
| AMD Ryzen 7 7745HX, NVIDIA GeForce RTX 4090 | |
| Intel Core i7-12700, NVIDIA GeForce RTX 4090 | |
| Intel Core i5-13400, NVIDIA GeForce RTX 4090 | |
| Far Cry New Dawn - 3840x2160 Ultra Preset | |
| AMD Ryzen 7 7800X3D, NVIDIA GeForce RTX 4090 | |
| Intel Core i9-14900K, NVIDIA GeForce RTX 4090 | |
| Intel Core i5-14600K, NVIDIA GeForce RTX 4090 | |
| AMD Ryzen 5 9600X, NVIDIA GeForce RTX 4090 | |
| AMD Ryzen 9 7950X, NVIDIA GeForce RTX 4090 | |
| Intel Core i7-13700, NVIDIA GeForce RTX 4090 | |
| Intel Core i7-12700, NVIDIA GeForce RTX 4090 | |
| AMD Ryzen 7 7745HX, NVIDIA GeForce RTX 4090 | |
| AMD Ryzen 9 7945HX, NVIDIA GeForce RTX 4090 | |
| Intel Core i5-13400, NVIDIA GeForce RTX 4090 | |
| Shadow of the Tomb Raider - 3840x2160 Highest Preset AA:T | |
| Intel Core i5-14600K, NVIDIA GeForce RTX 4090 | |
| Intel Core i9-14900K, NVIDIA GeForce RTX 4090 | |
| AMD Ryzen 5 9600X, NVIDIA GeForce RTX 4090 | |
| AMD Ryzen 7 7800X3D, NVIDIA GeForce RTX 4090 | |
| Intel Core i7-13700, NVIDIA GeForce RTX 4090 | |
| AMD Ryzen 9 7945HX, NVIDIA GeForce RTX 4090 | |
| AMD Ryzen 7 7745HX, NVIDIA GeForce RTX 4090 | |
| AMD Ryzen 9 7950X, NVIDIA GeForce RTX 4090 | |
| Intel Core i7-12700, NVIDIA GeForce RTX 4090 | |
| Intel Core i5-13400, NVIDIA GeForce RTX 4090 | |
| Tiny Tina's Wonderlands - 3840x2160 Badass Preset (DX12) | |
| Intel Core i9-14900K, NVIDIA GeForce RTX 4090 | |
| AMD Ryzen 7 7745HX, NVIDIA GeForce RTX 4090 | |
| Intel Core i5-14600K, NVIDIA GeForce RTX 4090 | |
| AMD Ryzen 9 7950X, NVIDIA GeForce RTX 4090 | |
| Intel Core i7-13700, NVIDIA GeForce RTX 4090 | |
| AMD Ryzen 5 9600X, NVIDIA GeForce RTX 4090 | |
| AMD Ryzen 7 7800X3D, NVIDIA GeForce RTX 4090 | |
| AMD Ryzen 9 7945HX, NVIDIA GeForce RTX 4090 | |
| Intel Core i7-12700, NVIDIA GeForce RTX 4090 | |
| Intel Core i5-13400, NVIDIA GeForce RTX 4090 | |
| Strange Brigade - 3840x2160 ultra AA:ultra AF:16 | |
| Intel Core i9-14900K, NVIDIA GeForce RTX 4090 | |
| AMD Ryzen 7 7800X3D, NVIDIA GeForce RTX 4090 | |
| Intel Core i5-14600K, NVIDIA GeForce RTX 4090 | |
| AMD Ryzen 9 7945HX, NVIDIA GeForce RTX 4090 | |
| AMD Ryzen 7 7745HX, NVIDIA GeForce RTX 4090 | |
| AMD Ryzen 5 9600X, NVIDIA GeForce RTX 4090 | |
| Intel Core i7-12700, NVIDIA GeForce RTX 4090 | |
| Intel Core i7-13700, NVIDIA GeForce RTX 4090 | |
| AMD Ryzen 9 7950X, NVIDIA GeForce RTX 4090 | |
| Intel Core i5-13400, NVIDIA GeForce RTX 4090 | |
| Metro Exodus - 3840x2160 Ultra Quality AF:16x | |
| Intel Core i9-14900K, NVIDIA GeForce RTX 4090 | |
| Intel Core i5-14600K, NVIDIA GeForce RTX 4090 | |
| AMD Ryzen 7 7800X3D, NVIDIA GeForce RTX 4090 | |
| AMD Ryzen 9 7950X, NVIDIA GeForce RTX 4090 | |
| AMD Ryzen 5 9600X, NVIDIA GeForce RTX 4090 | |
| Intel Core i7-13700, NVIDIA GeForce RTX 4090 | |
| AMD Ryzen 7 7745HX, NVIDIA GeForce RTX 4090 | |
| AMD Ryzen 9 7945HX, NVIDIA GeForce RTX 4090 | |
| Intel Core i7-12700, NVIDIA GeForce RTX 4090 | |
| Intel Core i5-13400, NVIDIA GeForce RTX 4090 | |
| F1 2020 - 3840x2160 Ultra High Preset AA:T AF:16x | |
| AMD Ryzen 7 7800X3D, NVIDIA GeForce RTX 4090 | |
| Intel Core i5-14600K, NVIDIA GeForce RTX 4090 | |
| AMD Ryzen 7 7745HX, NVIDIA GeForce RTX 4090 | |
| AMD Ryzen 5 9600X, NVIDIA GeForce RTX 4090 | |
| AMD Ryzen 9 7950X, NVIDIA GeForce RTX 4090 | |
| Intel Core i9-14900K, NVIDIA GeForce RTX 4090 | |
| Intel Core i7-13700, NVIDIA GeForce RTX 4090 | |
| AMD Ryzen 9 7945HX, NVIDIA GeForce RTX 4090 | |
| Intel Core i7-12700, NVIDIA GeForce RTX 4090 | |
| Intel Core i5-13400, NVIDIA GeForce RTX 4090 | |
| F1 2021 - 3840x2160 Ultra High Preset + Raytracing AA:T AF:16x | |
| AMD Ryzen 7 7800X3D, NVIDIA GeForce RTX 4090 | |
| AMD Ryzen 7 7745HX, NVIDIA GeForce RTX 4090 | |
| AMD Ryzen 5 9600X, NVIDIA GeForce RTX 4090 | |
| AMD Ryzen 9 7945HX, NVIDIA GeForce RTX 4090 | |
| Intel Core i5-14600K, NVIDIA GeForce RTX 4090 | |
| Intel Core i9-14900K, NVIDIA GeForce RTX 4090 | |
| AMD Ryzen 9 7950X, NVIDIA GeForce RTX 4090 | |
| Intel Core i7-13700, NVIDIA GeForce RTX 4090 | |
| Intel Core i7-12700, NVIDIA GeForce RTX 4090 | |
| Intel Core i5-13400, NVIDIA GeForce RTX 4090 | |
| alacsony | közepes | magas | ultra | QHD | 4K | |
|---|---|---|---|---|---|---|
| GTA V (2015) | 187.6 | 187.3 | 183 | 141 | 140.5 | 183.6 |
| The Witcher 3 (2015) | 709 | 618 | 563 | 310 | 272 | 292 |
| Dota 2 Reborn (2015) | 268.7 | 234.8 | 221.4 | 202.6 | 196.7 | |
| Final Fantasy XV Benchmark (2018) | 234 | 234 | 213 | 208 | 152 | |
| X-Plane 11.11 (2018) | 196.4 | 169.4 | 127.6 | 105.9 | ||
| Far Cry 5 (2018) | 191 | 168 | 163 | 151 | 151 | 146 |
| Strange Brigade (2018) | 592 | 470 | 465 | 463 | 461 | 289 |
| Shadow of the Tomb Raider (2018) | 273 | 266 | 264 | 263 | 252 | 186.8 |
| Far Cry New Dawn (2019) | 165 | 142 | 139 | 124 | 129 | 123 |
| Metro Exodus (2019) | 270 | 243 | 210 | 183.2 | 167.7 | 133.7 |
| Borderlands 3 (2019) | 213 | 189.6 | 175.5 | 165.6 | 163.2 | 134.1 |
| F1 2020 (2020) | 470 | 390 | 379 | 359 | 354 | 283 |
| F1 2021 (2021) | 562 | 533 | 455 | 220 | 222 | 203 |
| Tiny Tina's Wonderlands (2022) | 365 | 308 | 269 | 258 | 222 | 129.8 |
| F1 22 (2022) | 382 | 366 | 339 | 170 | 159.4 | 85 |
| F1 23 (2023) | 368 | 390 | 373 | 164.3 | 147.9 | 80.9 |
| Cyberpunk 2077 (2023) | 186 | 183.2 | 177.4 | 163.9 | 151.4 | 75.3 |
| Assassin's Creed Mirage (2023) | 250 | 244 | 236 | 167 | 163 | 128 |
| Avatar Frontiers of Pandora (2023) | 232 | 212 | 202 | 170 | 126 | 70 |
| F1 24 (2024) | 350 | 371 | 345 | 176.7 | 146.3 | 80 |
Energiafogyasztás és hőmérséklet
A Minisforum a BD790i alaplapot előre telepített hőcsöves hűtőegységgel szállítja, amely hűti a processzort és az alaplapon lévő feszültségátalakítókat. A ventilátor kiválasztása a felhasználóra van bízva, és azt saját magának kell beszerelnie. A 120 milliméteres ventilátor beszereléséhez szükséges megfelelő szerelőanyagot mellékeljük. Mi egy Noctua NF-A12x25 ventilátort választottunk, amelyet már a Minisforum BD770i tesztünkben is használtunk. A Minisforum BD790i legnagyobb előnye a hagyományos asztali PC-kkel szemben az alacsony energiafogyasztás. A Cinebench R15 multiteszt során mindössze 140 watt körüli fogyasztást mértünk, ami a teljesítményéhez képest nagyszerű hatékonyságnak számít.
Az általános működésével és a működés közbeni zajszintjével kapcsolatban csak annyit tudunk mondani, hogy a beépített tápegység a tesztfelszerelésünkben hallható volt. Mind üresjáratban, mind terhelés alatt nem tudtunk olyan méréseket végezni, amelyeket a beépített tápegység befolyásolna. A CPU ventilátor és az SSD hűtésére szolgáló, előre beszerelt ventilátor a zárt házból nem hallható. A hűtés nagyon hatékonyan működik, és terhelés alatt nem dokumentáltunk kritikus értékeket. Ennek ellenére azon a véleményen vagyunk, hogy a CPU és a VRM hűtő szétválasztásának lenne értelme, hogy magához a processzorhoz is telepíthessünk hűtési megoldást. A SoC-t minden bizonnyal még hatékonyabban lehetne hűteni egy AiO megoldással.
Az ismert alaplapgyártókhoz képest a Minisforum BD790i alaplap BIOS-ában a beállítási lehetőségek igen korlátozottak. A processzor fogyasztása változtatható, bár a ventilátor görbéje külön nem állítható. Ha a Minisforum továbbra is lefedné ezt a piacot, nagyon örülnénk egy felhasználóbarátabb lehetőségnek.
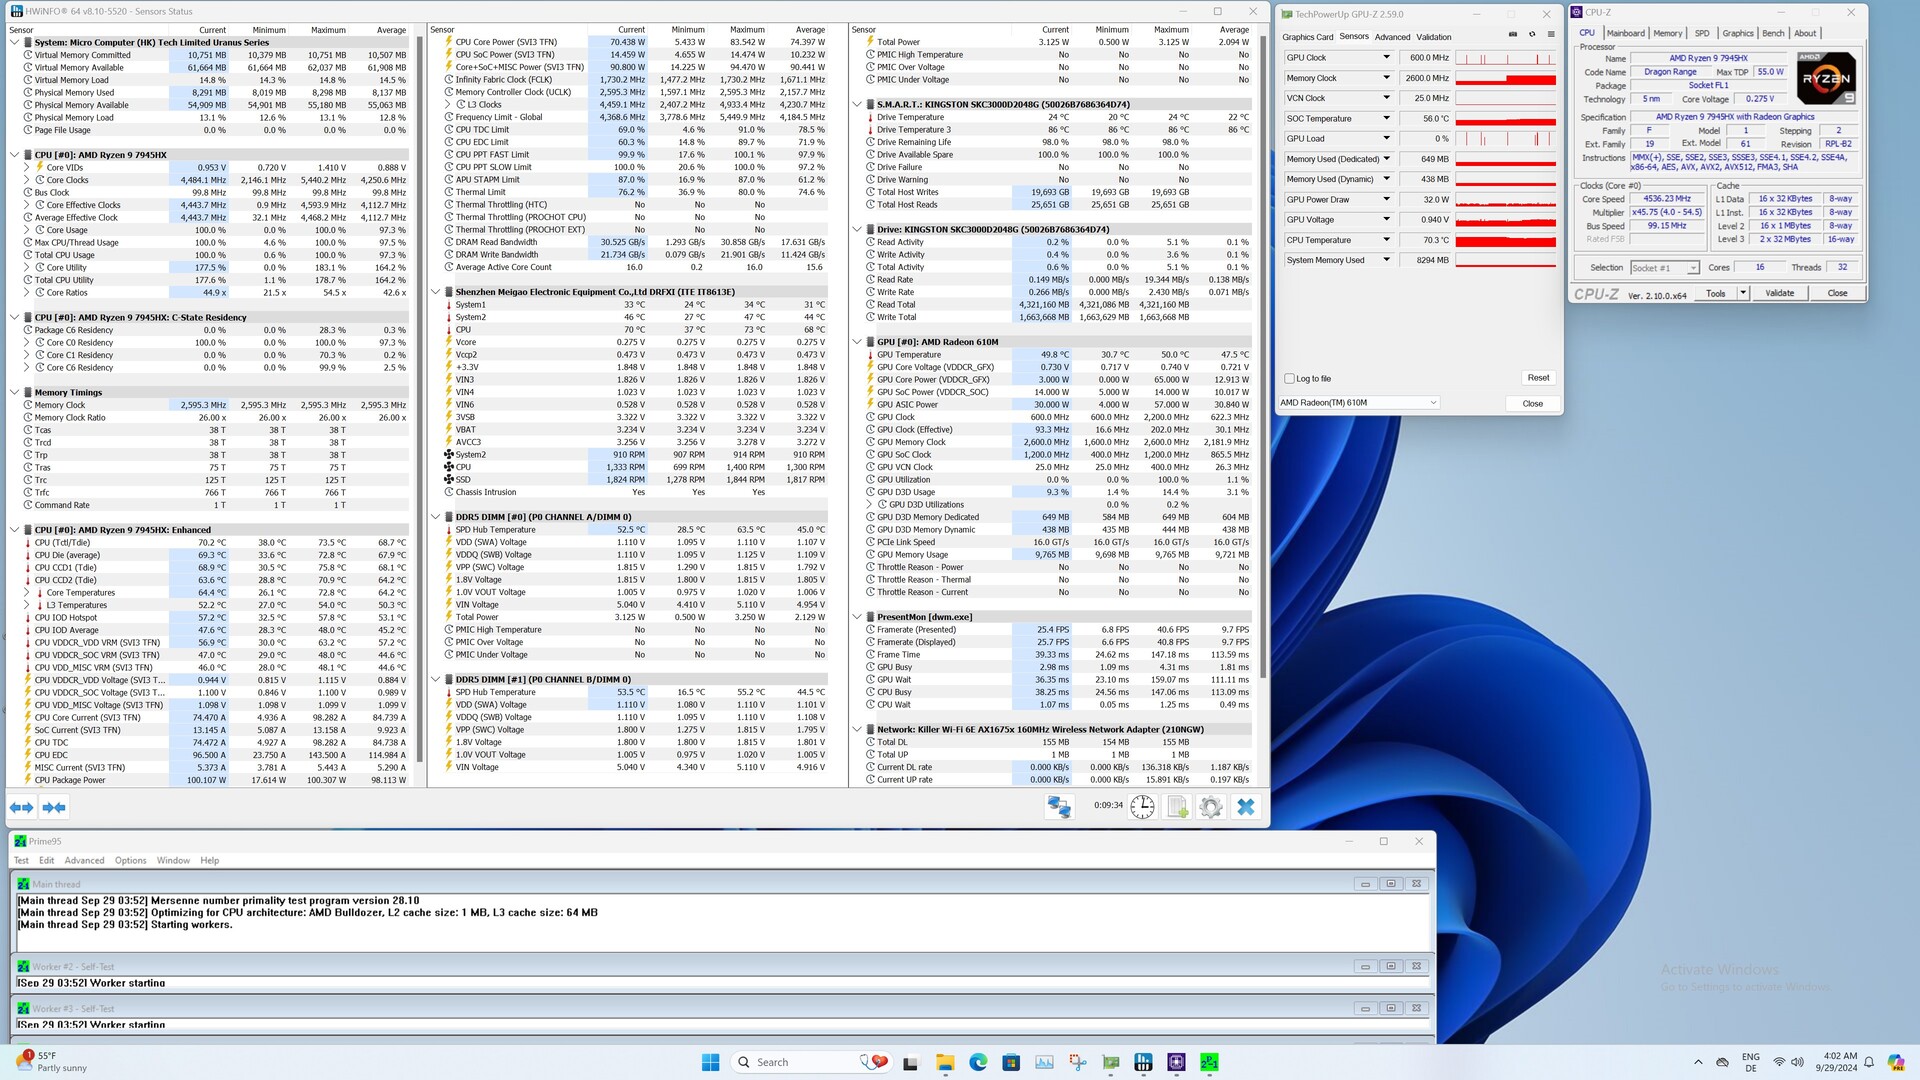
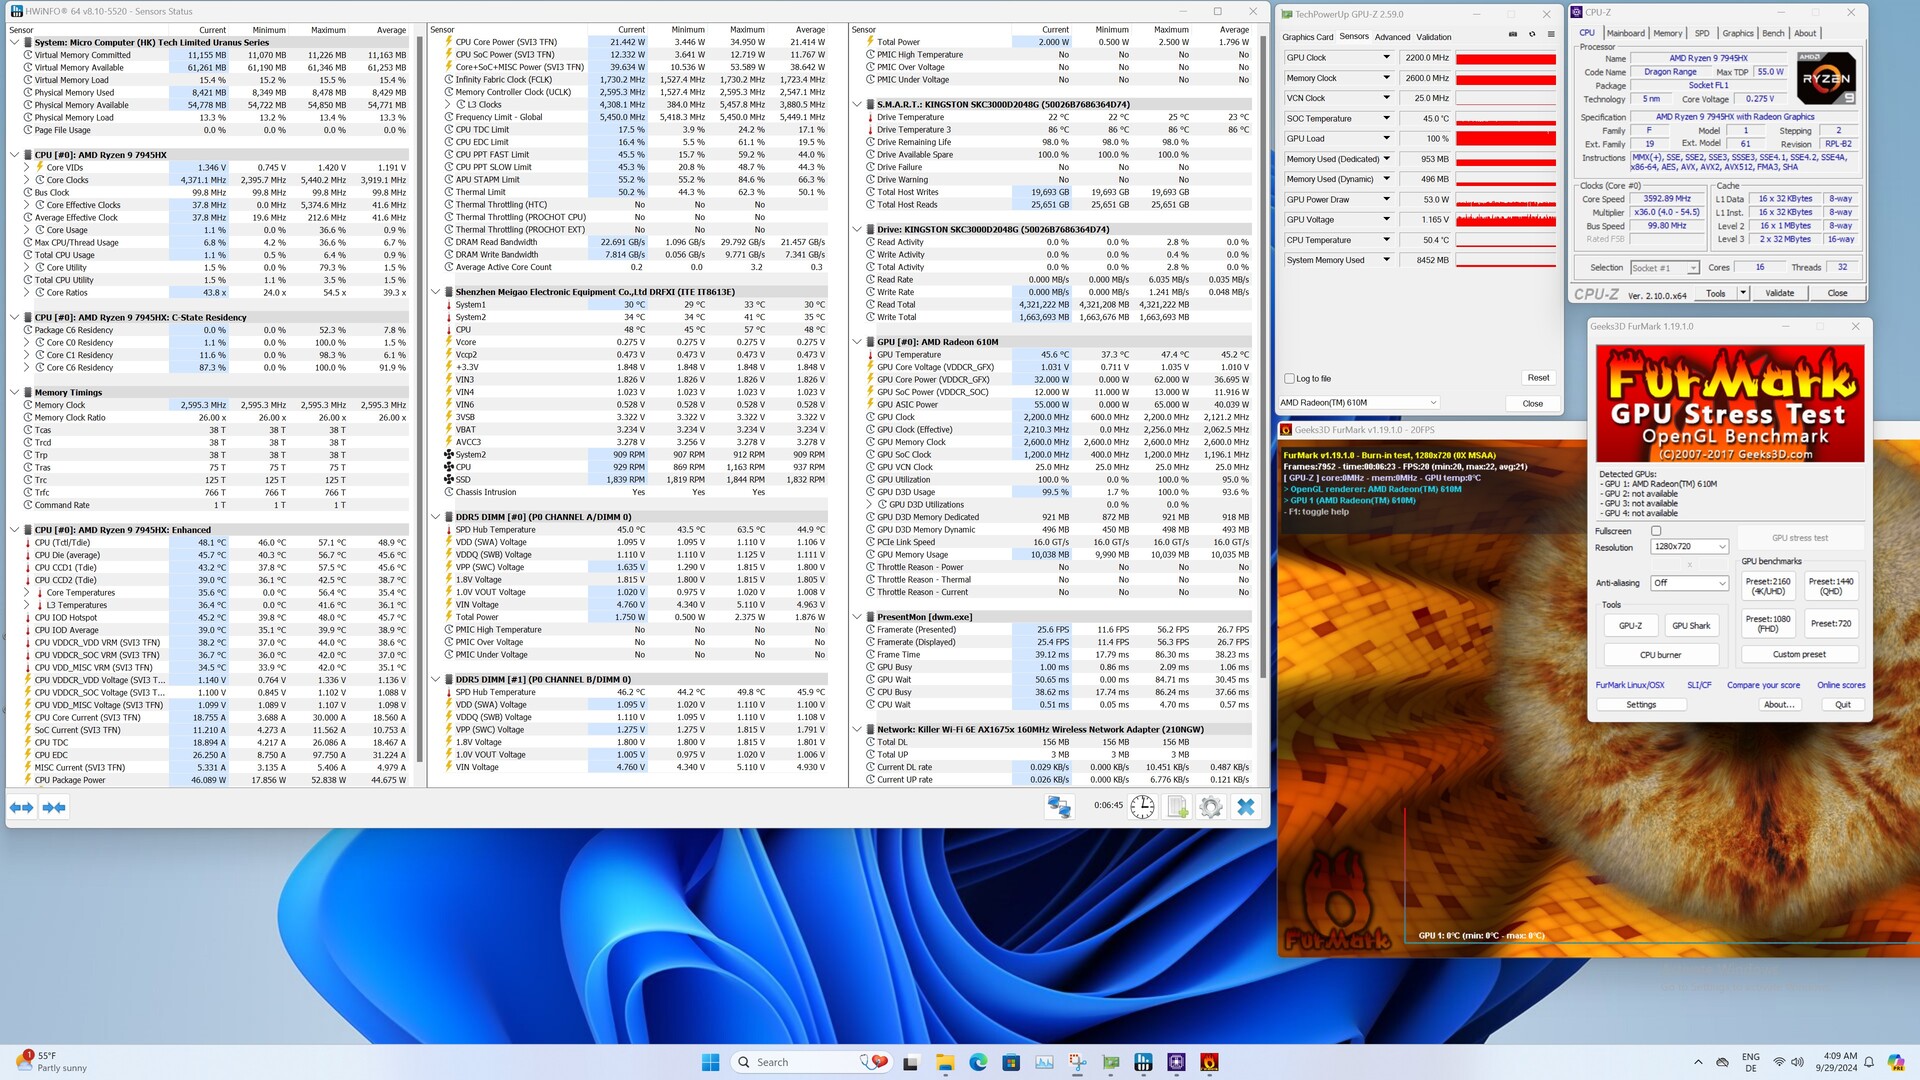

Efficiency overview
| Performance rating - Percent | |
| Minisforum BD790i | |
| Minisforum BD770i | |
| Power Consumption | |
| Cinebench R23 Multi Power Efficiency - external Monitor | |
| Minisforum BD790i | |
| Minisforum BD770i | |
| Cinebench R23 Single Power Efficiency - external Monitor | |
| Minisforum BD770i | |
| Minisforum BD790i | |
| Cinebench R15 Multi Efficiency (external Monitor) | |
| Minisforum BD790i | |
| Minisforum BD770i | |
| Power Consumption / Cinebench R15 Multi (external Monitor) | |
| Intel Core i9-14900K | |
| Intel Core i9-13900K | |
| AMD Ryzen 9 7950X (Idle: 95.2 W) | |
| Intel Core i7-13700K | |
| Intel Core i5-14600K | |
| Intel Core i5-13600K | |
| Intel Core i7-12700 | |
| AMD Ryzen 9 7950X3D | |
| AMD Ryzen 7 7800X3D | |
| Intel Core i5-13400 | |
| Intel Core i5-12400F | |
| AMD Ryzen 9 7945HX | |
| AMD Ryzen 7 7745HX | |
| Power Consumption / Prime95 V2810 Stress (external Monitor) | |
| Intel Core i9-14900K | |
| Intel Core i9-13900K | |
| Intel Core i5-14600K | |
| Intel Core i7-13700K | |
| Intel Core i5-13600K | |
| AMD Ryzen 9 7950X (Idle: 95.2 W) | |
| Intel Core i7-12700 | |
| AMD Ryzen 9 7950X3D | |
| Intel Core i5-12400F | |
| Intel Core i5-13400 | |
| AMD Ryzen 7 7800X3D | |
| AMD Ryzen 9 7945HX | |
| AMD Ryzen 7 7745HX | |
| Power Consumption / Cinebench R23 Multi (external Monitor) | |
| Intel Core i9-14900K | |
| AMD Ryzen 9 7950X (95.2) | |
| Intel Core i5-14600K | |
| AMD Ryzen 9 7950X3D | |
| AMD Ryzen 7 7800X3D | |
| AMD Ryzen 9 7945HX | |
| AMD Ryzen 7 7745HX | |
| Power Consumption / Cinebench R23 Single (external Monitor) | |
| AMD Ryzen 7 7800X3D | |
| AMD Ryzen 9 7950X (95.2) | |
| Intel Core i9-14900K | |
| Intel Core i5-14600K | |
| AMD Ryzen 9 7945HX | |
| AMD Ryzen 7 7745HX | |
| Power Consumption / Cinebench R15 Multi Efficiency (external Monitor) | |
| AMD Ryzen 9 7945HX | |
| AMD Ryzen 7 7745HX | |
| AMD Ryzen 9 7950X3D | |
| AMD Ryzen 9 7950X | |
| AMD Ryzen 7 7800X3D | |
| Intel Core i9-13900K | |
| Intel Core i5-13600K | |
| Intel Core i9-14900K | |
| Intel Core i5-14600K | |
* ... a kisebb jobb
Power consumption with and without dedicated graphics card
Power consumption with Nvidia GeForce RTX 4090
Pro
Kontra
Vélemény - Erőteljes AMD Ryzen 9 7945HX

A Minisforum BD790i egy SoC-t is tartalmazó, nagy teljesítményű alaplap, amely Mini-ITX alaplapként tökéletes alapot nyújt kis rendszerek építéséhez. Mivel ez csak egy alaplap, a gyártó azokat a vásárlókat célozza meg, akik hajlandóak maguknak rendszert építeni. A kész mini PC-kkel ellentétben itt még gondoskodni kell a további komponensekről. Magától értetődik, hogy ez további költségekkel jár.
A Minisforum BD790i az AMD Ryzen 9 7945HX processzorral kombinálva lenyűgöző teljesítményt, nagyszerű hatékonyságot és - a PCIe-5.0 támogatásnak köszönhetően - jó jövőbemutató tulajdonságokat biztosít a grafikus kártyák és SSD-k számára.
Magának a Minisforum BD790i-nek a tesztjei alapján elmondhatjuk, hogy az AMD Ryzen 9 7945HX egy rendkívül erős processzor, amely jelenleg minden feladattal könnyedén megbirkózik. Egy Intel Core i9-14900K-val vagy egy AMD Ryzen 9 7950X-szel összehasonlítva az AMD Ryzen 9 7945HX-nek be kell ismernie vereségét - bár a teljesítménykülönbség csak nagyon csekély. Az energiafogyasztás tekintetében a hagyományos asztali processzorok már nem tudnak lépést tartani. A laptop-technológia hagyományos alaplapba való elhelyezése a hatékonyság szempontjából ésszerű döntés. A legnagyobb hátránya azonban az, hogy a SoC nem cserélhető ki egyszerűen. Ráadásul fix hűtőegységre van korlátozva, ami azt jelenti, hogy nem használhat alternatív hűtőegységeket.
Első pillantásra a jelenlegi, alig 500 USD alatti ára nagyon magasnak tűnik. A teljesítményértékek összehasonlításakor azonban az AMD Ryzen 9 7945HX-nek biztosan nem kell a leggyorsabb asztali processzorok mögé bújnia. Jelenlegi árát tehát indokoltnak tartjuk, és ha nem szeretnénk később frissíteni a CPU-t, akkor habozás nélkül megvásárolhatjuk.
Ár és elérhetőség
A cikk írásakor a Minisforum BD790i az Amazonon 479,99 USD-ért vásárolható meg.
Átláthatóság
A felülvizsgálandó készülékek kiválasztását szerkesztőségünk végzi. A próbamintát a gyártó ingyenesen átadta a szerzőnek felülvizsgálat céljából. Harmadik fél nem befolyásolta ezt a véleményt, és a gyártó sem kapott másolatot erről a véleményről a közzététel előtt. Nem volt kötelesség ezt az ismertetőt közzétenni. Független médiavállalatként a Notebookcheck nincs alávetve a gyártók, kiskereskedők vagy kiadók felhatalmazásának.
Így tesztel a Notebookcheck
A Notebookcheck minden évben független, laptopok és okostelefonok százait vizsgálja meg szabványosított eljárások alkalmazásával annak érdekében, hogy minden eredmény összehasonlítható legyen. Körülbelül 20 éve folyamatosan fejlesztjük vizsgálati módszereinket, és ennek során iparági szabványokat állítottunk fel. Tesztlaboratóriumainkban kiváló minőségű mérőberendezéseket használnak tapasztalt technikusok és szerkesztők. Ezek a tesztek többlépcsős validációs folyamatot foglalnak magukban. Komplex minősítési rendszerünk több száz megalapozott mérésen és benchmarkon alapul, ami megőrzi az objektivitást.
