

Dell Inspiron 16 Plus 7640 laptop felülvizsgálata: Apró, de fontos változások a tavalyi modellhez képest

A méltó nevű Inspiron 16 Plus 7640 a 2023-as Inspiron 16 Plus 7630-at váltja fel, a tavalyi Raptor Lake-H opciók helyett új, AI-képes processzorokkal. Néhány egyéb kisebb külső és belső változtatástól eltekintve a modell nagyrészt megegyezik elődjével, ezért javasoljuk, hogy tekintse meg a mi inspiron 15 Plus 7630 értékelését az Inspiron 15 Plus 7640 fizikai jellemzőinek megismeréséhez.
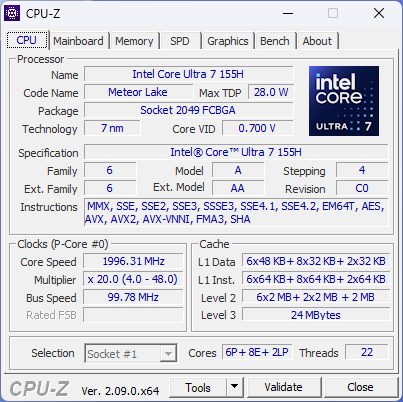
Az Inspiron 16 Plus 7640 számos konfigurációban kapható a 13. generációs Core i7-13620H-tól a 14. generációs Core Ultra 9 185H-ig, az integrált UHD vagy Arc grafikától a diszkrét GeForce RTX 4060-ig, valamint 1200p vagy 1600p kijelzőválasztékkal. Az AMD Zen 4 SKU-k a Ryzen 5 8540U vagy Ryzen 7 8840U modellekkel szintén elérhetőek, bár csak a normál Inspiron 16 7640 nem Plus modellhez, diszkrét grafika vagy 1600p opció nélkül. Tesztkészülékünk egy felső kategóriás konfiguráció Core Ultra 7 155H-val, 1600p kijelzővel és RTX 4060 grafikával, kiskereskedelmi áron körülbelül 1300 dollárért.
A versenytársak közé tartoznak más középkategóriás 16 hüvelykes multimédiás laptopok, mint például a Asus VivoBook Pro 16, Lenovo Yoga 7 2 az 1-ben 16IML9vagy a HP Envy 16 sorozat.
További Dell értékelések:
Lehetséges versenytársak összehasonlítása
Értékelés | Dátum | Modell | Súly | Magasság | Méret | Felbontás | Legjobb ár |
|---|---|---|---|---|---|---|---|
| 83.4 % | 06/2024 | Dell Inspiron 16 Plus 7640 Ultra 7 155H, NVIDIA GeForce RTX 4060 Laptop GPU | 2.2 kg | 19.9 mm | 16.00" | 2560x1600 | |
| 87.1 % v7 (old) | 09/2023 | Dell Inspiron 16 Plus 7630 i7-13700H, NVIDIA GeForce RTX 4060 Laptop GPU | 2.2 kg | 19.95 mm | 16.00" | 2560x1600 | |
| 87.4 % v7 (old) | 11/2022 | Dell Inspiron 16 Plus 7620 i7-12700H, GeForce RTX 3050 Ti Laptop GPU | 2.1 kg | 18.99 mm | 16.00" | 3072x1920 | |
| 90.4 % v7 (old) | 03/2024 | Samsung Galaxy Book4 Ultra Ultra 7 155H, NVIDIA GeForce RTX 4050 Laptop GPU | 1.8 kg | 17 mm | 16.00" | 2880x1800 | |
| 89.1 % v7 (old) | 04/2024 | Lenovo Legion 5 16IRX G9 i7-14650HX, NVIDIA GeForce RTX 4060 Laptop GPU | 2.4 kg | 25.2 mm | 16.00" | 2560x1600 | |
| 87.6 % v7 (old) | Asus VivoBook Pro 16 K6602VU i9-13900H, NVIDIA GeForce RTX 4050 Laptop GPU | 1.9 kg | 19 mm | 16.00" | 3200x2000 |
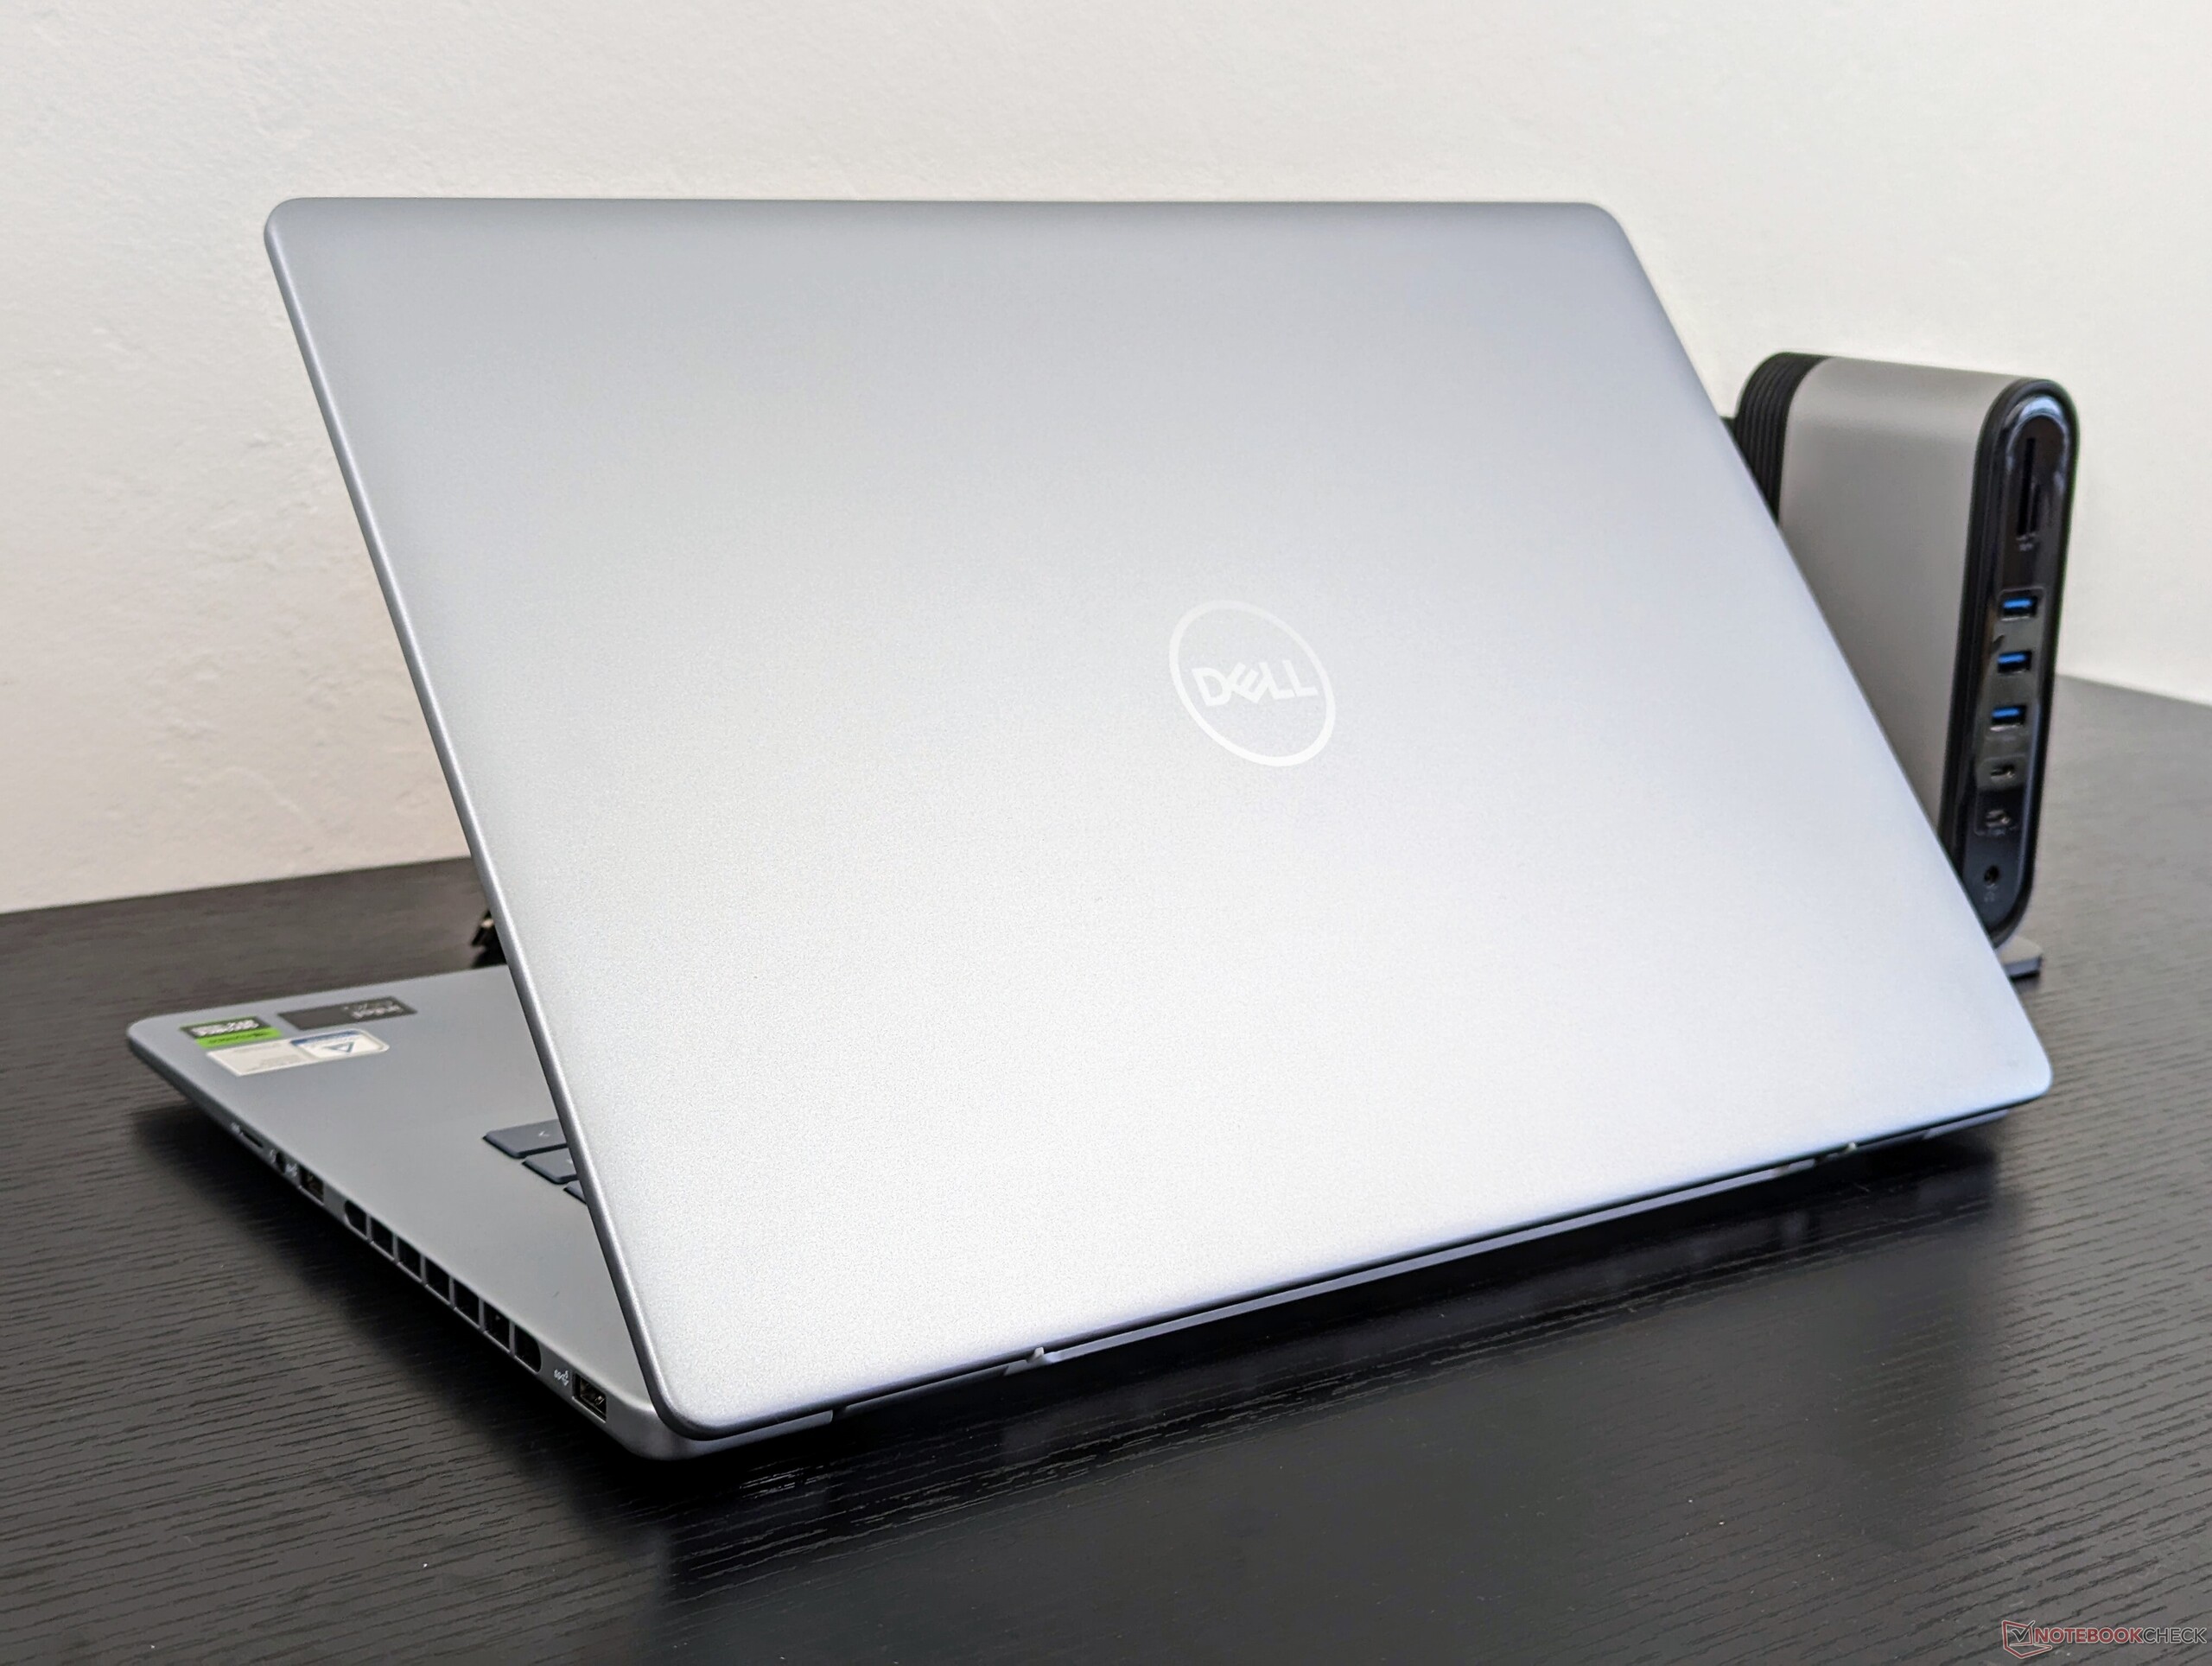
Tok - Több és nagyobb szellőzőnyílás
A modell egy új, dedikált Co-Pilot billentyűt kap, amely a billentyűzet jobb felén lévő Ctrl billentyűt helyettesíti. A tenyértámasz területe laposabb, a talp kerülete kerekebb, a hátsó és oldalsó szellőzőrácsok pedig áttervezésre kerültek, és nagyobbak lettek, mint korábban. Az alváz anyagai és a portok egyébként változatlanok, az első benyomások és a méretek hasonlóak.
SD kártyaolvasó
| SD Card Reader | |
| average JPG Copy Test (av. of 3 runs) | |
| Asus VivoBook Pro 16 K6602VU (Angelbird AV Pro V60) | |
| Samsung Galaxy Book4 Ultra (Angelbird AV Pro V60) | |
| Lenovo Legion 5 16IRX G9 | |
| Dell Inspiron 16 Plus 7620 (Toshiba Exceria Pro SDXC 64 GB UHS-II) | |
| Dell Inspiron 16 Plus 7640 (Angelbird AV Pro V60) | |
| Dell Inspiron 16 Plus 7630 (AV Pro SD microSD 128 GB V60) | |
| maximum AS SSD Seq Read Test (1GB) | |
| Asus VivoBook Pro 16 K6602VU (Angelbird AV Pro V60) | |
| Samsung Galaxy Book4 Ultra (Angelbird AV Pro V60) | |
| Lenovo Legion 5 16IRX G9 | |
| Dell Inspiron 16 Plus 7640 (Angelbird AV Pro V60) | |
| Dell Inspiron 16 Plus 7620 (Toshiba Exceria Pro SDXC 64 GB UHS-II) | |
| Dell Inspiron 16 Plus 7630 (AV Pro SD microSD 128 GB V60) | |
Kommunikáció
| Networking | |
| iperf3 transmit AXE11000 | |
| Samsung Galaxy Book4 Ultra | |
| Asus VivoBook Pro 16 K6602VU | |
| Lenovo Legion 5 16IRX G9 | |
| Dell Inspiron 16 Plus 7630 | |
| Dell Inspiron 16 Plus 7640 | |
| iperf3 receive AXE11000 | |
| Samsung Galaxy Book4 Ultra | |
| Asus VivoBook Pro 16 K6602VU | |
| Lenovo Legion 5 16IRX G9 | |
| Dell Inspiron 16 Plus 7630 | |
| Dell Inspiron 16 Plus 7640 | |
| iperf3 transmit AXE11000 6GHz | |
| Dell Inspiron 16 Plus 7630 | |
| Asus VivoBook Pro 16 K6602VU | |
| Dell Inspiron 16 Plus 7620 | |
| Dell Inspiron 16 Plus 7640 | |
| iperf3 receive AXE11000 6GHz | |
| Asus VivoBook Pro 16 K6602VU | |
| Dell Inspiron 16 Plus 7630 | |
| Dell Inspiron 16 Plus 7620 | |
| Dell Inspiron 16 Plus 7640 | |
Webkamera
Webkamera minőségének leírása, tesztdiagram képek hozzáadása.


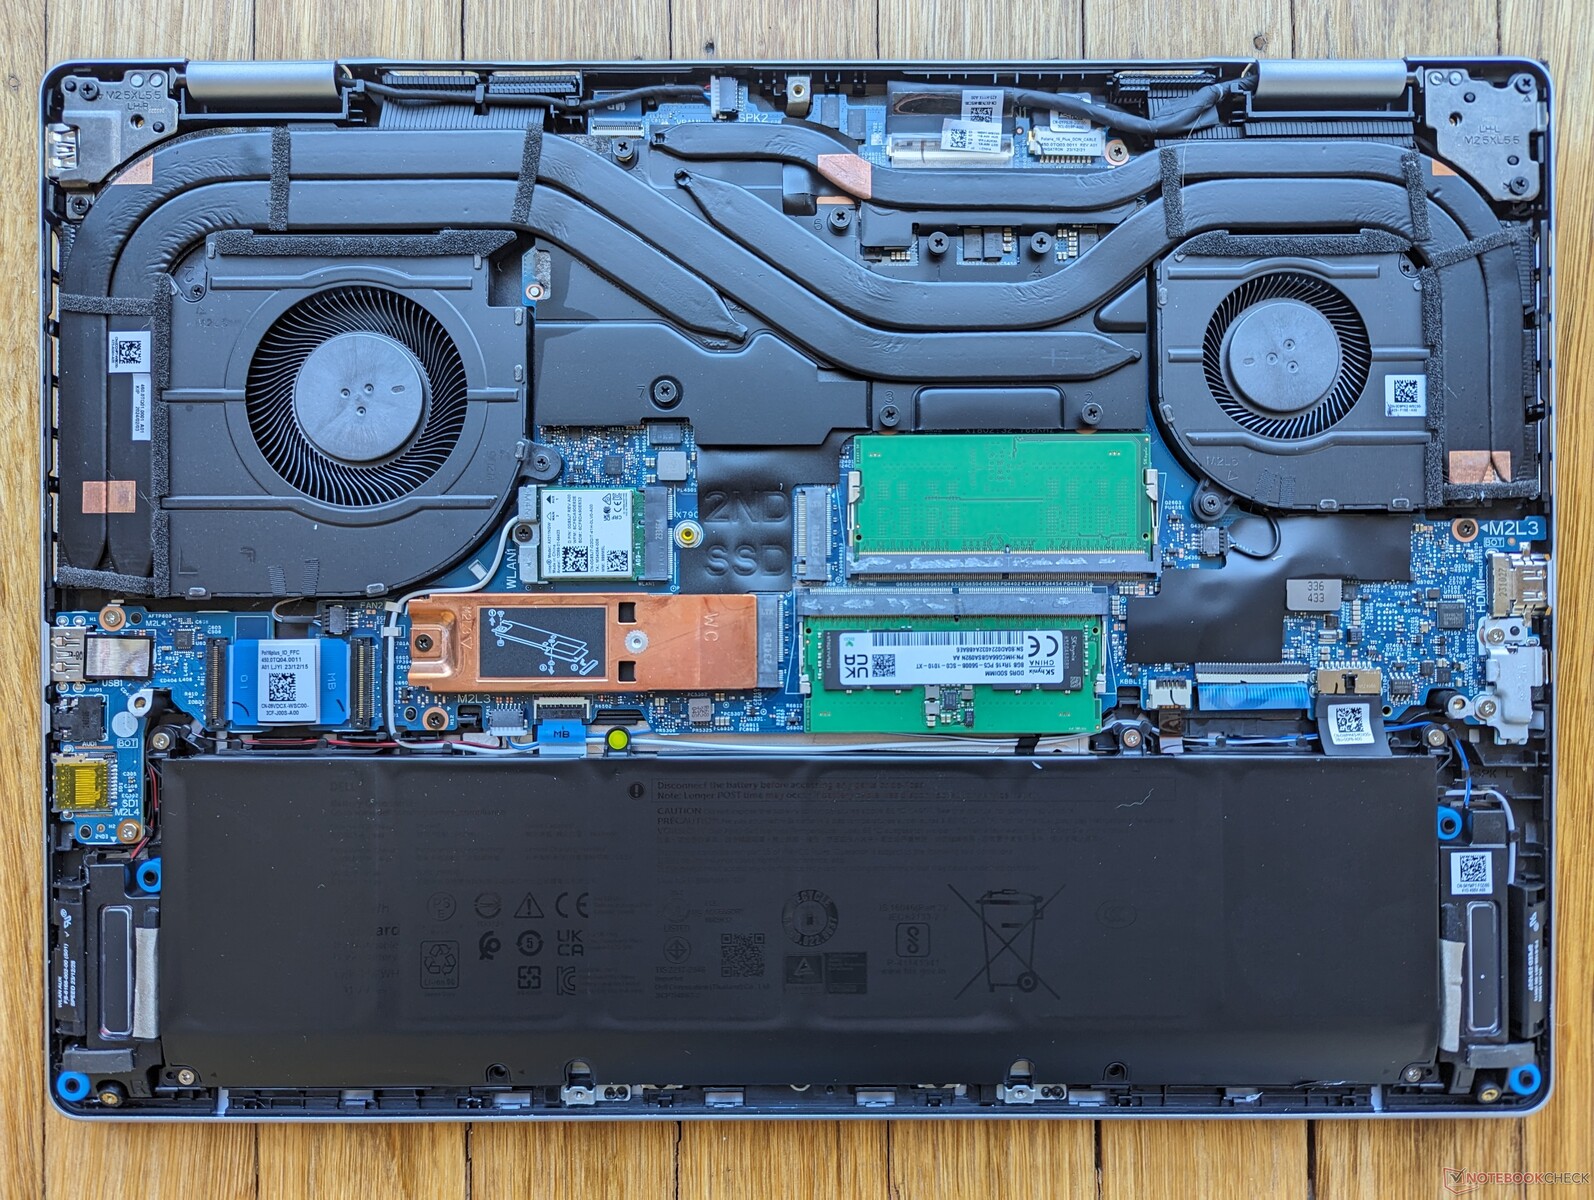
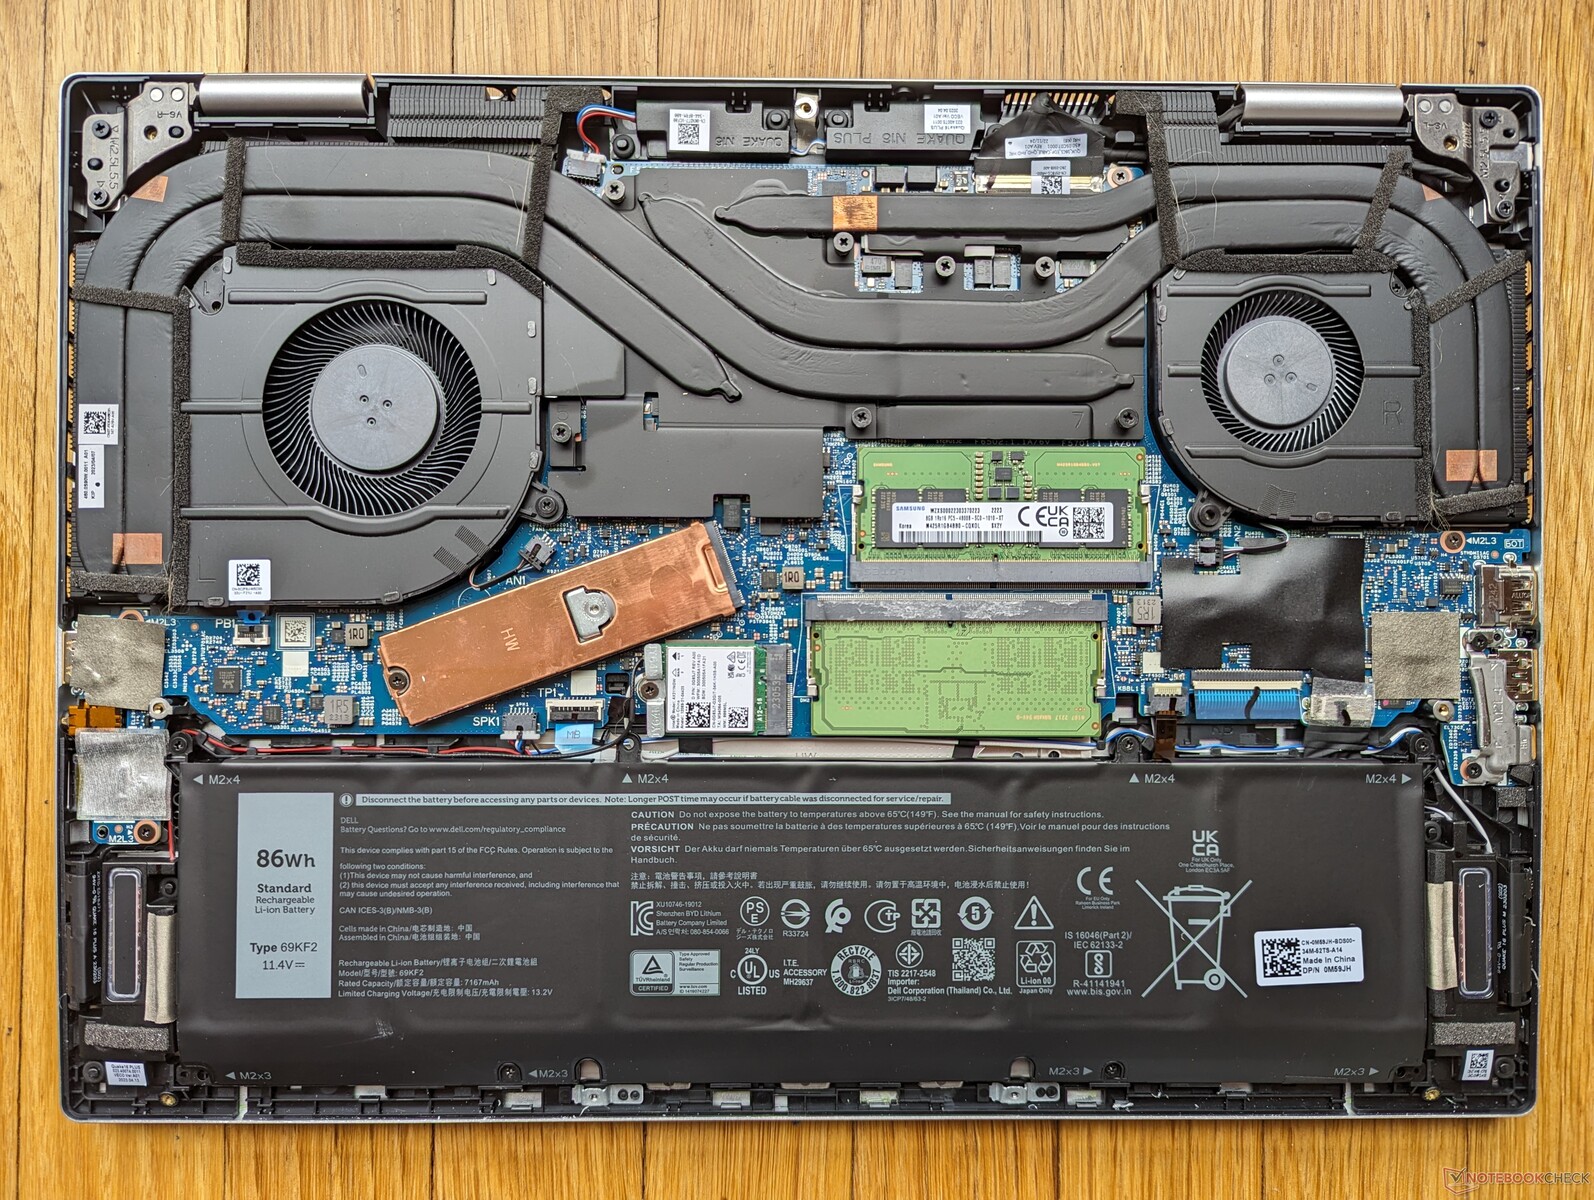
Karbantartás
A rendszer felnyitása egy jelentős különbséget mutat közvetlen elődjéhez képest: a másodlagos M.2 2230 SSD támogatását. Egyébként minden más nagyrészt azonosnak tűnik az Inspiron 16 Plus 7630-zal, ahogyan az alábbi képek is mutatják.
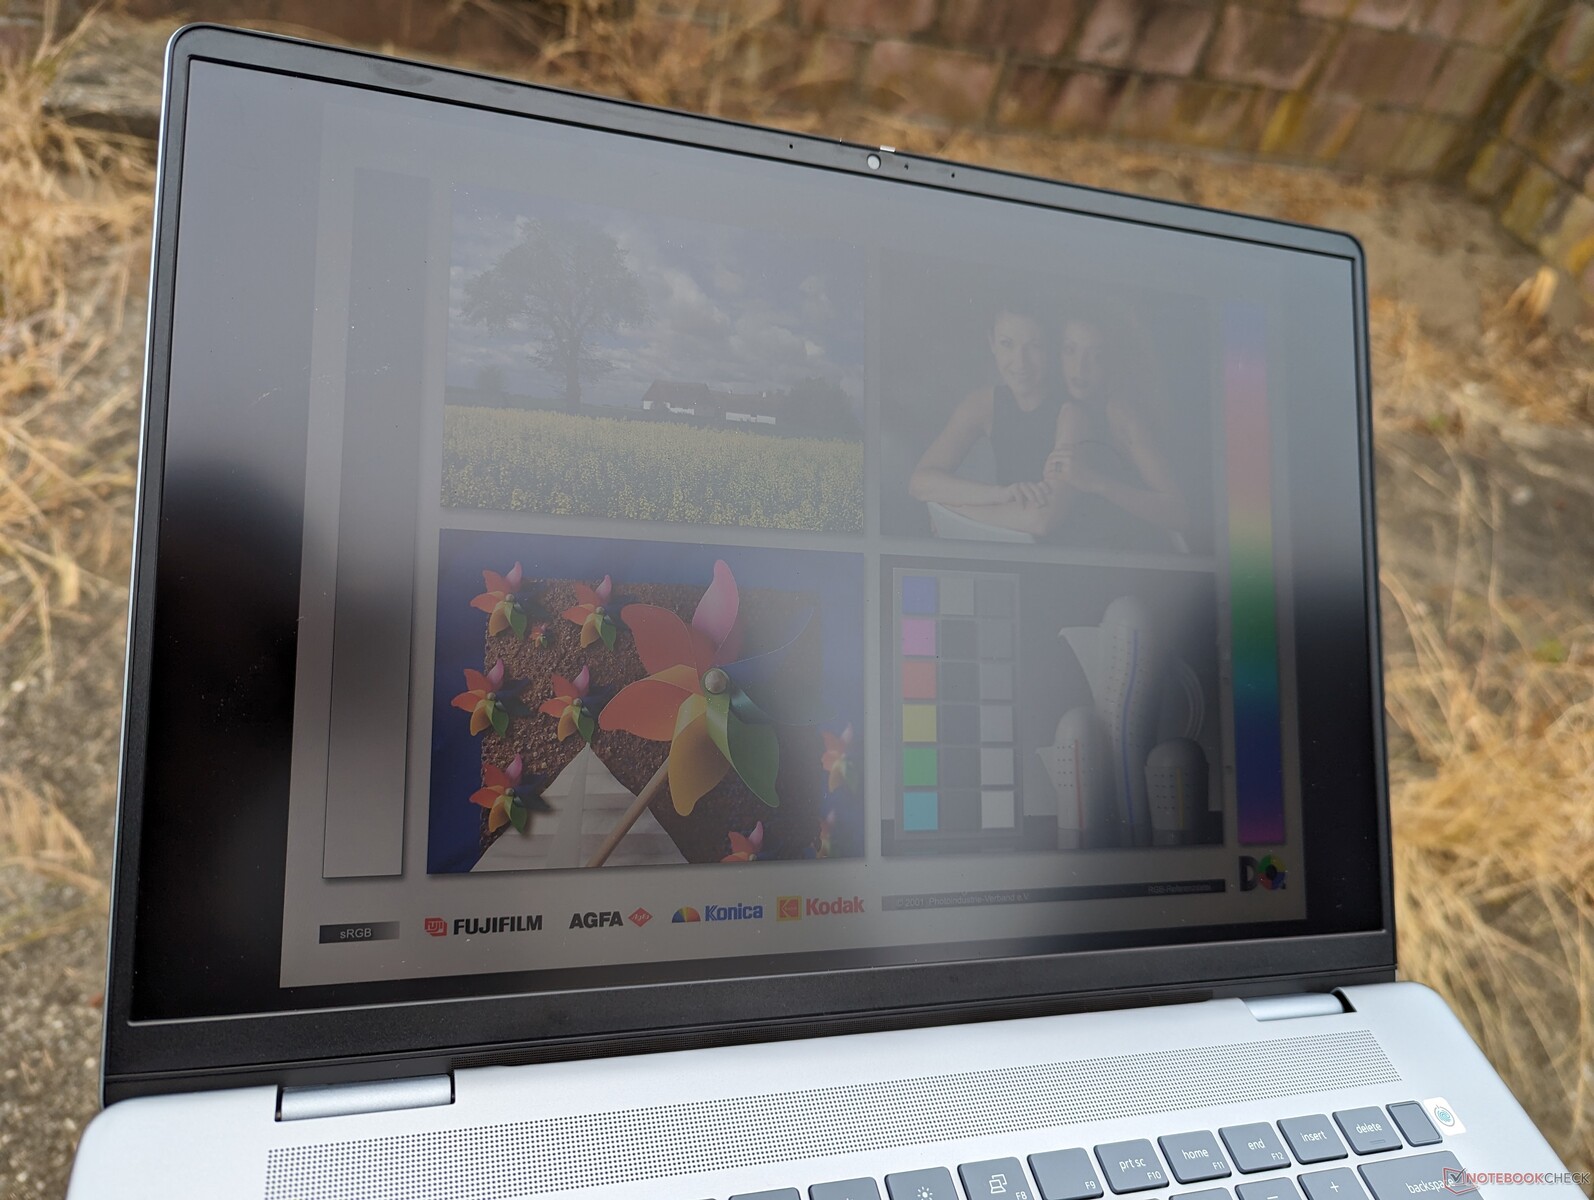
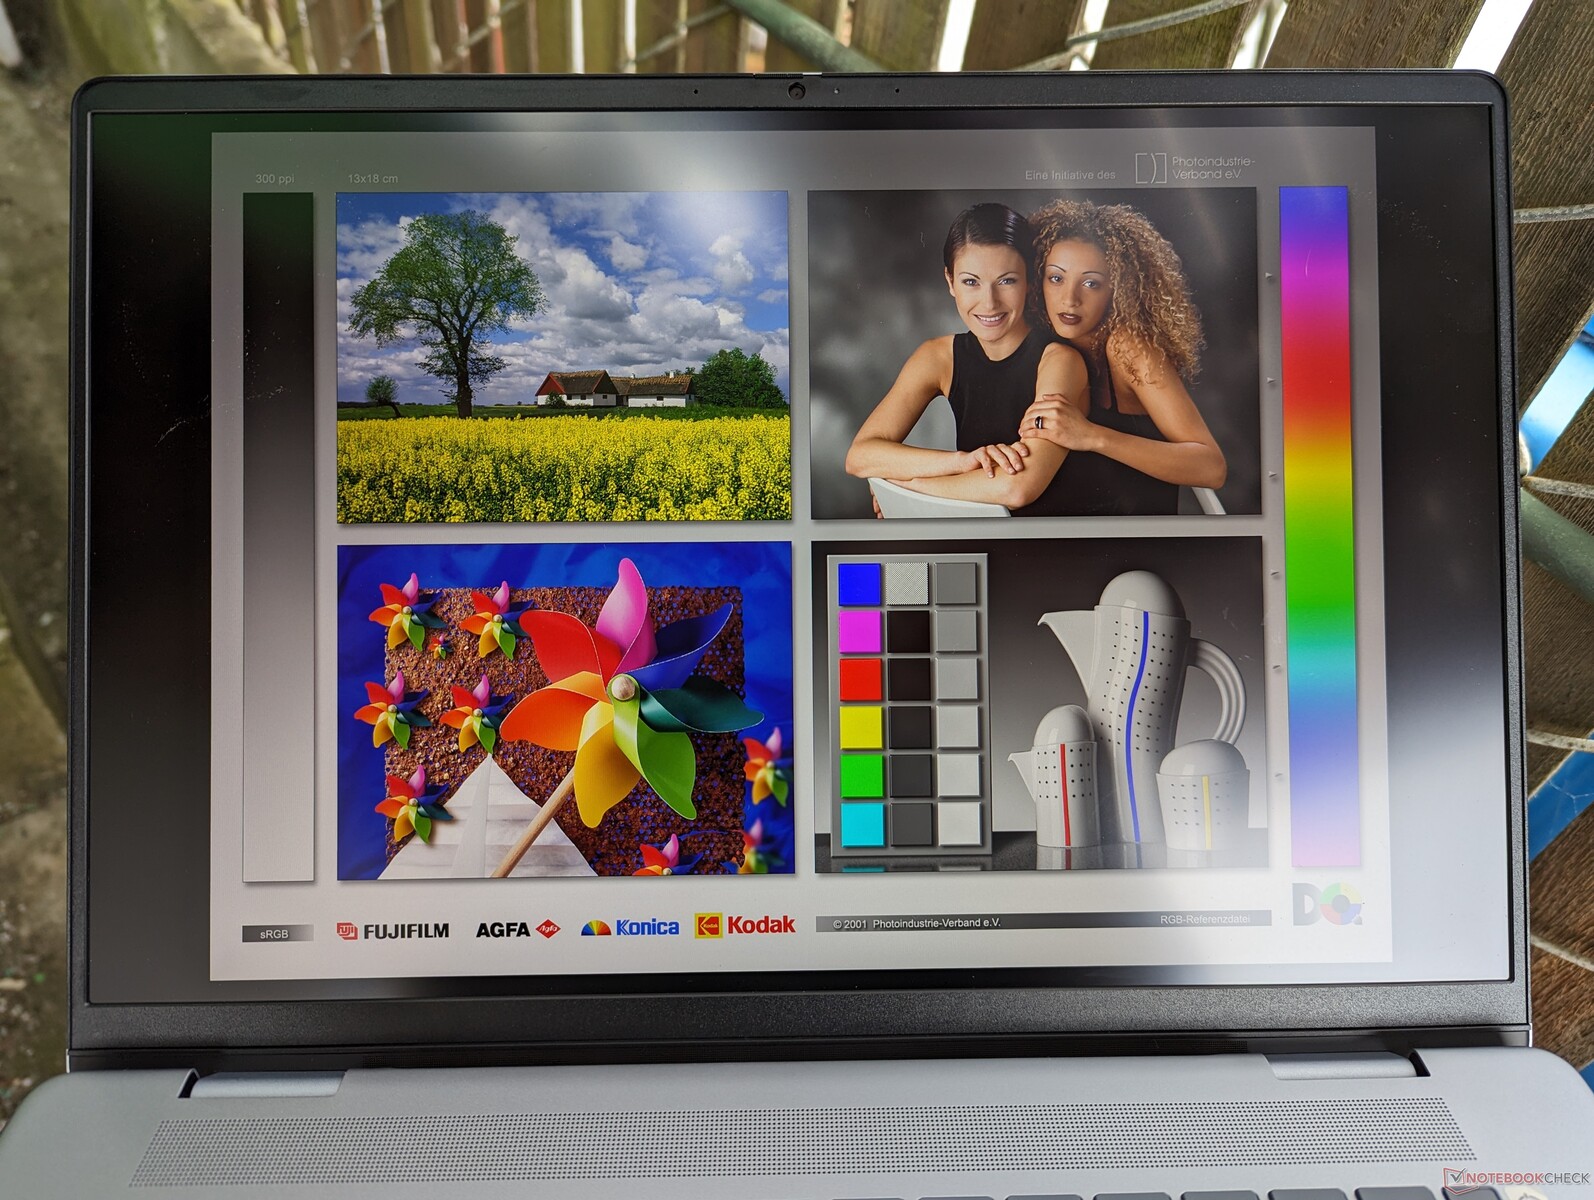
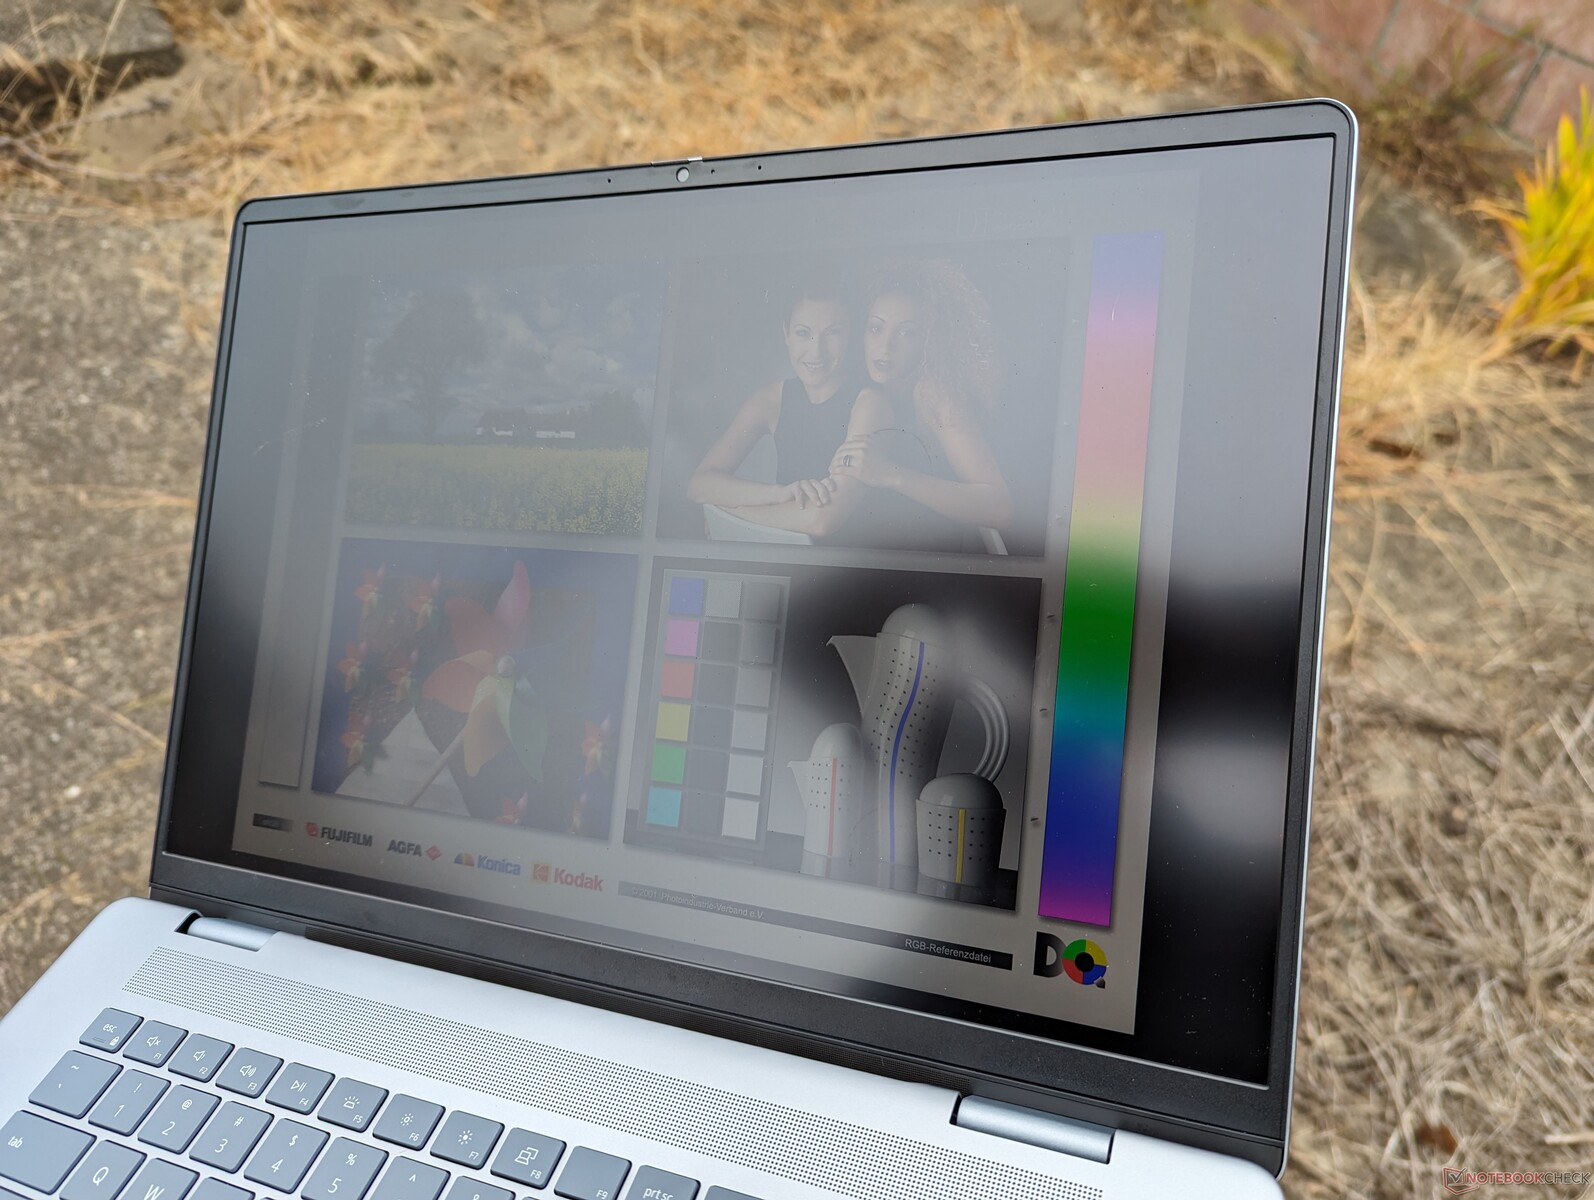
Kijelző - FHD+ és QHD+ opciók
Két megjelenítési lehetőség áll rendelkezésre az alábbiak szerint:
- 1920 x 1200, 60 Hz, érintőképernyő, fényes
- 2560 x 1600, 120 Hz, nem érintőképernyő, matt
A mi készülékünk a fenti, félkövérrel szedett panellel érkezik. Megjegyezzük, hogy a Dell hivatalos termékoldalán az 1600p panel esetében a 60 Hz-es frekvencia tévesen szerepel; megerősíthetjük, hogy ez a panel 120 Hz-es és 48 Hz-es natív frissítési frekvenciát támogat, G-Sync támogatás nélkül, hasonlóan a tavalyi Inspiron 16 Plus 7630-hoz.
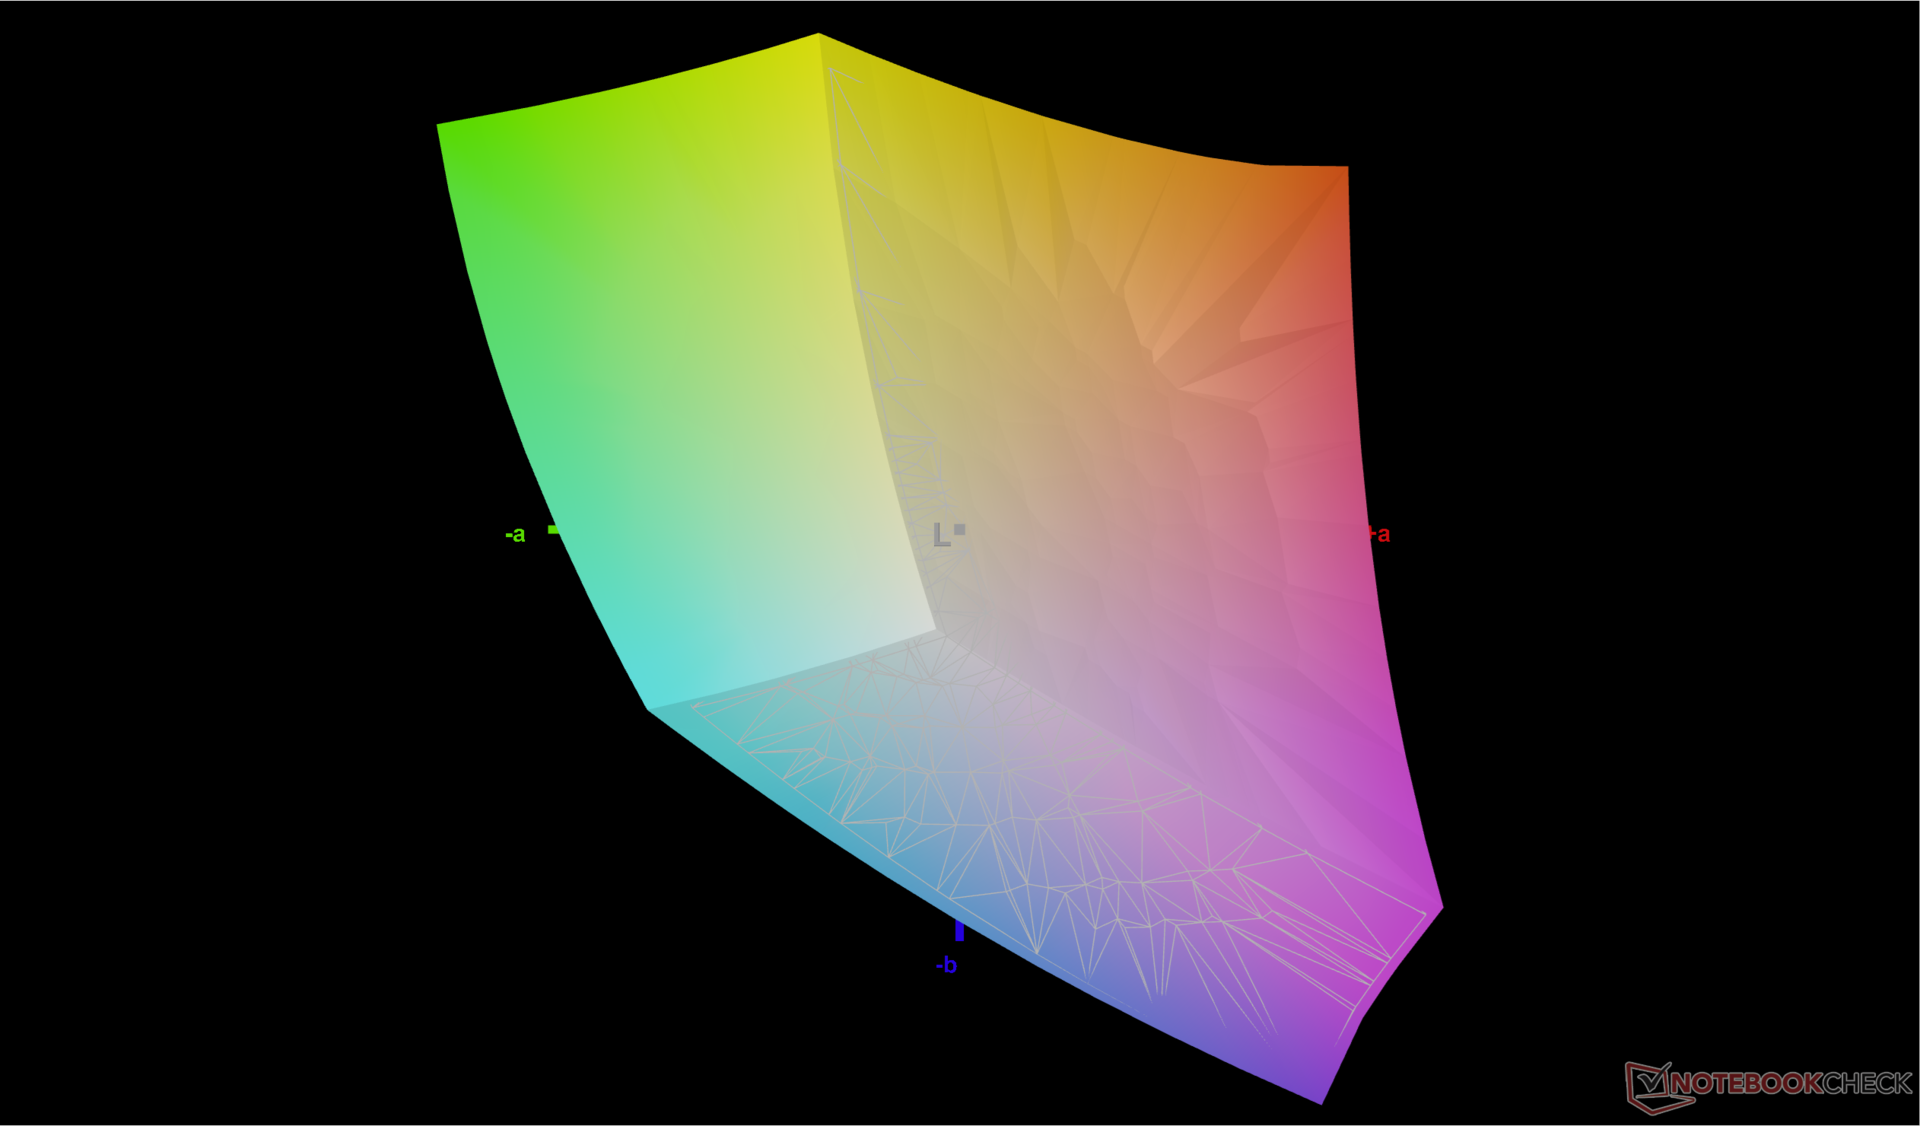
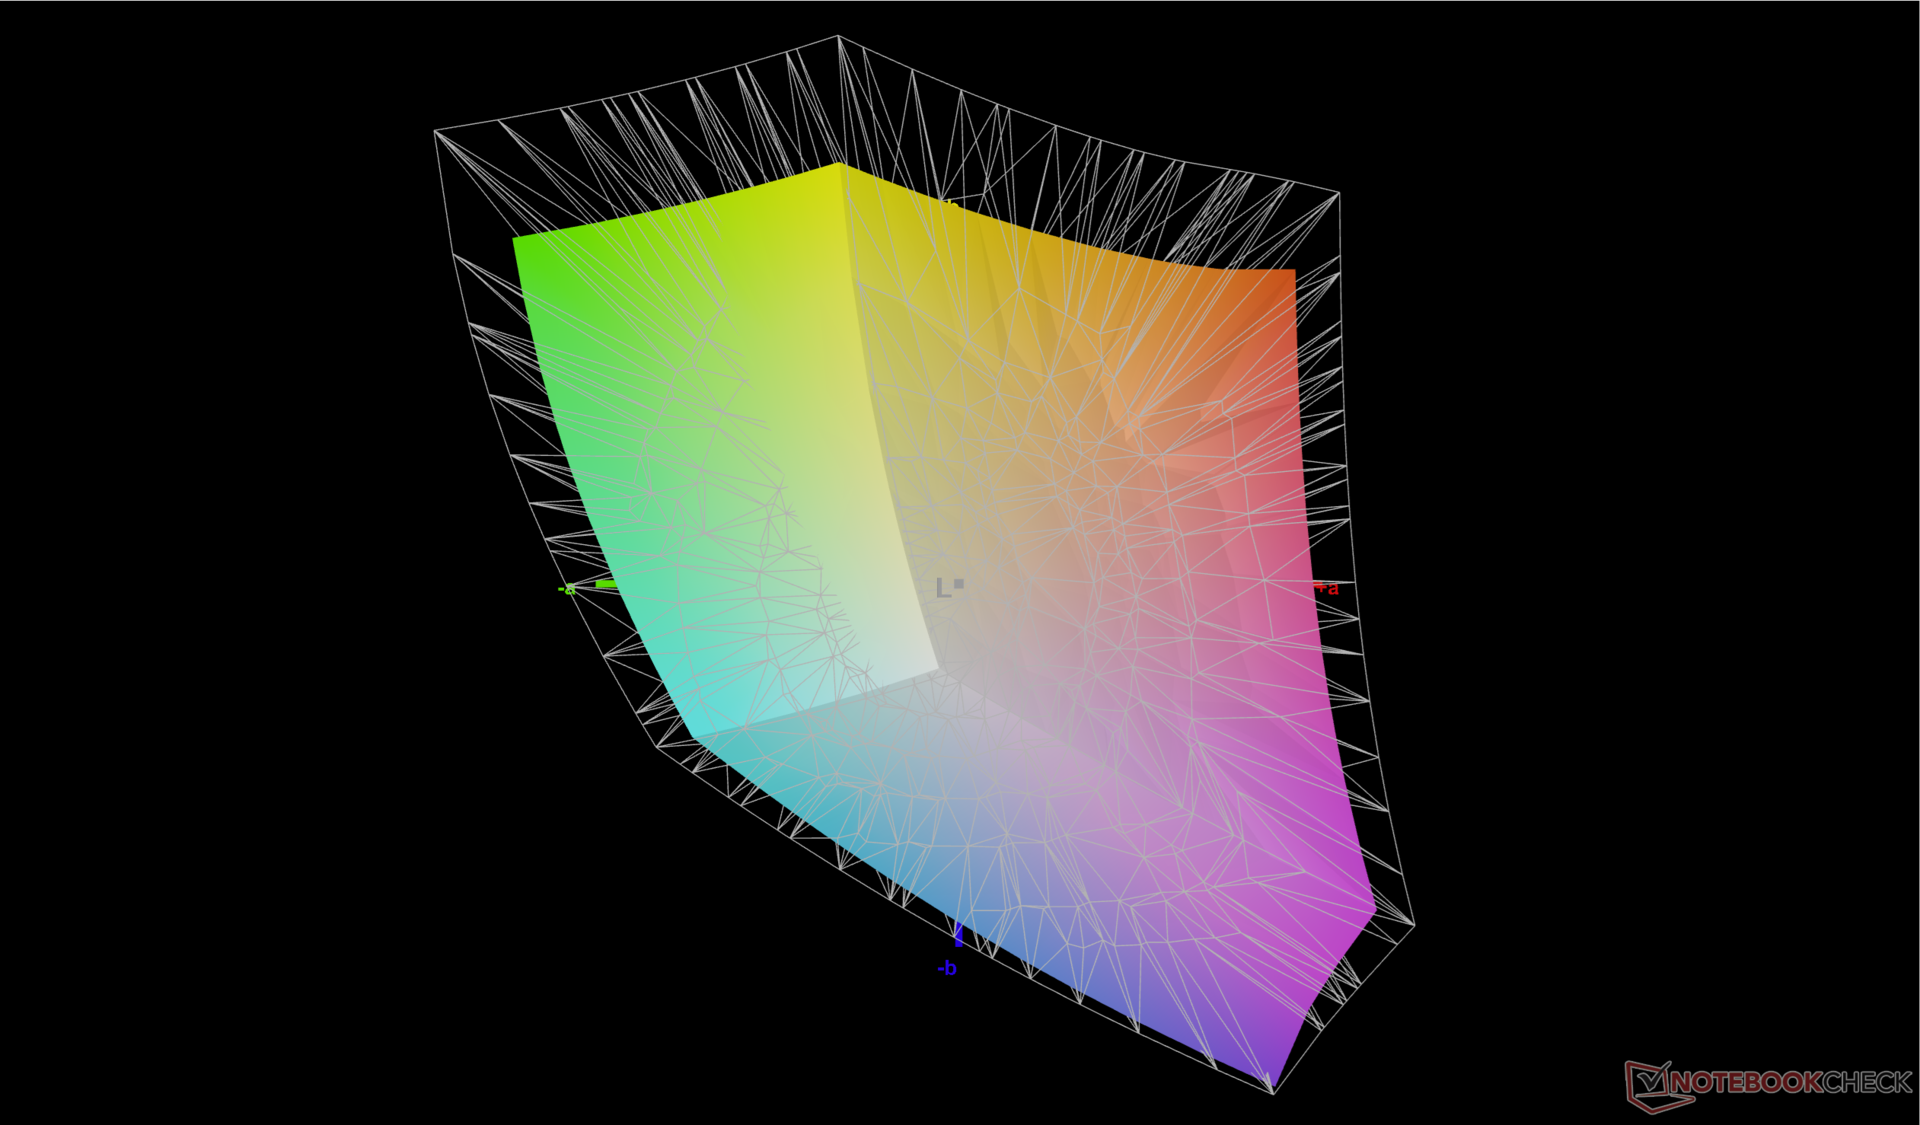
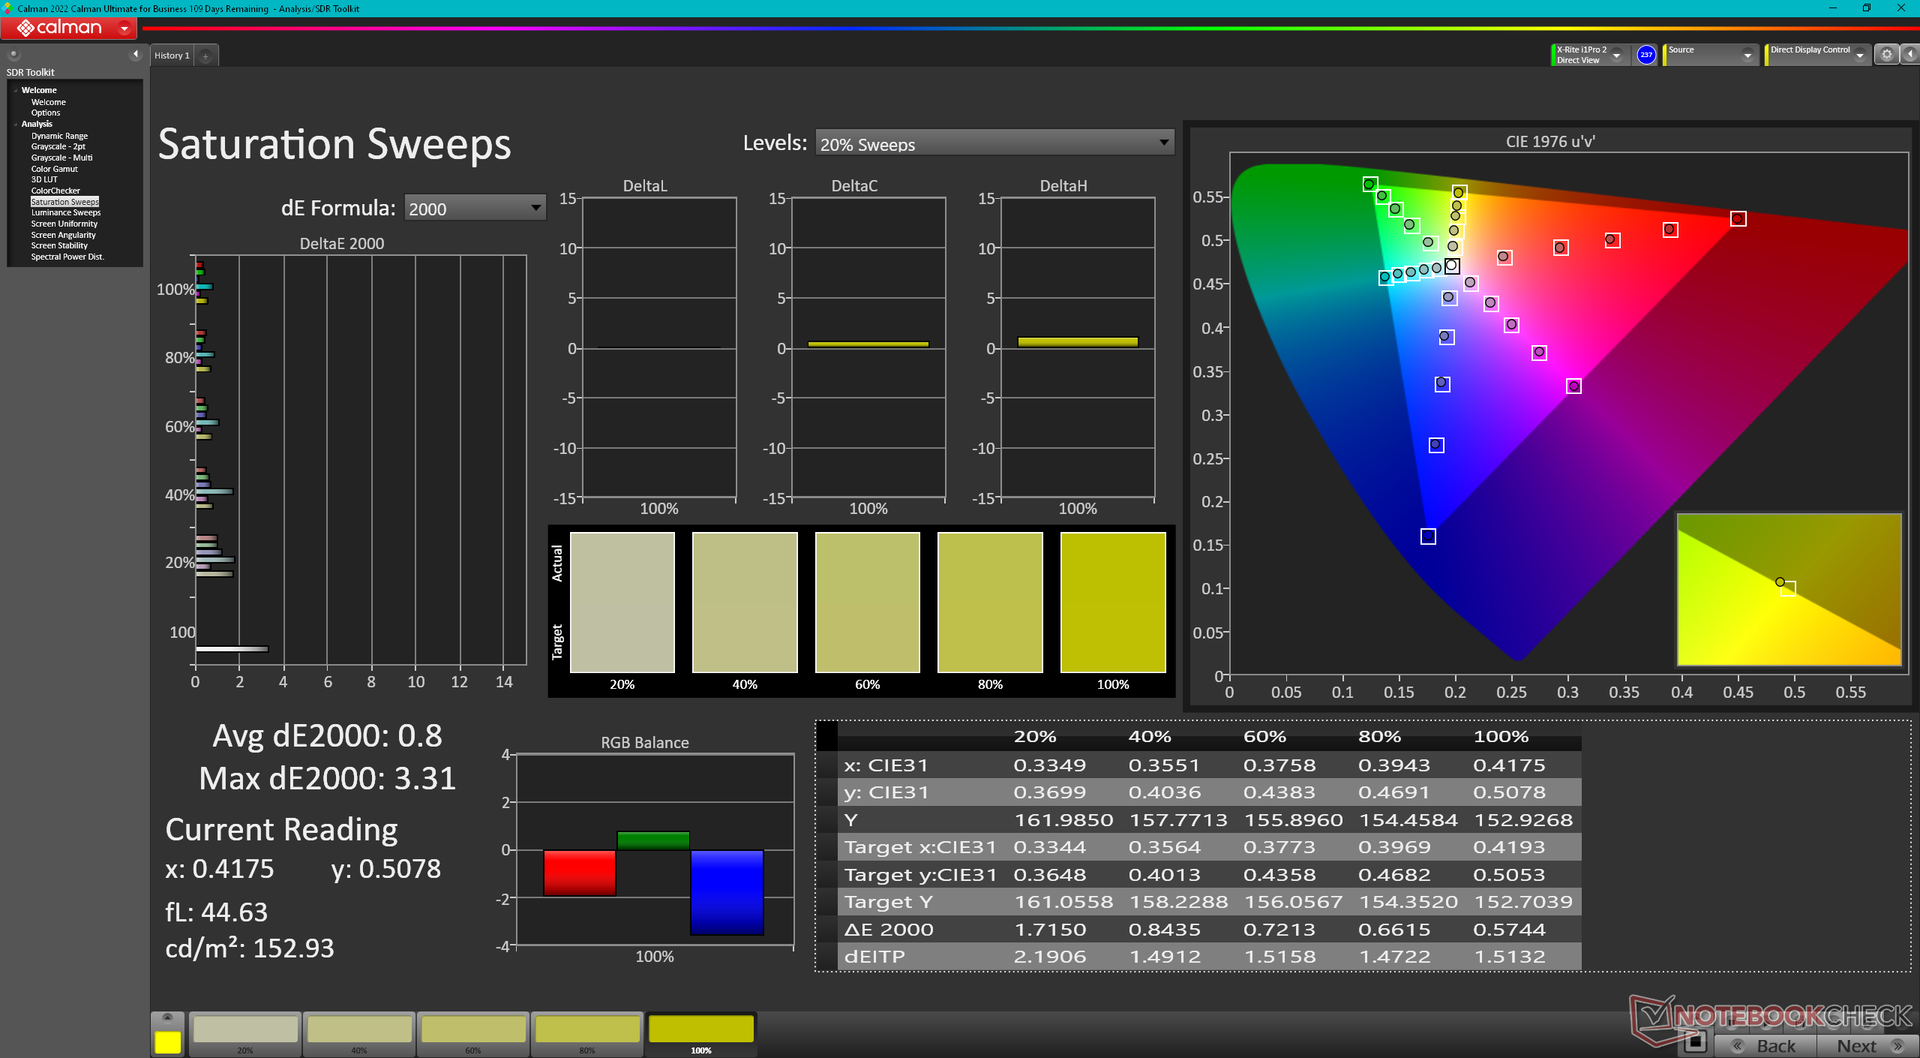
Érdekes módon a Dell az idei Inspiron 16 Plus 7640 esetében a panelszolgáltatókat az LG Philipsről az AU Optronicsra cserélte. Az újabb panel gyorsabb válaszidőt biztosít a szellemképek minimalizálása érdekében, miközben hasonló sRGB színeket, fényerőszinteket és kontrasztarányokat kínál, mint korábban.

| |||||||||||||||||||||||||
Fényerő megoszlás: 89 %
Centrumban: 314.7 cd/m²
Kontraszt: 1124:1 (Fekete: 0.28 cd/m²)
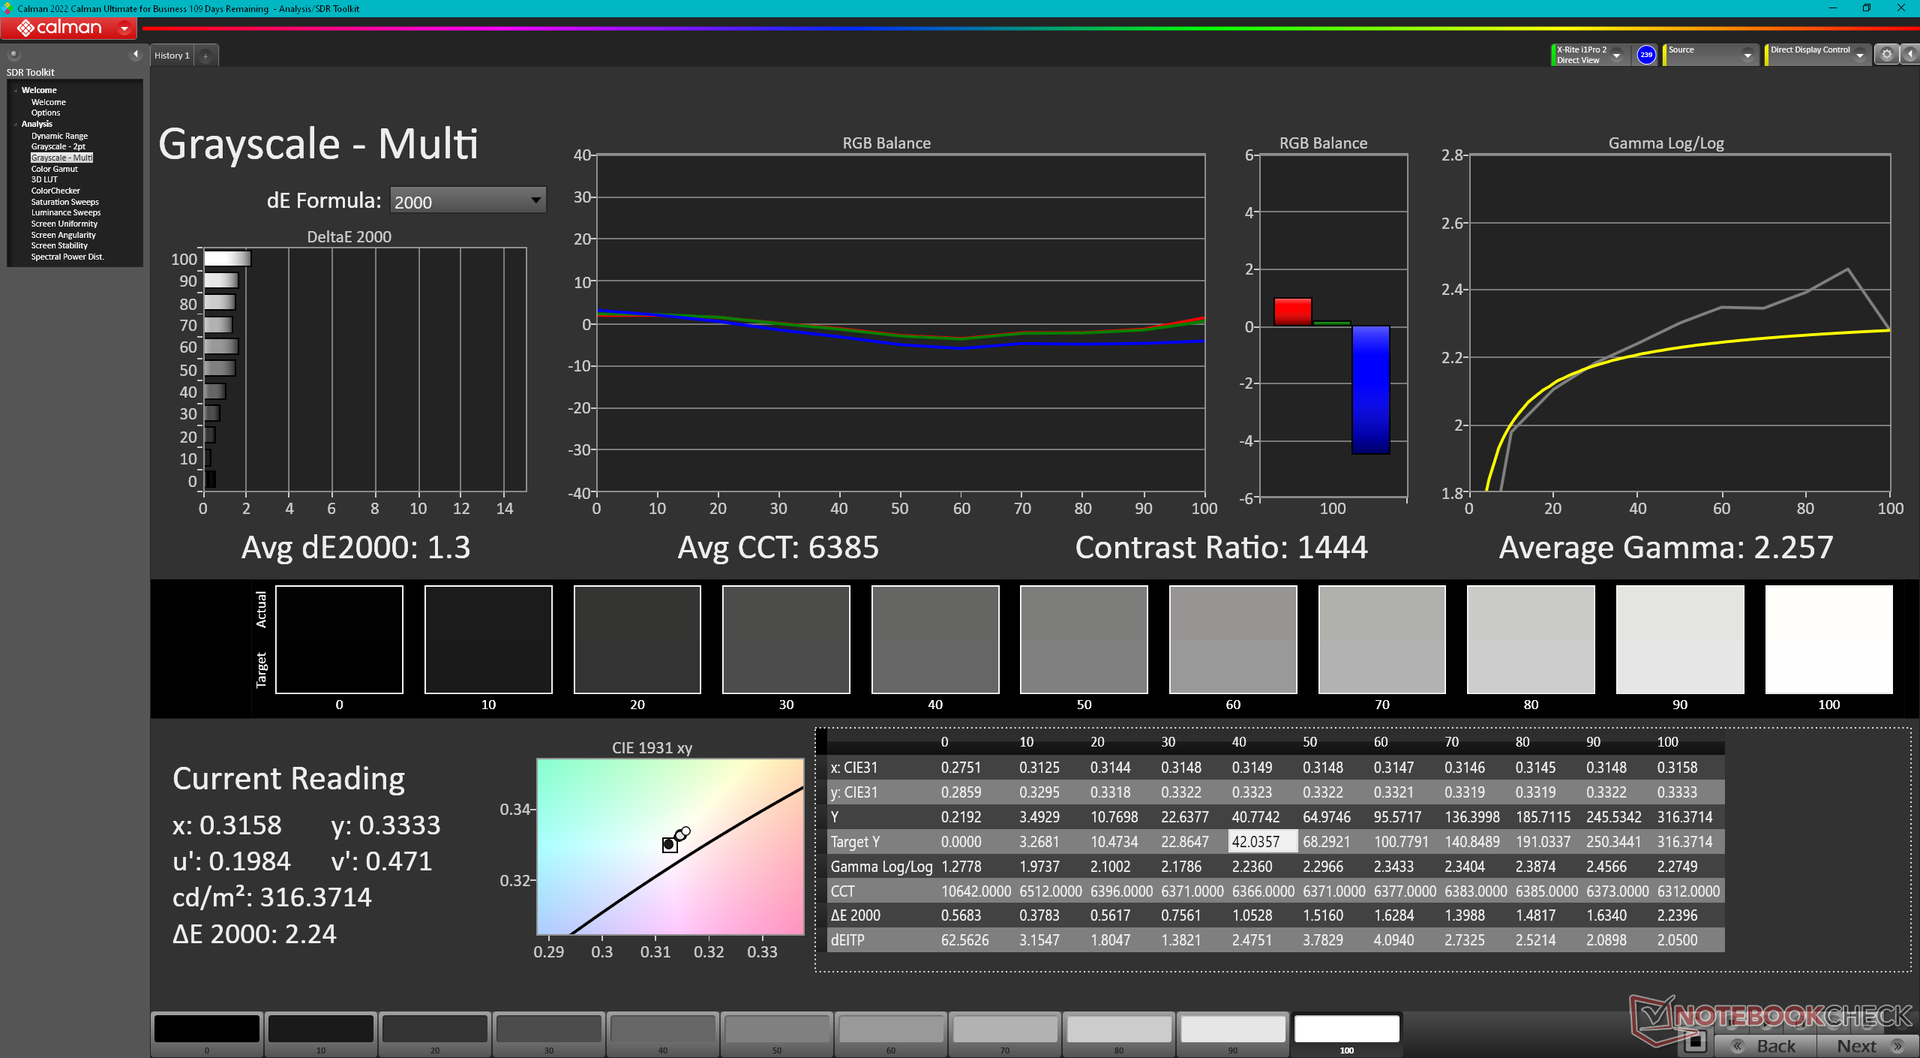
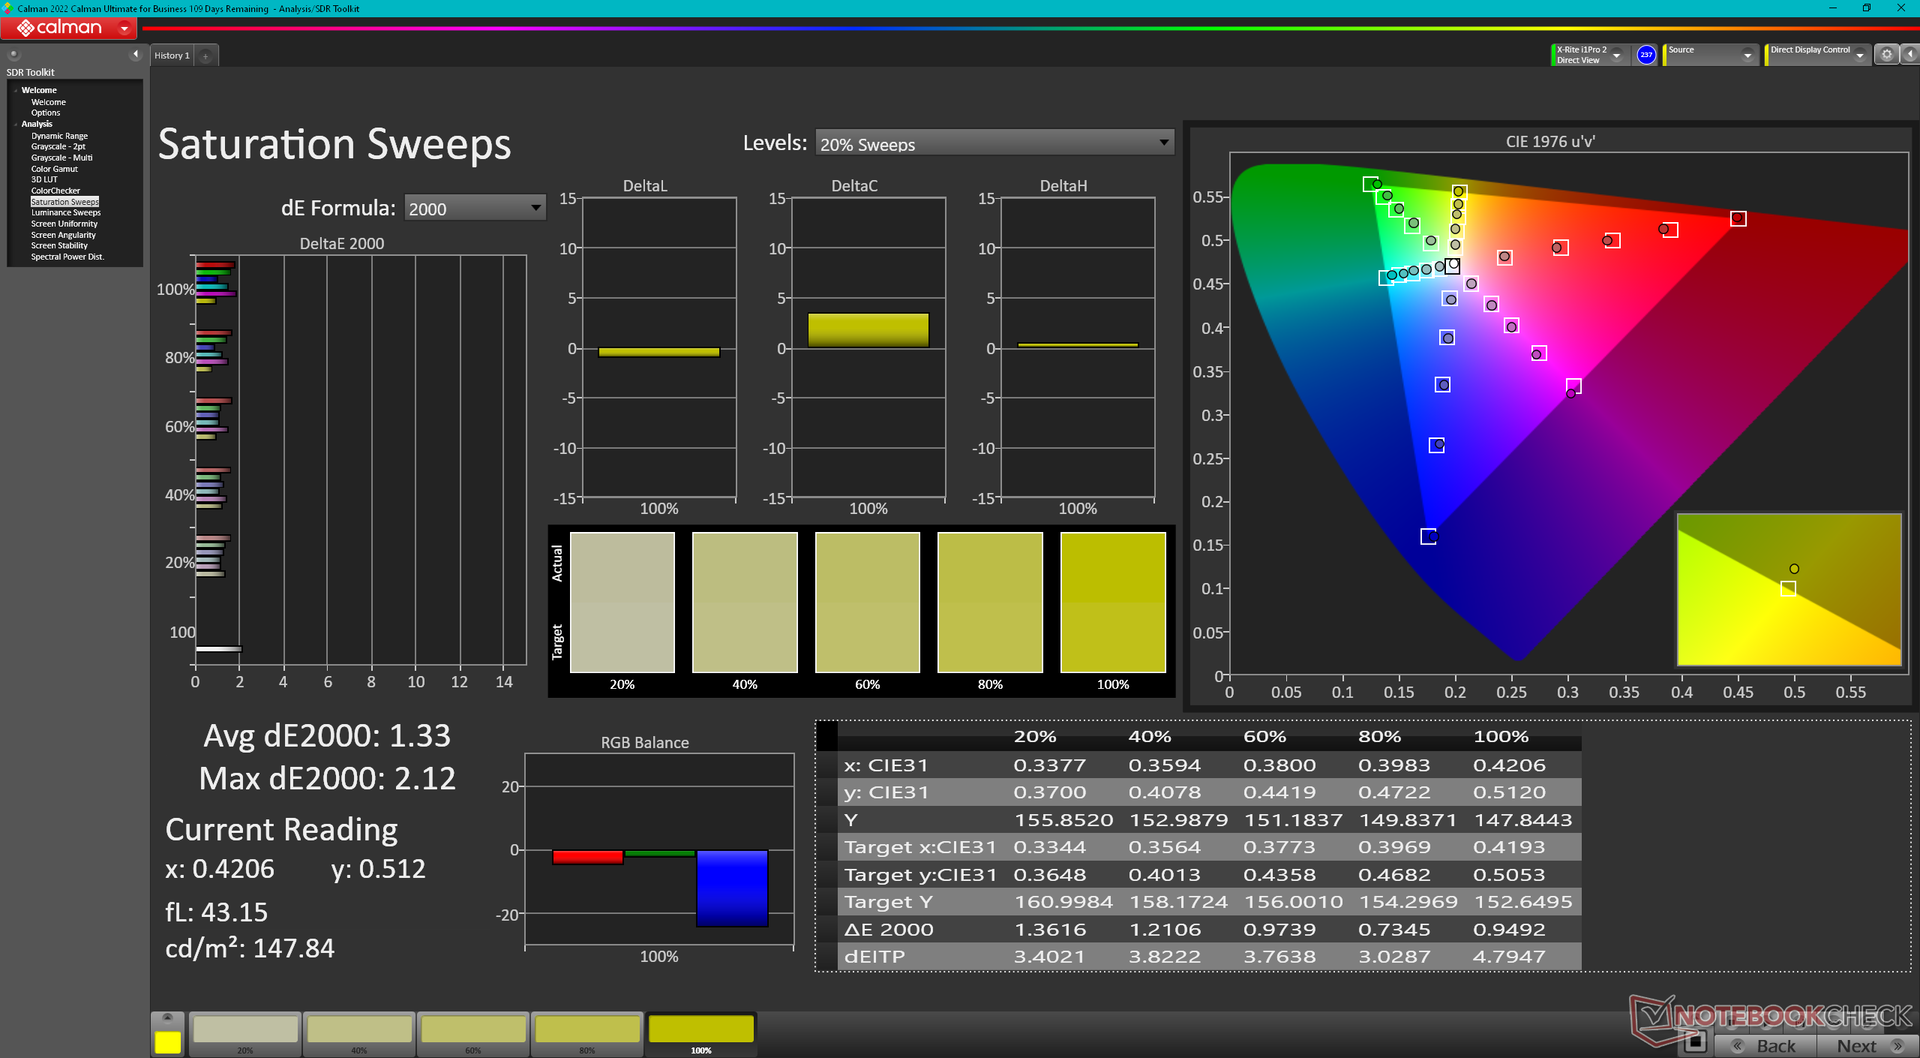
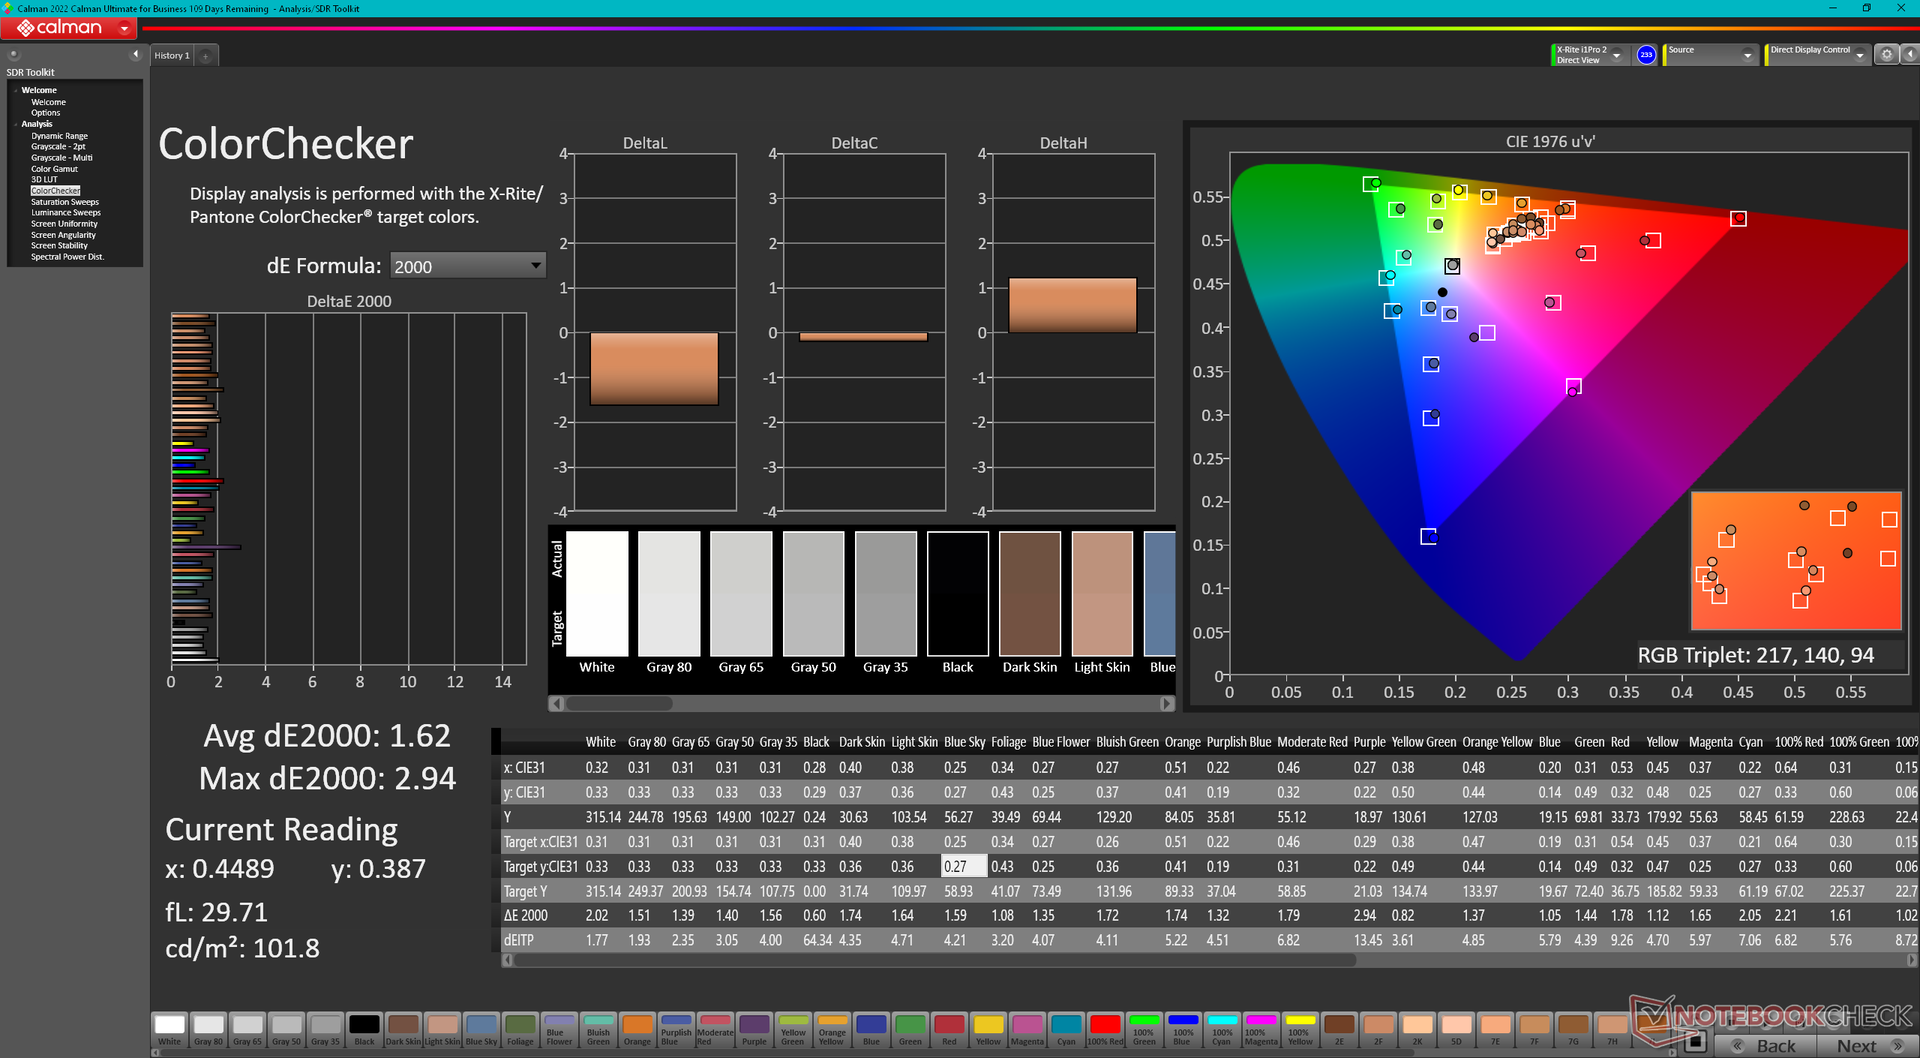
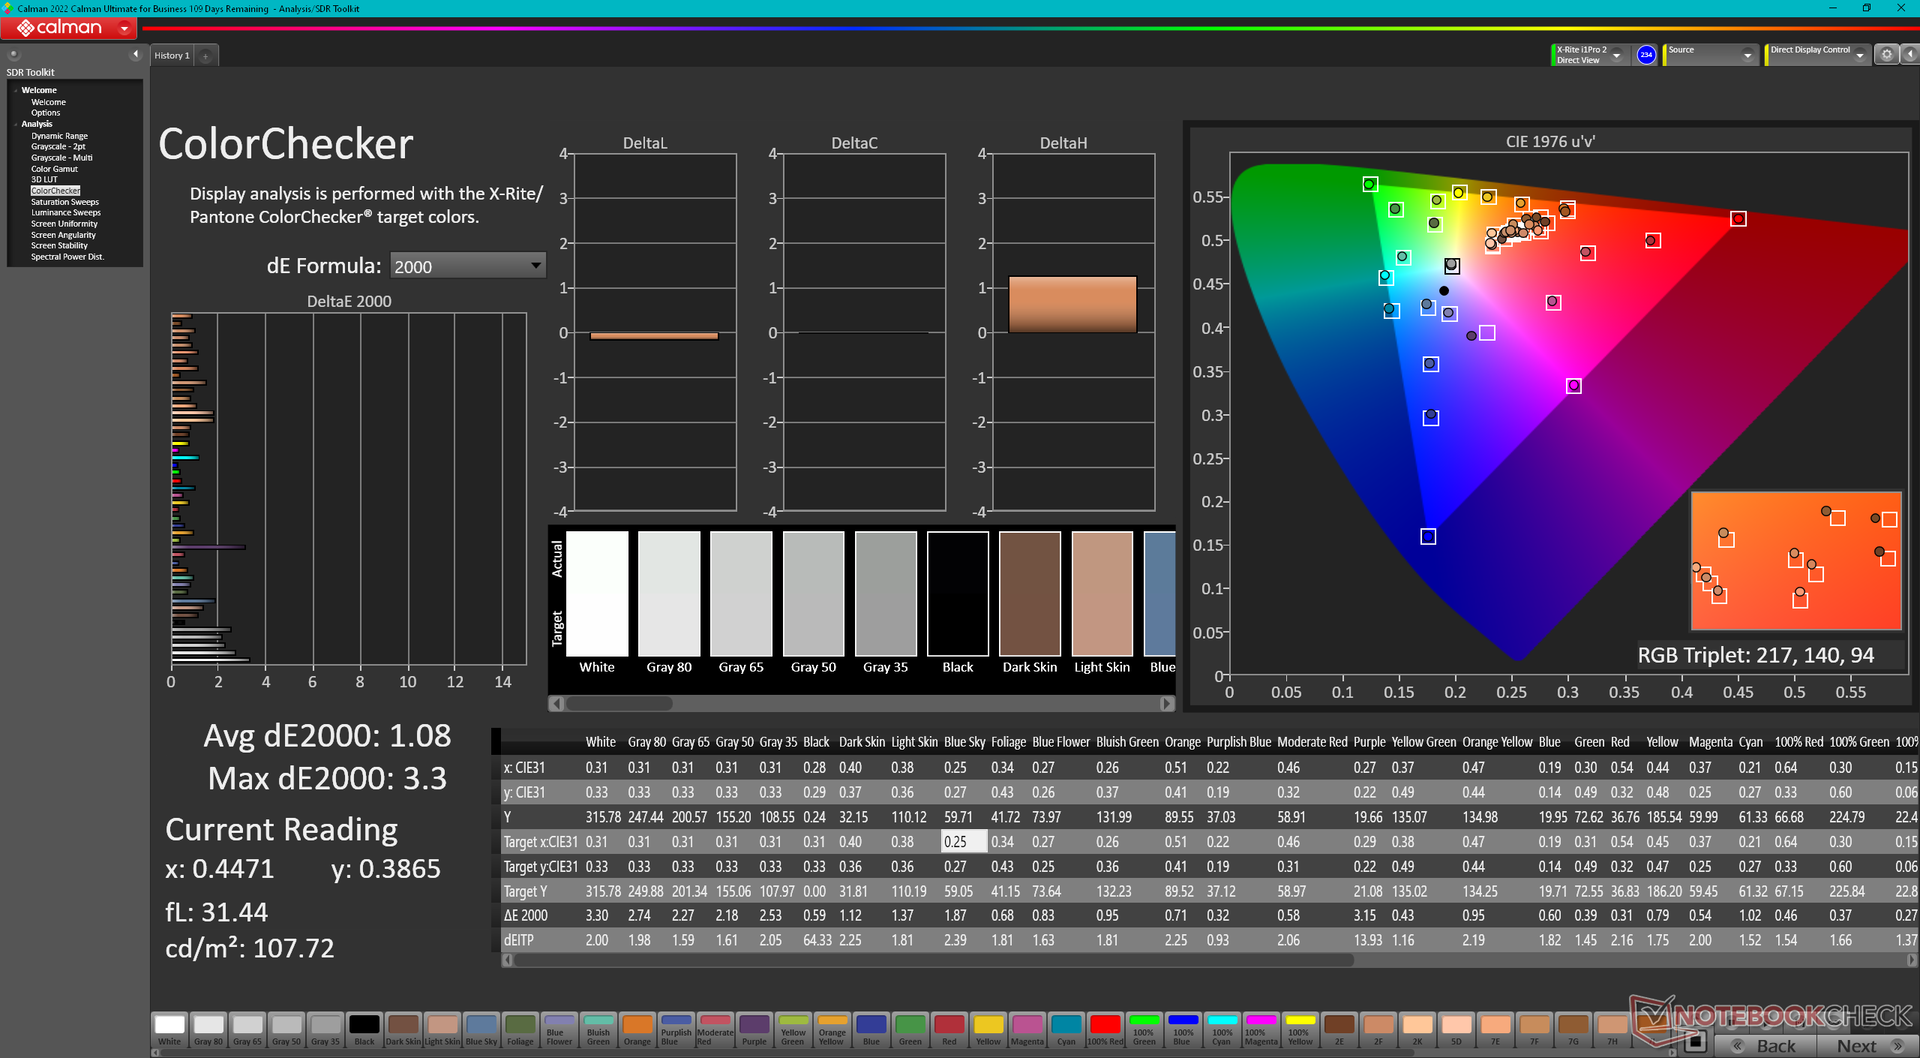
ΔE Color 1.62 | 0.5-29.43 Ø4.87, calibrated: 1.08
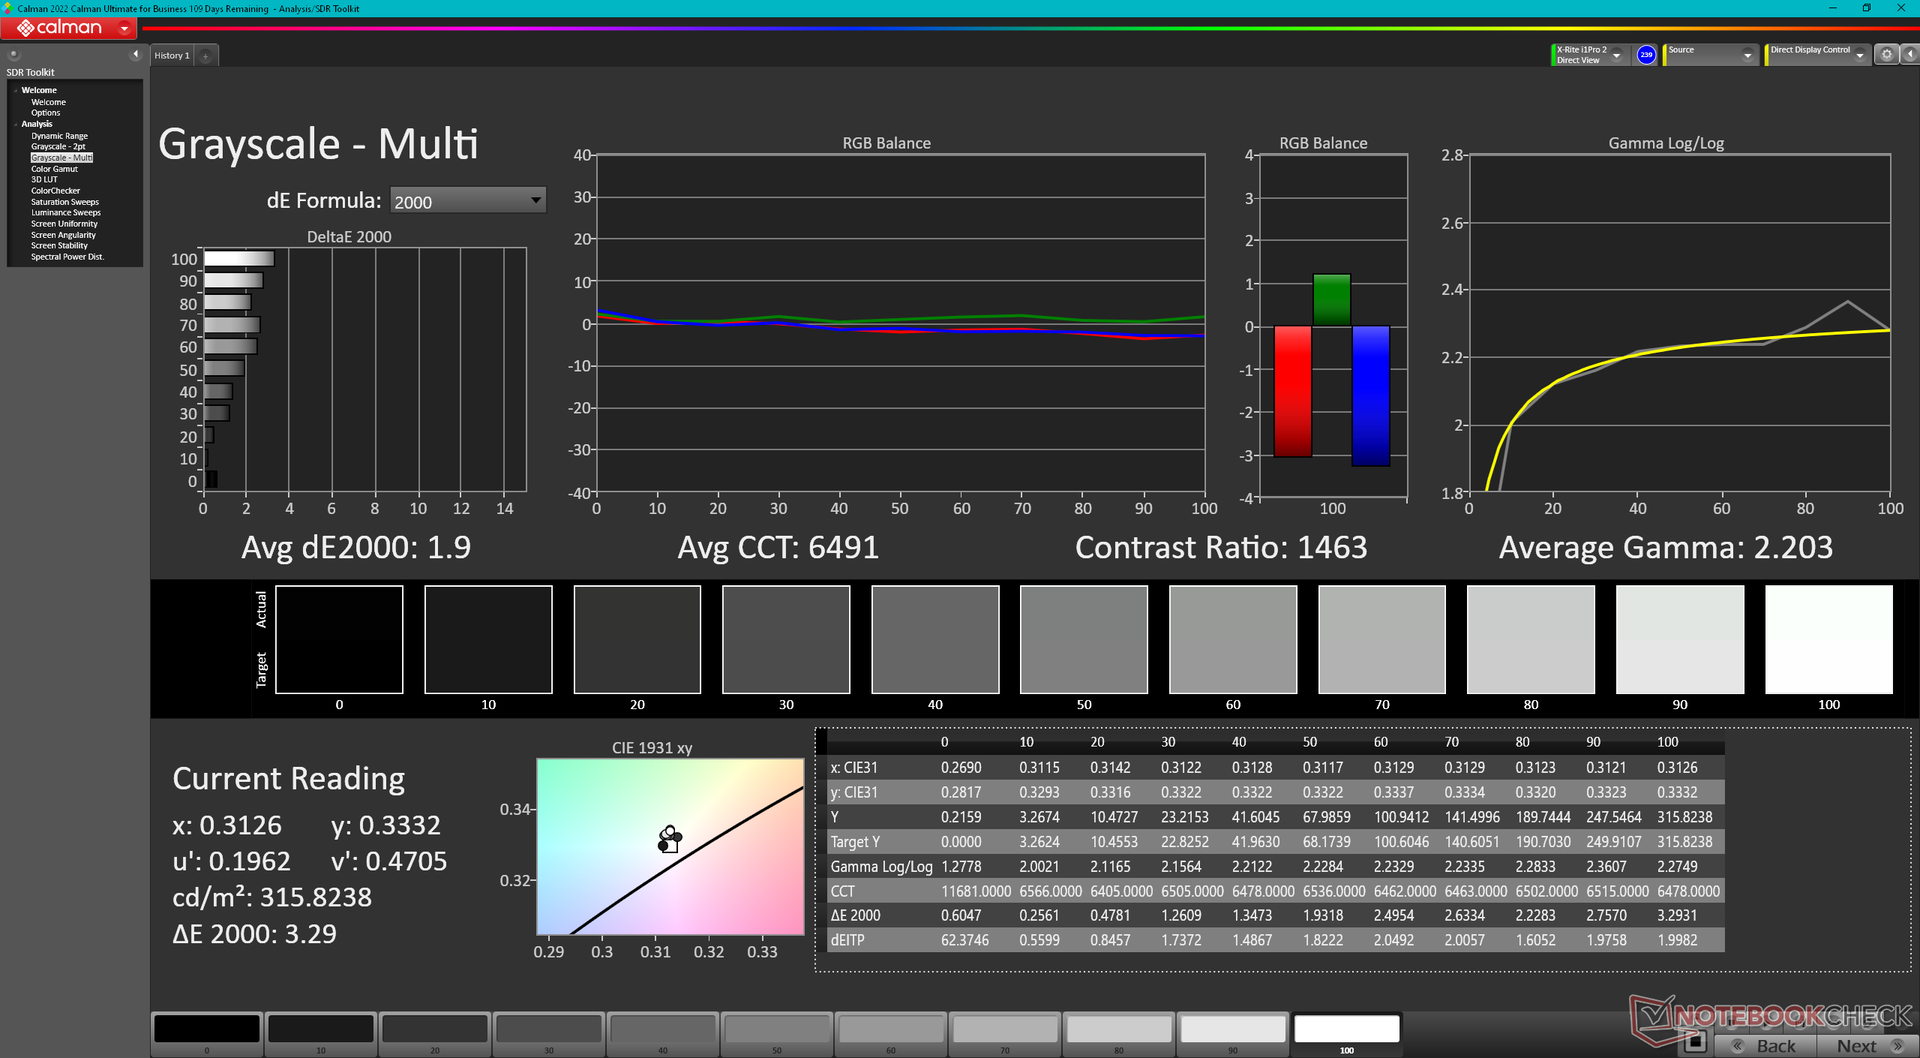
ΔE Greyscale 1.3 | 0.5-98 Ø5.1
76.7% AdobeRGB 1998 (Argyll 2.2.0 3D)
99.8% sRGB (Argyll 2.2.0 3D)
76% Display P3 (Argyll 2.2.0 3D)
Gamma: 2.26
| Dell Inspiron 16 Plus 7640 AU Optronics B160QAN, IPS, 2560x1600, 16" | Dell Inspiron 16 Plus 7630 LG Philips 160WQ2, IPS, 2560x1600, 16" | Dell Inspiron 16 Plus 7620 BOE NE16N41, IPS, 3072x1920, 16" | Samsung Galaxy Book4 Ultra ATNA60CL07-0, OLED, 2880x1800, 16" | Lenovo Legion 5 16IRX G9 NE160QDM-NZ3, IPS, 2560x1600, 16" | Asus VivoBook Pro 16 K6602VU Samsung ATNA60BX01-1, OLED, 3200x2000, 16" | |
|---|---|---|---|---|---|---|
| Display | -5% | -4% | 15% | -3% | 19% | |
| Display P3 Coverage | 76 | 70.1 -8% | 70.8 -7% | 98.6 30% | 72.4 -5% | 98.7 30% |
| sRGB Coverage | 99.8 | 99.6 0% | 99.5 0% | 99.9 0% | 100 0% | 99.7 0% |
| AdobeRGB 1998 Coverage | 76.7 | 72.3 -6% | 73.2 -5% | 88.5 15% | 74.1 -3% | 96.5 26% |
| Response Times | -38% | -54% | 97% | 51% | 61% | |
| Response Time Grey 50% / Grey 80% * | 25.6 ? | 35 ? -37% | 38 ? -48% | 0.54 ? 98% | 12.5 ? 51% | 0.68 ? 97% |
| Response Time Black / White * | 17.6 ? | 24.2 ? -38% | 28 ? -59% | 0.69 ? 96% | 8.7 ? 51% | 13.2 ? 25% |
| PWM Frequency | 240 ? | 240 ? | ||||
| Screen | -57% | -2% | 5% | 25% | -68% | |
| Brightness middle | 314.7 | 299.4 -5% | 288.9 -8% | 390 24% | 526 67% | 353 12% |
| Brightness | 291 | 290 0% | 276 -5% | 393 35% | 500 72% | 354 22% |
| Brightness Distribution | 89 | 92 3% | 92 3% | 98 10% | 87 -2% | 98 10% |
| Black Level * | 0.28 | 0.21 25% | 0.26 7% | 0.33 -18% | ||
| Contrast | 1124 | 1426 27% | 1111 -1% | 1594 42% | ||
| Colorchecker dE 2000 * | 1.62 | 4.25 -162% | 1.88 -16% | 1.4 14% | 1.2 26% | 4.23 -161% |
| Colorchecker dE 2000 max. * | 2.94 | 6.71 -128% | 4.37 -49% | 2.7 8% | 2.1 29% | 7.13 -143% |
| Colorchecker dE 2000 calibrated * | 1.08 | 0.52 52% | 0.42 61% | 1 7% | 2.42 -124% | |
| Greyscale dE 2000 * | 1.3 | 5.5 -323% | 1.4 -8% | 2.1 -62% | 1.3 -0% | 2.5 -92% |
| Gamma | 2.26 97% | 2.35 94% | 2.3 96% | 2.27 97% | 2.23 99% | 2.4 92% |
| CCT | 6385 102% | 6368 102% | 6634 98% | 6431 101% | 6391 102% | 6642 98% |
| Teljes átlag (program / beállítások) | -33% /
-43% | -20% /
-10% | 39% /
24% | 24% /
23% | 4% /
-25% |
* ... a kisebb jobb
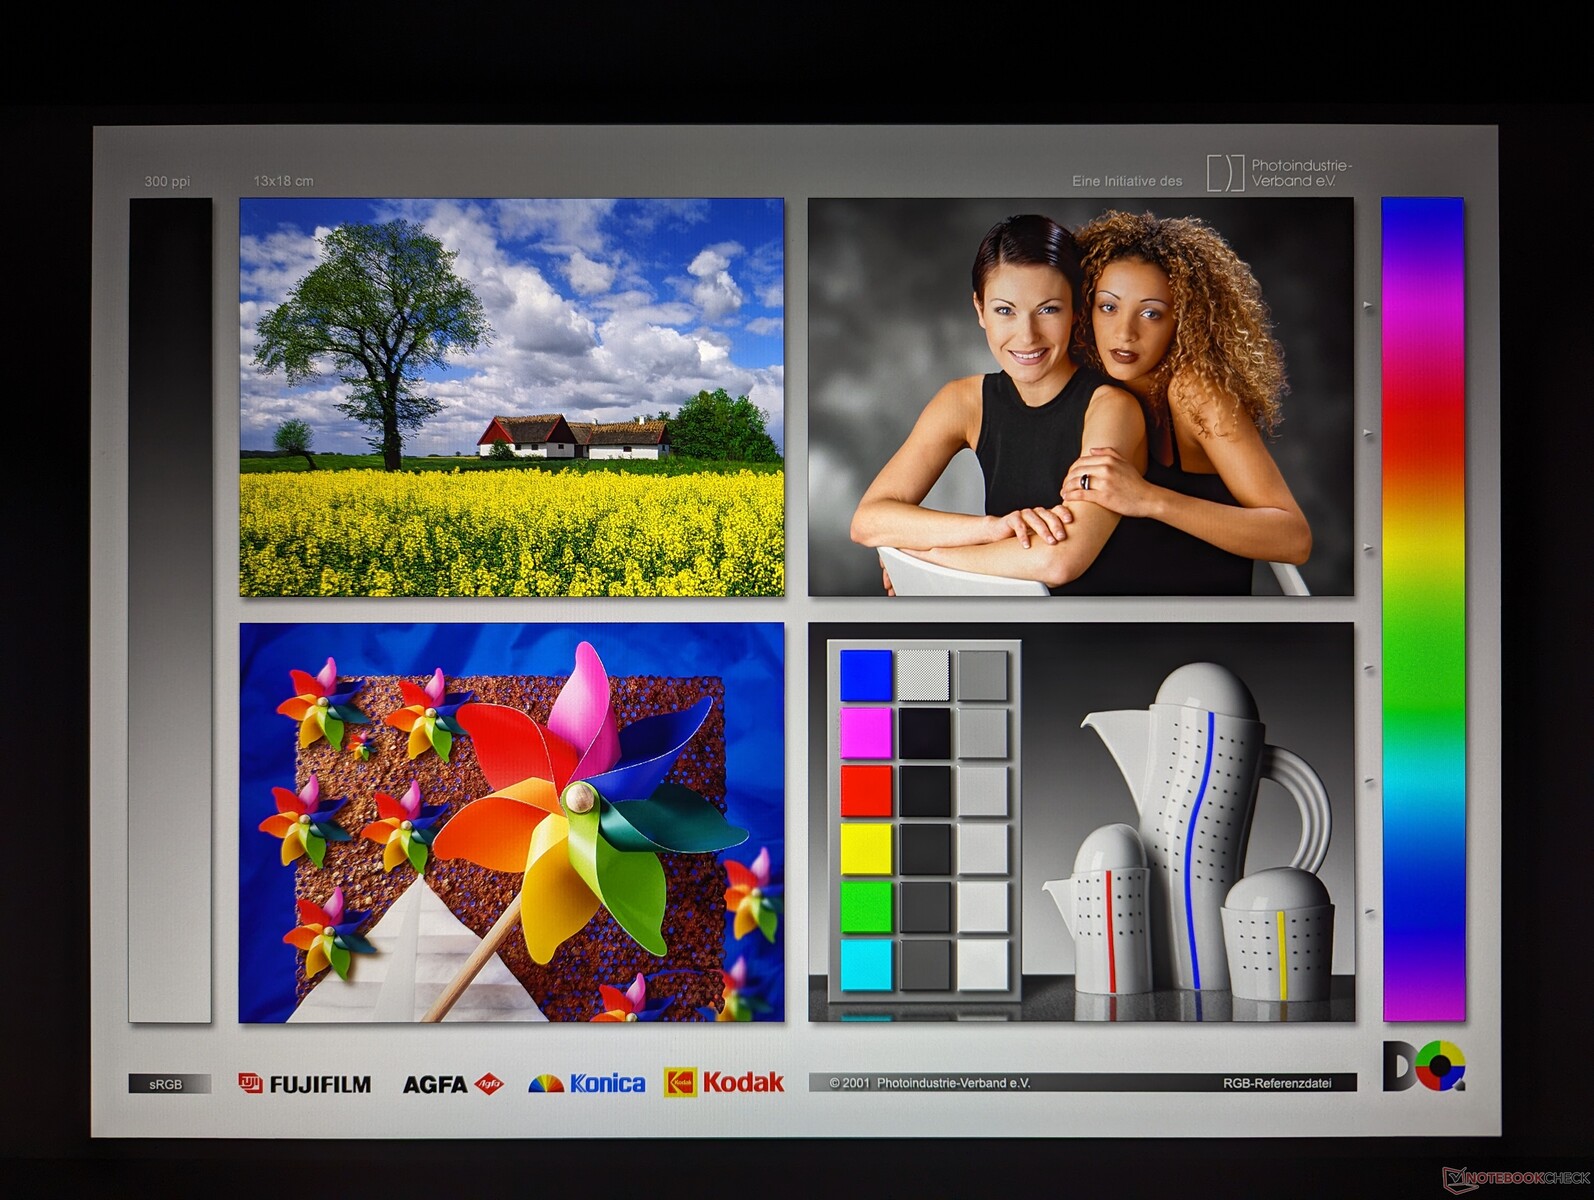
A kijelző már a dobozból jól kalibrált, ami meglepő, mivel az Inspiron sorozat jellemzően inkább költségvetés-barát, és kevésbé összpontosít a színhelyességre, mint a magasabb kategóriájú XPS sorozat. Ha mi magunk próbálnánk meg kalibrálni a panelt, az átlagos deltaE értékek csak kismértékű javulását eredményezné, ahogyan azt az alábbi képernyőképek is mutatják. A végfelhasználói kalibráció ezért a legtöbb felhasználó számára nem szükséges.
Megjelenítési válaszidők
| ↔ Válaszidő Fekete-fehér | ||
|---|---|---|
| 17.6 ms ... emelkedés és süllyedés ↘ kombinálva | ↗ 8.5 ms emelkedés | 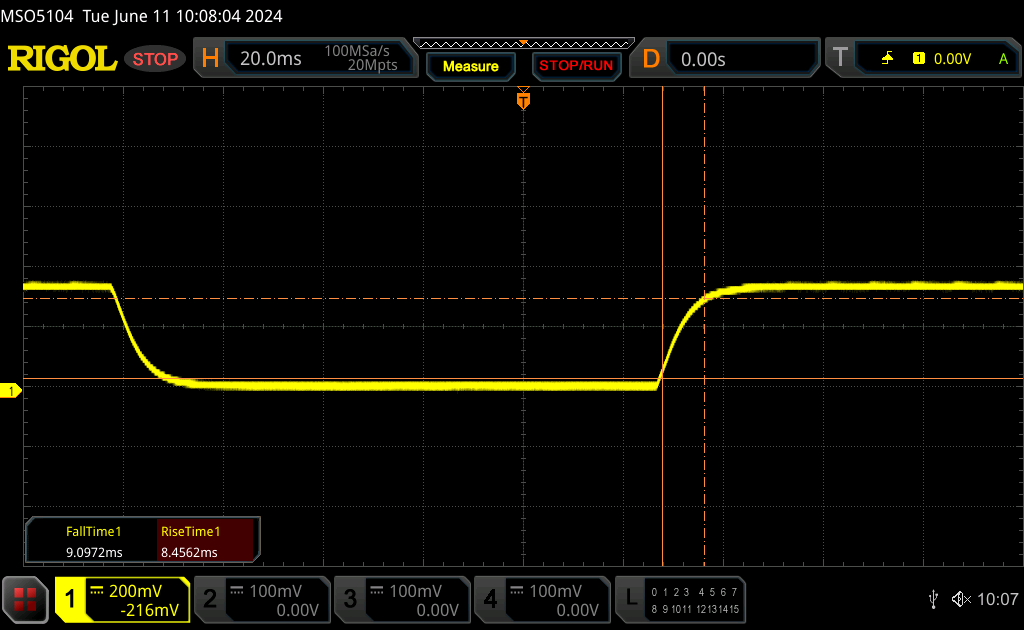 |
| ↘ 9.1 ms ősz | ||
| A képernyő jó reakciósebességet mutat tesztjeinkben, de túl lassú lehet a versenyképes játékosok számára. Összehasonlításképpen, az összes tesztelt eszköz 0.1 (minimum) és 240 (maximum) ms között mozog. » 36 % of all devices are better. Ez azt jelenti, hogy a mért válaszidő jobb, mint az összes vizsgált eszköz átlaga (20.8 ms). | ||
| ↔ Válaszidő 50% szürke és 80% szürke között | ||
| 25.6 ms ... emelkedés és süllyedés ↘ kombinálva | ↗ 12.3 ms emelkedés | 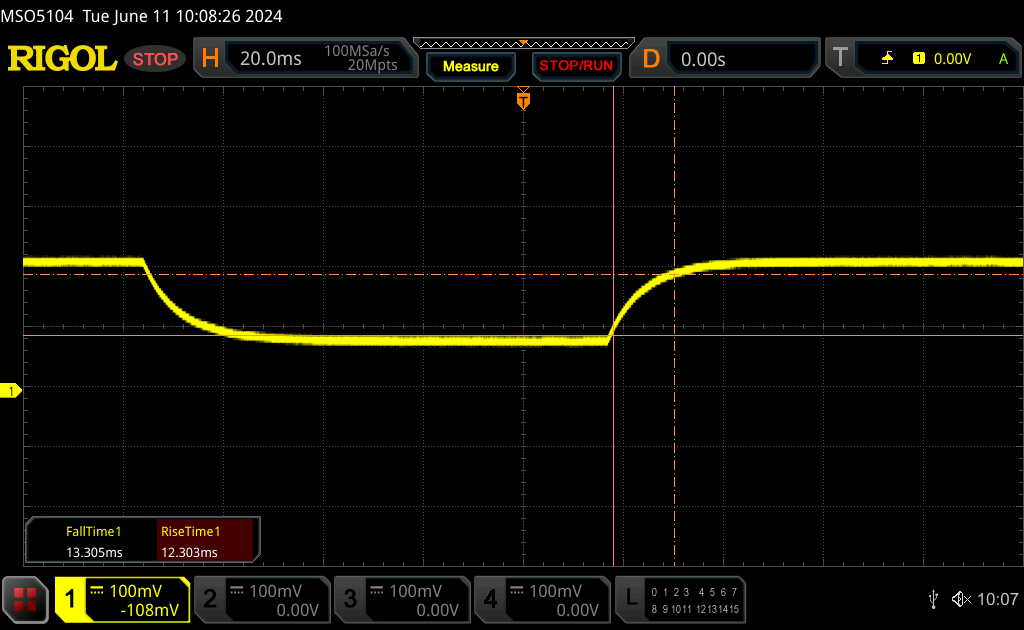 |
| ↘ 13.3 ms ősz | ||
| A képernyő viszonylag lassú reakciósebességet mutat tesztjeinkben, és túl lassú lehet a játékosok számára. Összehasonlításképpen, az összes tesztelt eszköz 0.165 (minimum) és 636 (maximum) ms között mozog. » 33 % of all devices are better. Ez azt jelenti, hogy a mért válaszidő jobb, mint az összes vizsgált eszköz átlaga (32.5 ms). | ||
Képernyő villogása / PWM (impulzusszélesség-moduláció)
| Képernyő villogása / PWM nem érzékelhető | 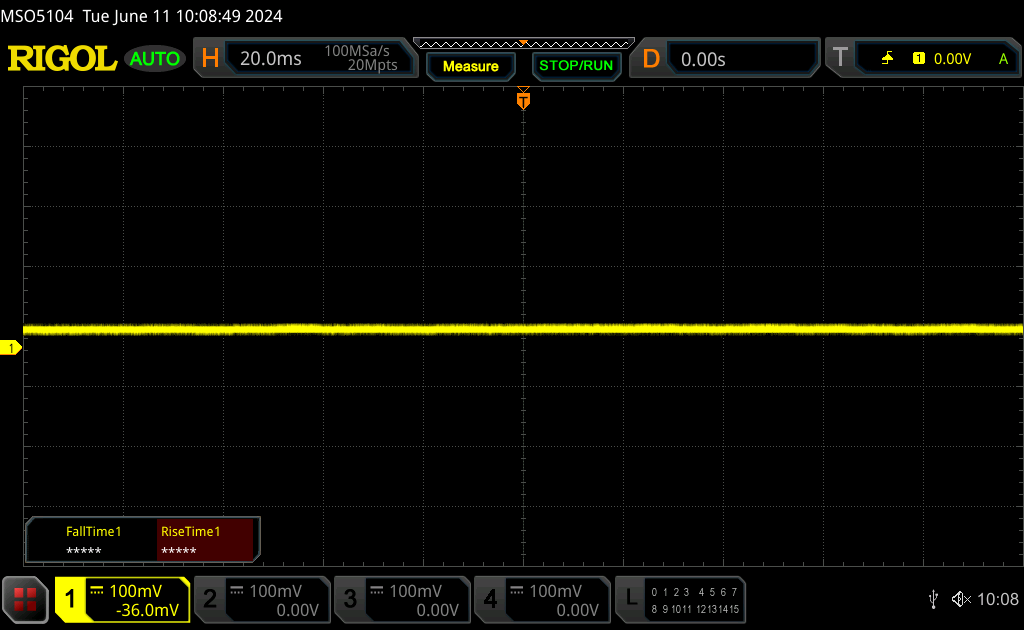 | ||
Összehasonlításképpen: az összes tesztelt eszköz 53 %-a nem használja a PWM-et a kijelző elsötétítésére. Ha PWM-et észleltek, akkor átlagosan 8516 (minimum: 5 - maximum: 343500) Hz-t mértek. | |||

Teljesítmény - AI-Ready
Vizsgálati feltételek
Az alábbi összehasonlító tesztek futtatása előtt a Windows-t teljesítmény üzemmódba állítottuk.
Processzor
A Core Ultra 7 155H teljesítménye kiváló, a többszálas eredmények 15-20 százalékkal gyorsabbak, mint más, azonos processzorral rendelkező laptopoké. Összehasonlítva a Core i7-13700H a tavalyi Inspiron 16 Plus 7630-ban található, az újabb CPU azonban csak körülbelül 10 százalékkal gyorsabb, hogy a feladatok túlnyomó többségénél többnyire észrevehetetlen legyen. Sőt, az egyszálas munkameneteknél a régebbi CPU némi előnyt látszik élvezni.
Természetesen a Core Ultra 7 155H jokere az integrált NPU-ban rejlik, amely jól jöhet az AI-gyorsított feladatokhoz, amint azok könnyebben elérhetővé válnak. Hasznossága egyébként a cikk írásakor rendkívül korlátozott.
Cinebench R15 Multi Loop
Cinebench R23: Multi Core | Single Core
Cinebench R20: CPU (Multi Core) | CPU (Single Core)
Cinebench R15: CPU Multi 64Bit | CPU Single 64Bit
Blender: v2.79 BMW27 CPU
7-Zip 18.03: 7z b 4 | 7z b 4 -mmt1
Geekbench 6.4: Multi-Core | Single-Core
Geekbench 5.5: Multi-Core | Single-Core
HWBOT x265 Benchmark v2.2: 4k Preset
LibreOffice : 20 Documents To PDF
R Benchmark 2.5: Overall mean
| CPU Performance Rating | |
| Lenovo Legion 5 16IRX G9 | |
| Lenovo Yoga Pro 9 16IMH9 | |
| Framework Laptop 16 | |
| Dell Inspiron 16 Plus 7640 | |
| Dell Inspiron 16 Plus 7630 | |
| Átlagos Intel Core Ultra 7 155H | |
| Asus VivoBook Pro 16 K6602VU | |
| Dell Inspiron 16 Plus 7620 -2! | |
| Minisforum V3 | |
| Lenovo Legion S7 16ARHA7 -2! | |
| Acer Nitro 16 AN16-41 -2! | |
| Acer Nitro 16 AN16-41-R7YE | |
| Lenovo ThinkPad E16 G1-21JUS08X00 | |
| Lenovo Yoga 7 2-in-1 16IML9 | |
| Lenovo ThinkBook 16 G6 ABP | |
| Cinebench R23 / Multi Core | |
| Lenovo Legion 5 16IRX G9 | |
| Lenovo Yoga Pro 9 16IMH9 | |
| Dell Inspiron 16 Plus 7640 | |
| Framework Laptop 16 | |
| Dell Inspiron 16 Plus 7630 | |
| Átlagos Intel Core Ultra 7 155H (9769 - 19007, n=52) | |
| Asus VivoBook Pro 16 K6602VU | |
| Dell Inspiron 16 Plus 7620 | |
| Lenovo Legion S7 16ARHA7 | |
| Acer Nitro 16 AN16-41 | |
| Minisforum V3 | |
| Acer Nitro 16 AN16-41-R7YE | |
| Lenovo ThinkPad E16 G1-21JUS08X00 | |
| Lenovo Yoga 7 2-in-1 16IML9 | |
| Lenovo ThinkBook 16 G6 ABP | |
| Cinebench R23 / Single Core | |
| Lenovo Legion 5 16IRX G9 | |
| Lenovo Yoga Pro 9 16IMH9 | |
| Dell Inspiron 16 Plus 7630 | |
| Dell Inspiron 16 Plus 7620 | |
| Asus VivoBook Pro 16 K6602VU | |
| Framework Laptop 16 | |
| Dell Inspiron 16 Plus 7640 | |
| Átlagos Intel Core Ultra 7 155H (1496 - 1815, n=52) | |
| Minisforum V3 | |
| Lenovo Legion S7 16ARHA7 | |
| Lenovo Yoga 7 2-in-1 16IML9 | |
| Acer Nitro 16 AN16-41 | |
| Acer Nitro 16 AN16-41-R7YE | |
| Lenovo ThinkPad E16 G1-21JUS08X00 | |
| Lenovo ThinkBook 16 G6 ABP | |
| Cinebench R20 / CPU (Multi Core) | |
| Lenovo Legion 5 16IRX G9 | |
| Lenovo Yoga Pro 9 16IMH9 | |
| Dell Inspiron 16 Plus 7640 | |
| Framework Laptop 16 | |
| Dell Inspiron 16 Plus 7630 | |
| Átlagos Intel Core Ultra 7 155H (3798 - 7409, n=50) | |
| Asus VivoBook Pro 16 K6602VU | |
| Dell Inspiron 16 Plus 7620 | |
| Lenovo Legion S7 16ARHA7 | |
| Acer Nitro 16 AN16-41 | |
| Minisforum V3 | |
| Acer Nitro 16 AN16-41-R7YE | |
| Lenovo ThinkPad E16 G1-21JUS08X00 | |
| Lenovo Yoga 7 2-in-1 16IML9 | |
| Lenovo ThinkBook 16 G6 ABP | |
| Cinebench R20 / CPU (Single Core) | |
| Lenovo Legion 5 16IRX G9 | |
| Lenovo Yoga Pro 9 16IMH9 | |
| Dell Inspiron 16 Plus 7630 | |
| Dell Inspiron 16 Plus 7620 | |
| Framework Laptop 16 | |
| Asus VivoBook Pro 16 K6602VU | |
| Dell Inspiron 16 Plus 7640 | |
| Minisforum V3 | |
| Átlagos Intel Core Ultra 7 155H (601 - 696, n=50) | |
| Lenovo Legion S7 16ARHA7 | |
| Lenovo Yoga 7 2-in-1 16IML9 | |
| Acer Nitro 16 AN16-41 | |
| Acer Nitro 16 AN16-41-R7YE | |
| Lenovo ThinkPad E16 G1-21JUS08X00 | |
| Lenovo ThinkBook 16 G6 ABP | |
| Cinebench R15 / CPU Multi 64Bit | |
| Lenovo Legion 5 16IRX G9 | |
| Lenovo Yoga Pro 9 16IMH9 | |
| Dell Inspiron 16 Plus 7640 | |
| Framework Laptop 16 | |
| Asus VivoBook Pro 16 K6602VU | |
| Átlagos Intel Core Ultra 7 155H (1932 - 2880, n=56) | |
| Dell Inspiron 16 Plus 7620 | |
| Dell Inspiron 16 Plus 7630 | |
| Lenovo Legion S7 16ARHA7 | |
| Acer Nitro 16 AN16-41 | |
| Minisforum V3 | |
| Acer Nitro 16 AN16-41-R7YE | |
| Lenovo ThinkPad E16 G1-21JUS08X00 | |
| Lenovo Yoga 7 2-in-1 16IML9 | |
| Lenovo ThinkBook 16 G6 ABP | |
| Cinebench R15 / CPU Single 64Bit | |
| Lenovo Legion 5 16IRX G9 | |
| Lenovo Yoga Pro 9 16IMH9 | |
| Framework Laptop 16 | |
| Dell Inspiron 16 Plus 7630 | |
| Minisforum V3 | |
| Lenovo Legion S7 16ARHA7 | |
| Dell Inspiron 16 Plus 7640 | |
| Dell Inspiron 16 Plus 7620 | |
| Asus VivoBook Pro 16 K6602VU | |
| Átlagos Intel Core Ultra 7 155H (99.6 - 268, n=52) | |
| Acer Nitro 16 AN16-41 | |
| Acer Nitro 16 AN16-41-R7YE | |
| Lenovo ThinkBook 16 G6 ABP | |
| Lenovo ThinkPad E16 G1-21JUS08X00 | |
| Lenovo Yoga 7 2-in-1 16IML9 | |
| Blender / v2.79 BMW27 CPU | |
| Lenovo Yoga 7 2-in-1 16IML9 | |
| Lenovo ThinkBook 16 G6 ABP | |
| Lenovo ThinkPad E16 G1-21JUS08X00 | |
| Acer Nitro 16 AN16-41-R7YE | |
| Minisforum V3 | |
| Dell Inspiron 16 Plus 7620 | |
| Átlagos Intel Core Ultra 7 155H (175 - 381, n=47) | |
| Dell Inspiron 16 Plus 7630 | |
| Acer Nitro 16 AN16-41 | |
| Lenovo Legion S7 16ARHA7 | |
| Asus VivoBook Pro 16 K6602VU | |
| Framework Laptop 16 | |
| Dell Inspiron 16 Plus 7640 | |
| Lenovo Yoga Pro 9 16IMH9 | |
| Lenovo Legion 5 16IRX G9 | |
| 7-Zip 18.03 / 7z b 4 | |
| Lenovo Legion 5 16IRX G9 | |
| Lenovo Yoga Pro 9 16IMH9 | |
| Framework Laptop 16 | |
| Asus VivoBook Pro 16 K6602VU | |
| Lenovo Legion S7 16ARHA7 | |
| Dell Inspiron 16 Plus 7640 | |
| Acer Nitro 16 AN16-41 | |
| Dell Inspiron 16 Plus 7620 | |
| Dell Inspiron 16 Plus 7630 | |
| Átlagos Intel Core Ultra 7 155H (41739 - 70254, n=50) | |
| Minisforum V3 | |
| Acer Nitro 16 AN16-41-R7YE | |
| Lenovo ThinkPad E16 G1-21JUS08X00 | |
| Lenovo ThinkBook 16 G6 ABP | |
| Lenovo Yoga 7 2-in-1 16IML9 | |
| 7-Zip 18.03 / 7z b 4 -mmt1 | |
| Lenovo Legion 5 16IRX G9 | |
| Framework Laptop 16 | |
| Lenovo Legion S7 16ARHA7 | |
| Minisforum V3 | |
| Lenovo Yoga Pro 9 16IMH9 | |
| Asus VivoBook Pro 16 K6602VU | |
| Dell Inspiron 16 Plus 7630 | |
| Acer Nitro 16 AN16-41-R7YE | |
| Acer Nitro 16 AN16-41 | |
| Dell Inspiron 16 Plus 7620 | |
| Dell Inspiron 16 Plus 7640 | |
| Lenovo ThinkPad E16 G1-21JUS08X00 | |
| Lenovo ThinkBook 16 G6 ABP | |
| Átlagos Intel Core Ultra 7 155H (4594 - 5621, n=50) | |
| Lenovo Yoga 7 2-in-1 16IML9 | |
| Geekbench 6.4 / Multi-Core | |
| Lenovo Legion 5 16IRX G9 | |
| Lenovo Yoga Pro 9 16IMH9 | |
| Dell Inspiron 16 Plus 7630 | |
| Framework Laptop 16 | |
| Dell Inspiron 16 Plus 7640 | |
| Átlagos Intel Core Ultra 7 155H (7732 - 13656, n=55) | |
| Minisforum V3 | |
| Asus VivoBook Pro 16 K6602VU | |
| Lenovo Yoga 7 2-in-1 16IML9 | |
| Acer Nitro 16 AN16-41-R7YE | |
| Lenovo ThinkPad E16 G1-21JUS08X00 | |
| Lenovo ThinkBook 16 G6 ABP | |
| Geekbench 6.4 / Single-Core | |
| Lenovo Legion 5 16IRX G9 | |
| Dell Inspiron 16 Plus 7630 | |
| Framework Laptop 16 | |
| Lenovo Yoga Pro 9 16IMH9 | |
| Minisforum V3 | |
| Asus VivoBook Pro 16 K6602VU | |
| Dell Inspiron 16 Plus 7640 | |
| Átlagos Intel Core Ultra 7 155H (1901 - 2473, n=52) | |
| Lenovo Yoga 7 2-in-1 16IML9 | |
| Acer Nitro 16 AN16-41-R7YE | |
| Lenovo ThinkBook 16 G6 ABP | |
| Lenovo ThinkPad E16 G1-21JUS08X00 | |
| Geekbench 5.5 / Multi-Core | |
| Lenovo Legion 5 16IRX G9 | |
| Lenovo Yoga Pro 9 16IMH9 | |
| Dell Inspiron 16 Plus 7630 | |
| Dell Inspiron 16 Plus 7640 | |
| Framework Laptop 16 | |
| Átlagos Intel Core Ultra 7 155H (10017 - 13556, n=52) | |
| Dell Inspiron 16 Plus 7620 | |
| Asus VivoBook Pro 16 K6602VU | |
| Minisforum V3 | |
| Lenovo Legion S7 16ARHA7 | |
| Acer Nitro 16 AN16-41 | |
| Lenovo Yoga 7 2-in-1 16IML9 | |
| Acer Nitro 16 AN16-41-R7YE | |
| Lenovo ThinkPad E16 G1-21JUS08X00 | |
| Lenovo ThinkBook 16 G6 ABP | |
| Geekbench 5.5 / Single-Core | |
| Framework Laptop 16 | |
| Lenovo Legion 5 16IRX G9 | |
| Dell Inspiron 16 Plus 7630 | |
| Lenovo Yoga Pro 9 16IMH9 | |
| Minisforum V3 | |
| Dell Inspiron 16 Plus 7640 | |
| Átlagos Intel Core Ultra 7 155H (1462 - 1824, n=52) | |
| Asus VivoBook Pro 16 K6602VU | |
| Dell Inspiron 16 Plus 7620 | |
| Lenovo Legion S7 16ARHA7 | |
| Lenovo Yoga 7 2-in-1 16IML9 | |
| Acer Nitro 16 AN16-41 | |
| Acer Nitro 16 AN16-41-R7YE | |
| Lenovo ThinkBook 16 G6 ABP | |
| Lenovo ThinkPad E16 G1-21JUS08X00 | |
| HWBOT x265 Benchmark v2.2 / 4k Preset | |
| Lenovo Legion 5 16IRX G9 | |
| Lenovo Yoga Pro 9 16IMH9 | |
| Framework Laptop 16 | |
| Dell Inspiron 16 Plus 7640 | |
| Lenovo Legion S7 16ARHA7 | |
| Acer Nitro 16 AN16-41 | |
| Asus VivoBook Pro 16 K6602VU | |
| Minisforum V3 | |
| Átlagos Intel Core Ultra 7 155H (9.93 - 21.2, n=50) | |
| Dell Inspiron 16 Plus 7620 | |
| Dell Inspiron 16 Plus 7630 | |
| Acer Nitro 16 AN16-41-R7YE | |
| Lenovo ThinkPad E16 G1-21JUS08X00 | |
| Lenovo ThinkBook 16 G6 ABP | |
| Lenovo Yoga 7 2-in-1 16IML9 | |
| LibreOffice / 20 Documents To PDF | |
| Asus VivoBook Pro 16 K6602VU | |
| Lenovo ThinkBook 16 G6 ABP | |
| Acer Nitro 16 AN16-41 | |
| Minisforum V3 | |
| Lenovo ThinkPad E16 G1-21JUS08X00 | |
| Átlagos Intel Core Ultra 7 155H (37.5 - 79.2, n=49) | |
| Lenovo Legion S7 16ARHA7 | |
| Lenovo Yoga 7 2-in-1 16IML9 | |
| Acer Nitro 16 AN16-41-R7YE | |
| Dell Inspiron 16 Plus 7620 | |
| Dell Inspiron 16 Plus 7630 | |
| Lenovo Legion 5 16IRX G9 | |
| Framework Laptop 16 | |
| Dell Inspiron 16 Plus 7640 | |
| Lenovo Yoga Pro 9 16IMH9 | |
| R Benchmark 2.5 / Overall mean | |
| Lenovo Yoga 7 2-in-1 16IML9 | |
| Lenovo ThinkBook 16 G6 ABP | |
| Lenovo ThinkPad E16 G1-21JUS08X00 | |
| Acer Nitro 16 AN16-41-R7YE | |
| Acer Nitro 16 AN16-41 | |
| Asus VivoBook Pro 16 K6602VU | |
| Átlagos Intel Core Ultra 7 155H (0.4457 - 0.53, n=49) | |
| Minisforum V3 | |
| Dell Inspiron 16 Plus 7620 | |
| Dell Inspiron 16 Plus 7640 | |
| Lenovo Legion S7 16ARHA7 | |
| Framework Laptop 16 | |
| Lenovo Yoga Pro 9 16IMH9 | |
| Dell Inspiron 16 Plus 7630 | |
| Lenovo Legion 5 16IRX G9 | |
Cinebench R23: Multi Core | Single Core
Cinebench R20: CPU (Multi Core) | CPU (Single Core)
Cinebench R15: CPU Multi 64Bit | CPU Single 64Bit
Blender: v2.79 BMW27 CPU
7-Zip 18.03: 7z b 4 | 7z b 4 -mmt1
Geekbench 6.4: Multi-Core | Single-Core
Geekbench 5.5: Multi-Core | Single-Core
HWBOT x265 Benchmark v2.2: 4k Preset
LibreOffice : 20 Documents To PDF
R Benchmark 2.5: Overall mean
* ... a kisebb jobb
AIDA64: FP32 Ray-Trace | FPU Julia | CPU SHA3 | CPU Queen | FPU SinJulia | FPU Mandel | CPU AES | CPU ZLib | FP64 Ray-Trace | CPU PhotoWorxx
| Performance Rating | |
| Lenovo Legion 5 16IRX G9 | |
| Asus VivoBook Pro 16 K6602VU | |
| Samsung Galaxy Book4 Ultra | |
| Dell Inspiron 16 Plus 7640 | |
| Átlagos Intel Core Ultra 7 155H | |
| Dell Inspiron 16 Plus 7630 | |
| Dell Inspiron 16 Plus 7620 | |
| AIDA64 / FP32 Ray-Trace | |
| Lenovo Legion 5 16IRX G9 | |
| Dell Inspiron 16 Plus 7640 | |
| Dell Inspiron 16 Plus 7630 | |
| Asus VivoBook Pro 16 K6602VU | |
| Samsung Galaxy Book4 Ultra | |
| Átlagos Intel Core Ultra 7 155H (6670 - 18470, n=50) | |
| Dell Inspiron 16 Plus 7620 | |
| AIDA64 / FPU Julia | |
| Lenovo Legion 5 16IRX G9 | |
| Asus VivoBook Pro 16 K6602VU | |
| Samsung Galaxy Book4 Ultra | |
| Dell Inspiron 16 Plus 7640 | |
| Átlagos Intel Core Ultra 7 155H (40905 - 93181, n=50) | |
| Dell Inspiron 16 Plus 7630 | |
| Dell Inspiron 16 Plus 7620 | |
| AIDA64 / CPU SHA3 | |
| Lenovo Legion 5 16IRX G9 | |
| Dell Inspiron 16 Plus 7640 | |
| Asus VivoBook Pro 16 K6602VU | |
| Samsung Galaxy Book4 Ultra | |
| Átlagos Intel Core Ultra 7 155H (1940 - 4436, n=50) | |
| Dell Inspiron 16 Plus 7630 | |
| Dell Inspiron 16 Plus 7620 | |
| AIDA64 / CPU Queen | |
| Dell Inspiron 16 Plus 7630 | |
| Lenovo Legion 5 16IRX G9 | |
| Asus VivoBook Pro 16 K6602VU | |
| Dell Inspiron 16 Plus 7620 | |
| Dell Inspiron 16 Plus 7640 | |
| Samsung Galaxy Book4 Ultra | |
| Átlagos Intel Core Ultra 7 155H (64698 - 94181, n=50) | |
| AIDA64 / FPU SinJulia | |
| Lenovo Legion 5 16IRX G9 | |
| Dell Inspiron 16 Plus 7640 | |
| Samsung Galaxy Book4 Ultra | |
| Átlagos Intel Core Ultra 7 155H (5639 - 10647, n=50) | |
| Dell Inspiron 16 Plus 7630 | |
| Asus VivoBook Pro 16 K6602VU | |
| Dell Inspiron 16 Plus 7620 | |
| AIDA64 / FPU Mandel | |
| Lenovo Legion 5 16IRX G9 | |
| Dell Inspiron 16 Plus 7640 | |
| Samsung Galaxy Book4 Ultra | |
| Átlagos Intel Core Ultra 7 155H (18236 - 47685, n=50) | |
| Asus VivoBook Pro 16 K6602VU | |
| Dell Inspiron 16 Plus 7630 | |
| Dell Inspiron 16 Plus 7620 | |
| AIDA64 / CPU AES | |
| Asus VivoBook Pro 16 K6602VU | |
| Lenovo Legion 5 16IRX G9 | |
| Átlagos Intel Core Ultra 7 155H (45713 - 152179, n=50) | |
| Samsung Galaxy Book4 Ultra | |
| Dell Inspiron 16 Plus 7640 | |
| Dell Inspiron 16 Plus 7620 | |
| Dell Inspiron 16 Plus 7630 | |
| AIDA64 / CPU ZLib | |
| Lenovo Legion 5 16IRX G9 | |
| Dell Inspiron 16 Plus 7640 | |
| Dell Inspiron 16 Plus 7620 | |
| Samsung Galaxy Book4 Ultra | |
| Asus VivoBook Pro 16 K6602VU | |
| Átlagos Intel Core Ultra 7 155H (557 - 1250, n=50) | |
| Dell Inspiron 16 Plus 7630 | |
| AIDA64 / FP64 Ray-Trace | |
| Lenovo Legion 5 16IRX G9 | |
| Asus VivoBook Pro 16 K6602VU | |
| Dell Inspiron 16 Plus 7640 | |
| Dell Inspiron 16 Plus 7630 | |
| Samsung Galaxy Book4 Ultra | |
| Átlagos Intel Core Ultra 7 155H (3569 - 9802, n=50) | |
| Dell Inspiron 16 Plus 7620 | |
| AIDA64 / CPU PhotoWorxx | |
| Samsung Galaxy Book4 Ultra | |
| Átlagos Intel Core Ultra 7 155H (32719 - 54223, n=50) | |
| Dell Inspiron 16 Plus 7640 | |
| Asus VivoBook Pro 16 K6602VU | |
| Dell Inspiron 16 Plus 7630 | |
| Dell Inspiron 16 Plus 7620 | |
| Lenovo Legion 5 16IRX G9 | |
Stressz teszt
A CPU 3,2 GHz-es átlagsebességre, 97 W-ra és 101 C-ra gyorsult, és a Prime95 stressz indításakor körülbelül 25 másodpercig tartott. Ezt követően ~2,3 GHz-re és 44 W-ra csökkenne, hogy a maghőmérsékletet 83 C-on tartsa. A Turbo Boost teljesítménye tehát rövid ideig tart a rendszeren, hasonlóan ahhoz, amit az elődmodellnél is megfigyeltünk.
Az Nvidia GPU 2070 MHz-en, 76 C-on és 60 W-on stabilizálódna, ha a következő értékeket használnánk Witcher 3 szemben a tavalyi modell 2250 MHz-ével, 72 C-jával és 69 W-jával hasonló tesztkörülmények között. Ezek az eredmények kiegészítik a játékokban nyújtott, általában lassabb teljesítményt, ahogyan azt az alábbi, játékteljesítményre vonatkozó részben részletezzük. A GPU teljesítménye az új Dell-modellen még Performance üzemmódban is elérte a 60 W-os felső határt, szemben a régebbi Dell-modell 70 W-os teljesítményével.
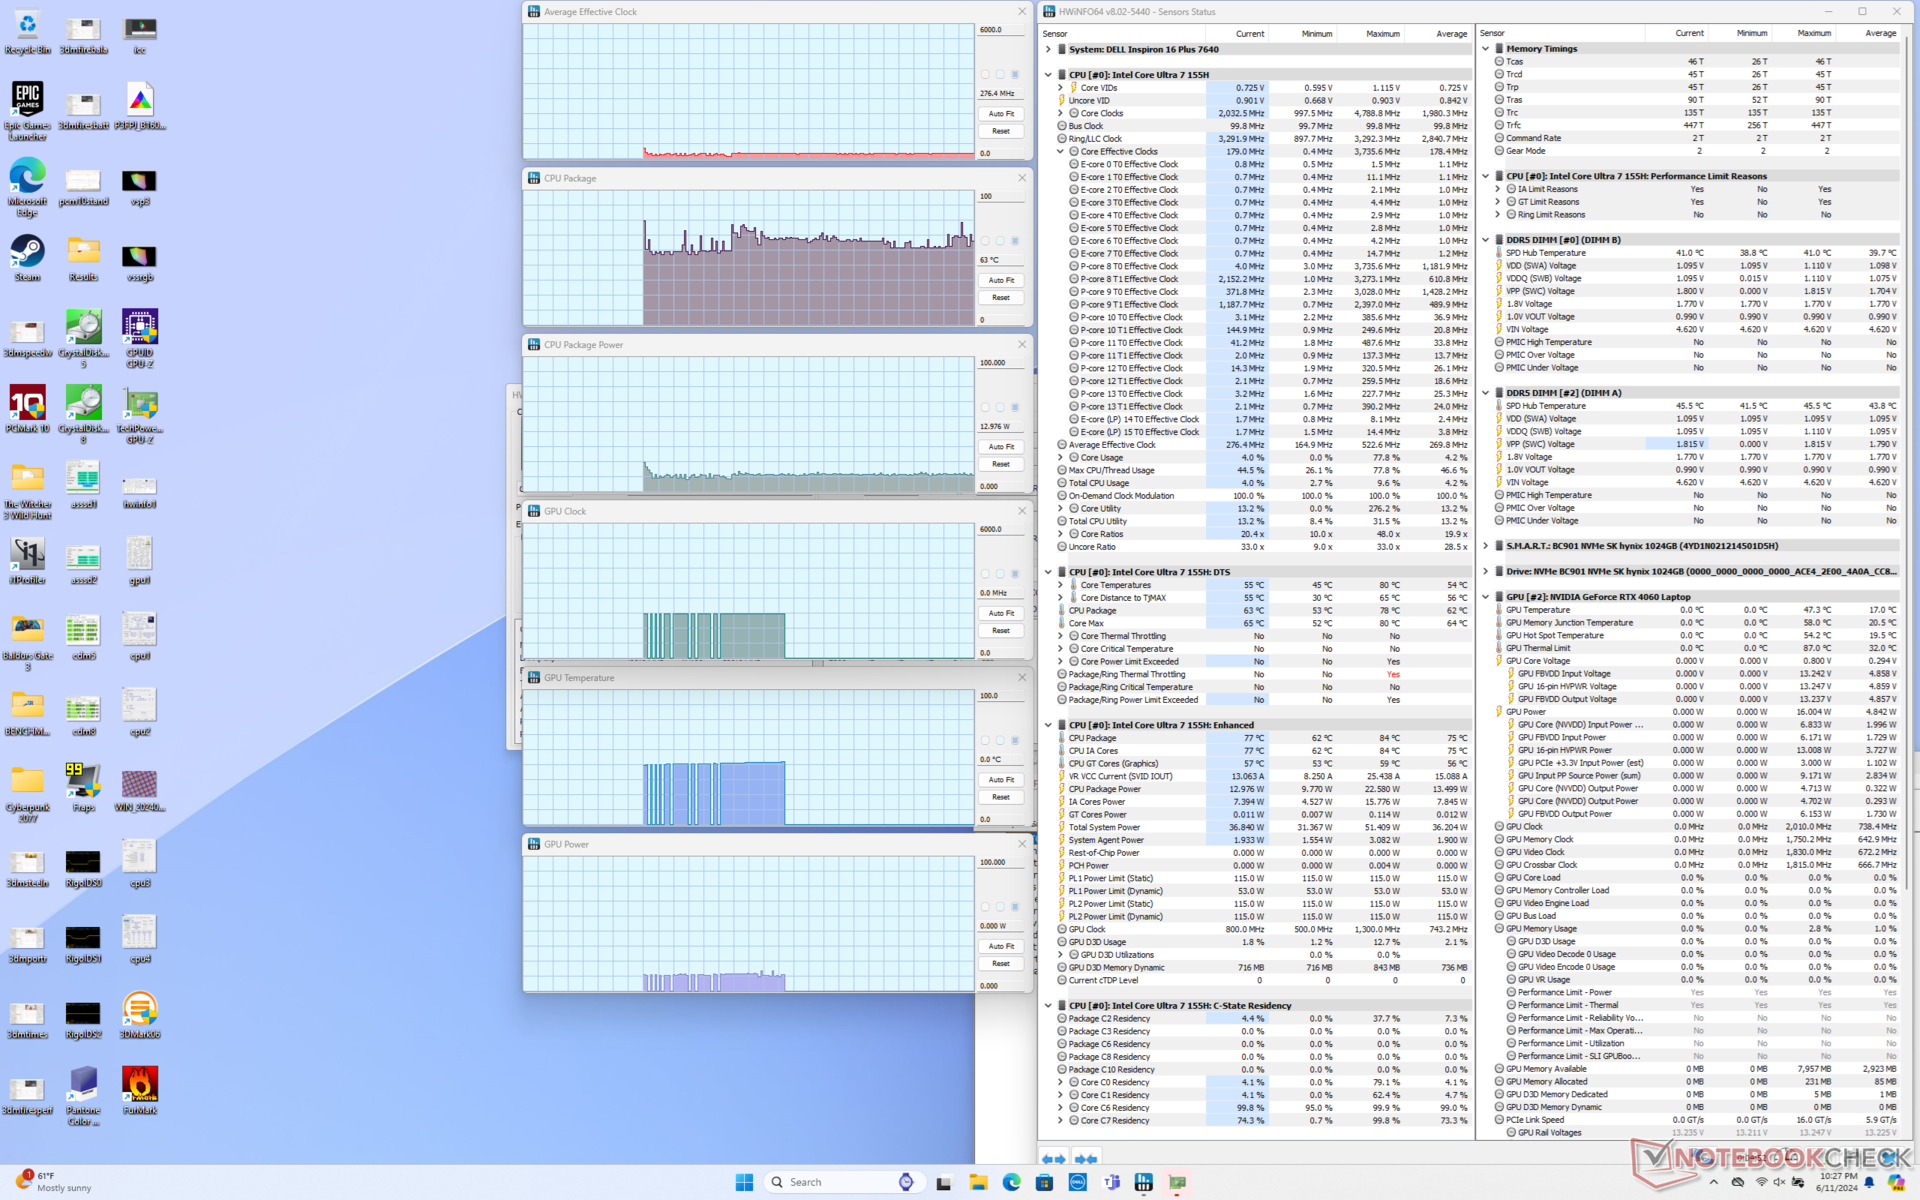
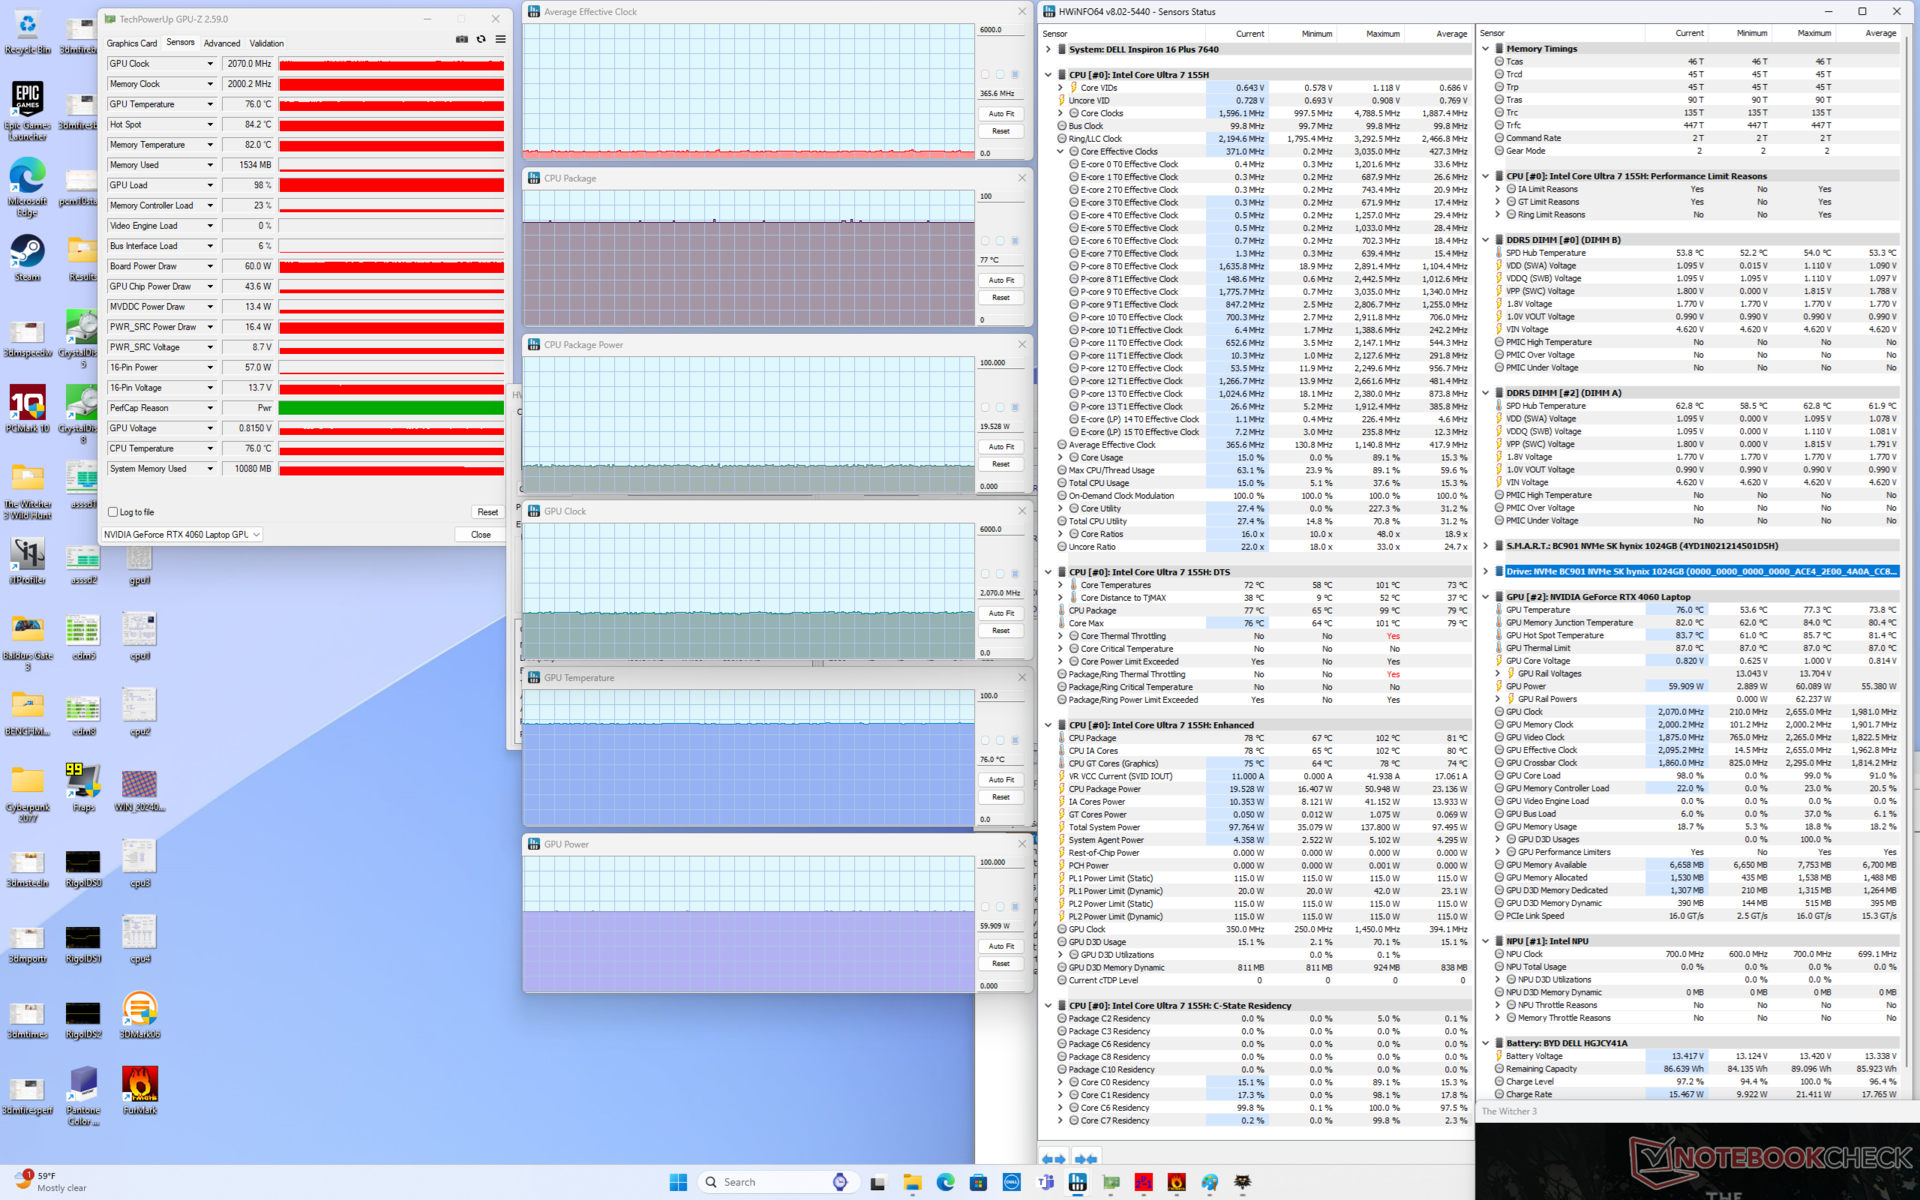

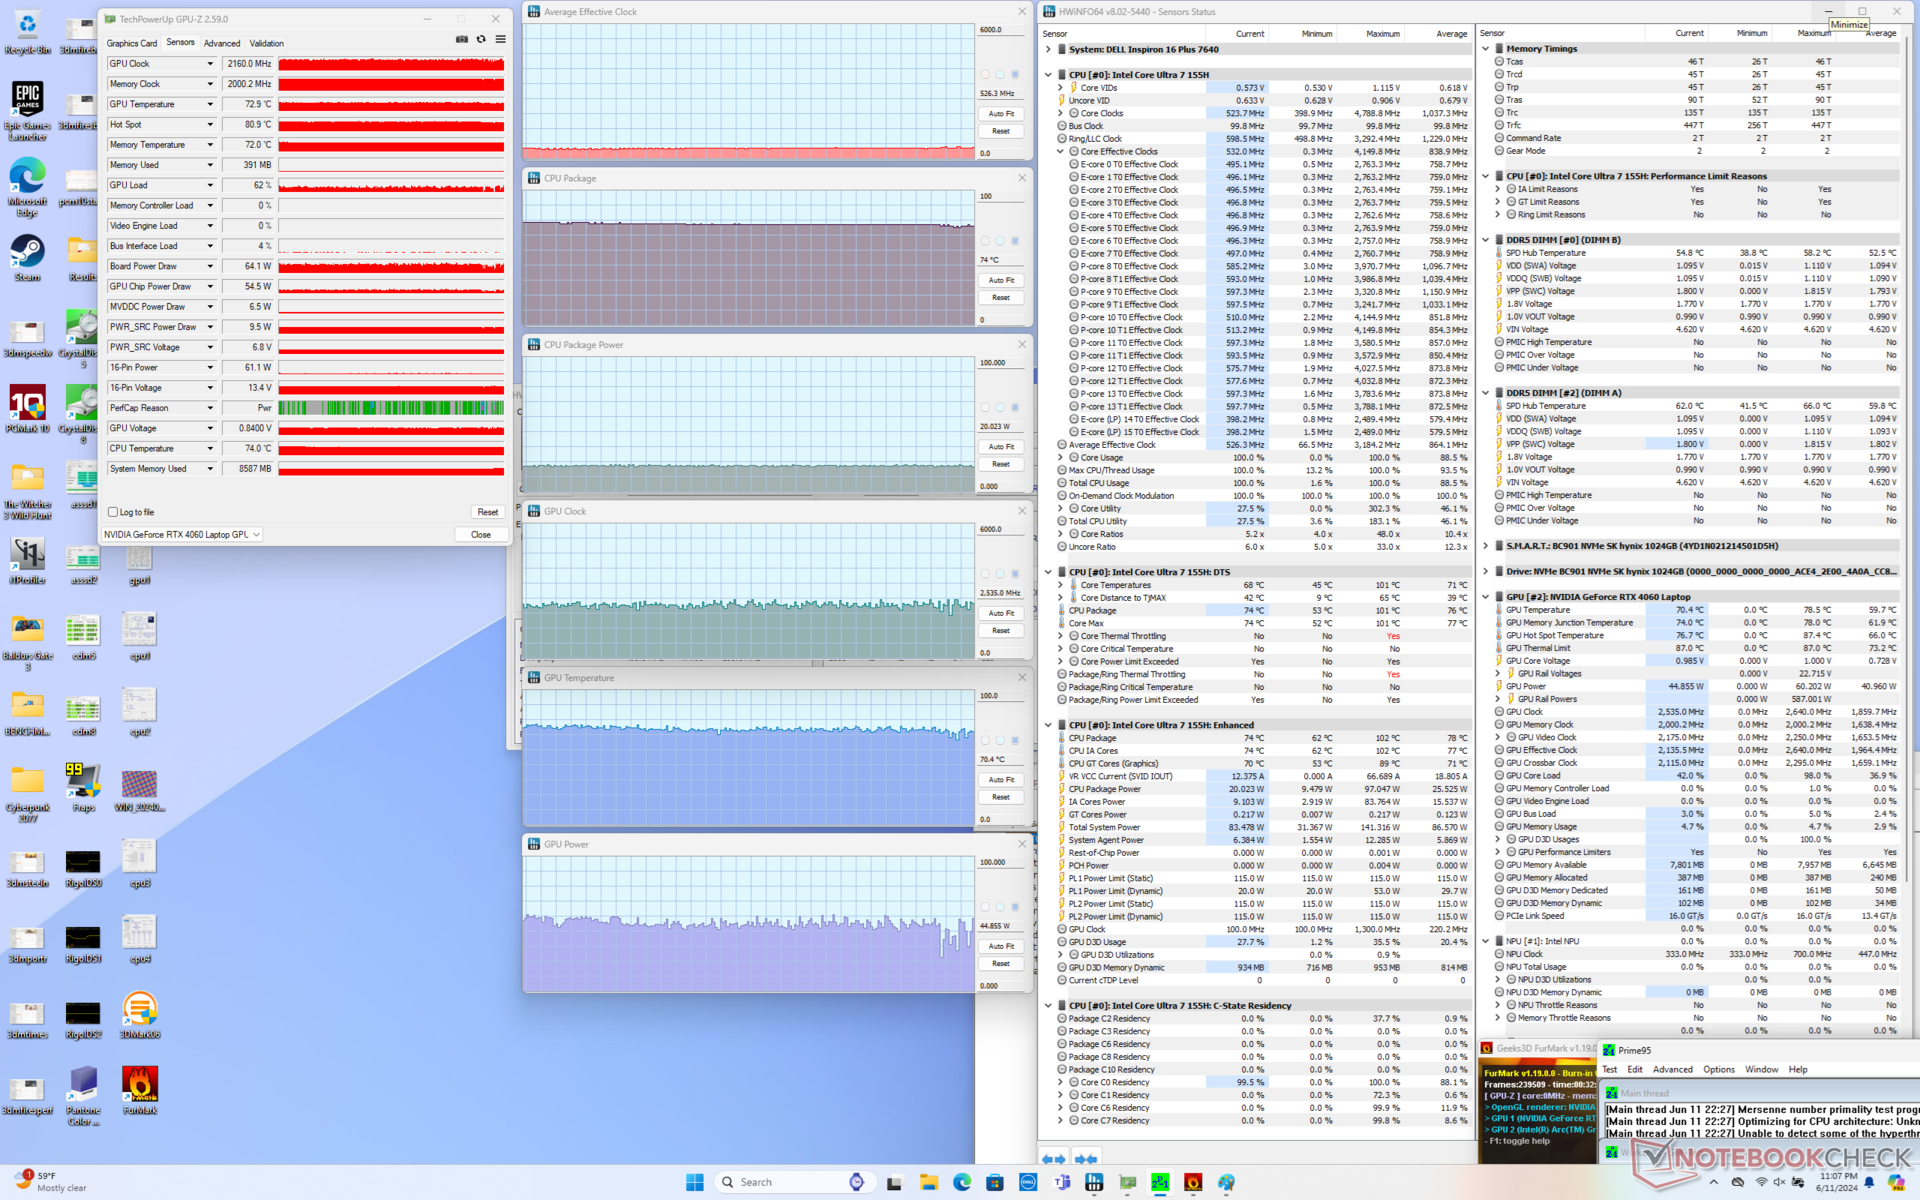
| Átlagos CPU órajel (GHz) | GPU órajel (MHz) | Átlagos CPU hőmérséklet (°C) | Átlagos GPU hőmérséklet (°C) | |
| Rendszer üresjárat | -- | -- | 63 | 45 |
| Prime95 Stressz | 2,1 - 2,4 | -- | 83 | 56 |
| Prime95 + FurMark stressz | 0,5 | 2160 | 74 | 70 |
| Witcher 3 Stressz | 0,4 | 2070 | 77 | 77 |
Rendszer teljesítménye
A PCMark eredmények a CPU frissítés ellenére összehasonlíthatóak a tavalyi modellel, ami azt mutatja, hogy az újabb modell nem feltétlenül gyorsabb, amikor a legtöbb napi műveletről van szó.

CrossMark: Overall | Productivity | Creativity | Responsiveness
WebXPRT 3: Overall
WebXPRT 4: Overall
Mozilla Kraken 1.1: Total
| PCMark 10 / Score | |
| Dell Inspiron 16 Plus 7630 | |
| Lenovo Legion 5 16IRX G9 | |
| Asus VivoBook Pro 16 K6602VU | |
| Dell Inspiron 16 Plus 7640 | |
| Átlagos Intel Core Ultra 7 155H, NVIDIA GeForce RTX 4060 Laptop GPU (6751 - 7370, n=5) | |
| Samsung Galaxy Book4 Ultra | |
| Dell Inspiron 16 Plus 7620 | |
| PCMark 10 / Essentials | |
| Dell Inspiron 16 Plus 7630 | |
| Lenovo Legion 5 16IRX G9 | |
| Samsung Galaxy Book4 Ultra | |
| Dell Inspiron 16 Plus 7640 | |
| Asus VivoBook Pro 16 K6602VU | |
| Dell Inspiron 16 Plus 7620 | |
| Átlagos Intel Core Ultra 7 155H, NVIDIA GeForce RTX 4060 Laptop GPU (9476 - 10446, n=5) | |
| PCMark 10 / Productivity | |
| Dell Inspiron 16 Plus 7630 | |
| Lenovo Legion 5 16IRX G9 | |
| Samsung Galaxy Book4 Ultra | |
| Dell Inspiron 16 Plus 7620 | |
| Átlagos Intel Core Ultra 7 155H, NVIDIA GeForce RTX 4060 Laptop GPU (8079 - 9477, n=5) | |
| Asus VivoBook Pro 16 K6602VU | |
| Dell Inspiron 16 Plus 7640 | |
| PCMark 10 / Digital Content Creation | |
| Lenovo Legion 5 16IRX G9 | |
| Dell Inspiron 16 Plus 7630 | |
| Dell Inspiron 16 Plus 7640 | |
| Asus VivoBook Pro 16 K6602VU | |
| Átlagos Intel Core Ultra 7 155H, NVIDIA GeForce RTX 4060 Laptop GPU (9811 - 11620, n=5) | |
| Samsung Galaxy Book4 Ultra | |
| Dell Inspiron 16 Plus 7620 | |
| CrossMark / Overall | |
| Lenovo Legion 5 16IRX G9 | |
| Dell Inspiron 16 Plus 7630 | |
| Dell Inspiron 16 Plus 7620 | |
| Samsung Galaxy Book4 Ultra | |
| Asus VivoBook Pro 16 K6602VU | |
| Dell Inspiron 16 Plus 7640 | |
| Átlagos Intel Core Ultra 7 155H, NVIDIA GeForce RTX 4060 Laptop GPU (1540 - 1746, n=5) | |
| CrossMark / Productivity | |
| Lenovo Legion 5 16IRX G9 | |
| Dell Inspiron 16 Plus 7630 | |
| Asus VivoBook Pro 16 K6602VU | |
| Samsung Galaxy Book4 Ultra | |
| Dell Inspiron 16 Plus 7620 | |
| Átlagos Intel Core Ultra 7 155H, NVIDIA GeForce RTX 4060 Laptop GPU (1436 - 1684, n=5) | |
| Dell Inspiron 16 Plus 7640 | |
| CrossMark / Creativity | |
| Lenovo Legion 5 16IRX G9 | |
| Dell Inspiron 16 Plus 7630 | |
| Samsung Galaxy Book4 Ultra | |
| Dell Inspiron 16 Plus 7640 | |
| Dell Inspiron 16 Plus 7620 | |
| Átlagos Intel Core Ultra 7 155H, NVIDIA GeForce RTX 4060 Laptop GPU (1811 - 1929, n=5) | |
| Asus VivoBook Pro 16 K6602VU | |
| CrossMark / Responsiveness | |
| Lenovo Legion 5 16IRX G9 | |
| Dell Inspiron 16 Plus 7630 | |
| Asus VivoBook Pro 16 K6602VU | |
| Dell Inspiron 16 Plus 7620 | |
| Samsung Galaxy Book4 Ultra | |
| Átlagos Intel Core Ultra 7 155H, NVIDIA GeForce RTX 4060 Laptop GPU (1165 - 1631, n=5) | |
| Dell Inspiron 16 Plus 7640 | |
| WebXPRT 3 / Overall | |
| Dell Inspiron 16 Plus 7630 | |
| Lenovo Legion 5 16IRX G9 | |
| Dell Inspiron 16 Plus 7620 | |
| Dell Inspiron 16 Plus 7640 | |
| Átlagos Intel Core Ultra 7 155H, NVIDIA GeForce RTX 4060 Laptop GPU (274 - 290, n=5) | |
| Samsung Galaxy Book4 Ultra | |
| WebXPRT 4 / Overall | |
| Lenovo Legion 5 16IRX G9 | |
| Dell Inspiron 16 Plus 7630 | |
| Dell Inspiron 16 Plus 7620 | |
| Samsung Galaxy Book4 Ultra | |
| Dell Inspiron 16 Plus 7640 | |
| Átlagos Intel Core Ultra 7 155H, NVIDIA GeForce RTX 4060 Laptop GPU (236 - 262, n=5) | |
| Asus VivoBook Pro 16 K6602VU | |
| Mozilla Kraken 1.1 / Total | |
| Átlagos Intel Core Ultra 7 155H, NVIDIA GeForce RTX 4060 Laptop GPU (519 - 585, n=5) | |
| Asus VivoBook Pro 16 K6602VU | |
| Dell Inspiron 16 Plus 7620 | |
| Dell Inspiron 16 Plus 7640 | |
| Dell Inspiron 16 Plus 7630 | |
| Lenovo Legion 5 16IRX G9 | |
| Samsung Galaxy Book4 Ultra | |
* ... a kisebb jobb
| PCMark 10 Score | 7042 pontok | |
Segítség | ||
| AIDA64 / Memory Copy | |
| Samsung Galaxy Book4 Ultra | |
| Átlagos Intel Core Ultra 7 155H (62397 - 96791, n=50) | |
| Dell Inspiron 16 Plus 7640 | |
| Lenovo Legion 5 16IRX G9 | |
| Dell Inspiron 16 Plus 7630 | |
| Asus VivoBook Pro 16 K6602VU | |
| Dell Inspiron 16 Plus 7620 | |
| AIDA64 / Memory Read | |
| Samsung Galaxy Book4 Ultra | |
| Átlagos Intel Core Ultra 7 155H (60544 - 90647, n=50) | |
| Dell Inspiron 16 Plus 7640 | |
| Lenovo Legion 5 16IRX G9 | |
| Dell Inspiron 16 Plus 7630 | |
| Asus VivoBook Pro 16 K6602VU | |
| Dell Inspiron 16 Plus 7620 | |
| AIDA64 / Memory Write | |
| Samsung Galaxy Book4 Ultra | |
| Átlagos Intel Core Ultra 7 155H (58692 - 93451, n=50) | |
| Dell Inspiron 16 Plus 7640 | |
| Asus VivoBook Pro 16 K6602VU | |
| Dell Inspiron 16 Plus 7630 | |
| Dell Inspiron 16 Plus 7620 | |
| Lenovo Legion 5 16IRX G9 | |
| AIDA64 / Memory Latency | |
| Átlagos Intel Core Ultra 7 155H (116.2 - 233, n=50) | |
| Samsung Galaxy Book4 Ultra | |
| Dell Inspiron 16 Plus 7640 | |
| Dell Inspiron 16 Plus 7620 | |
| Dell Inspiron 16 Plus 7630 | |
| Asus VivoBook Pro 16 K6602VU | |
| Lenovo Legion 5 16IRX G9 | |
* ... a kisebb jobb
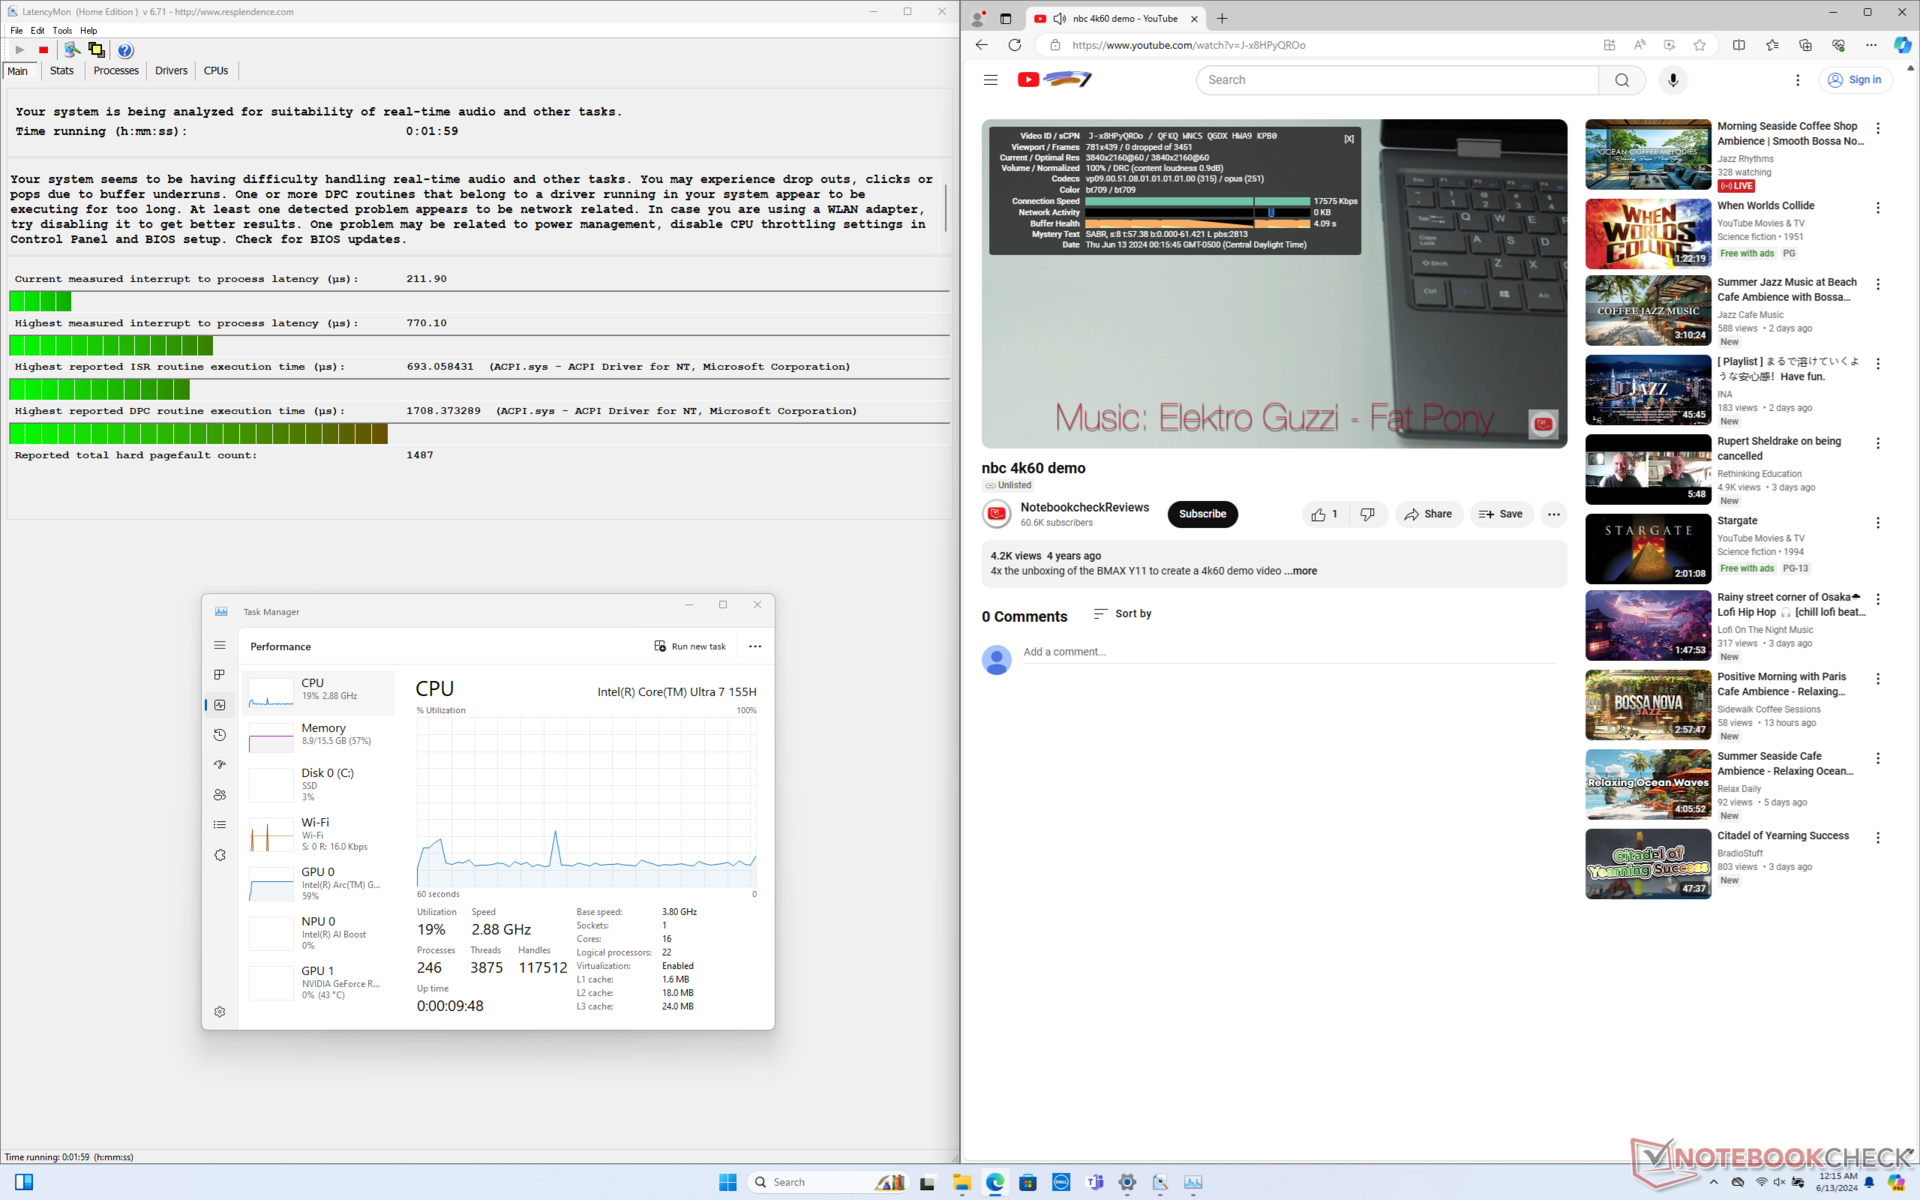
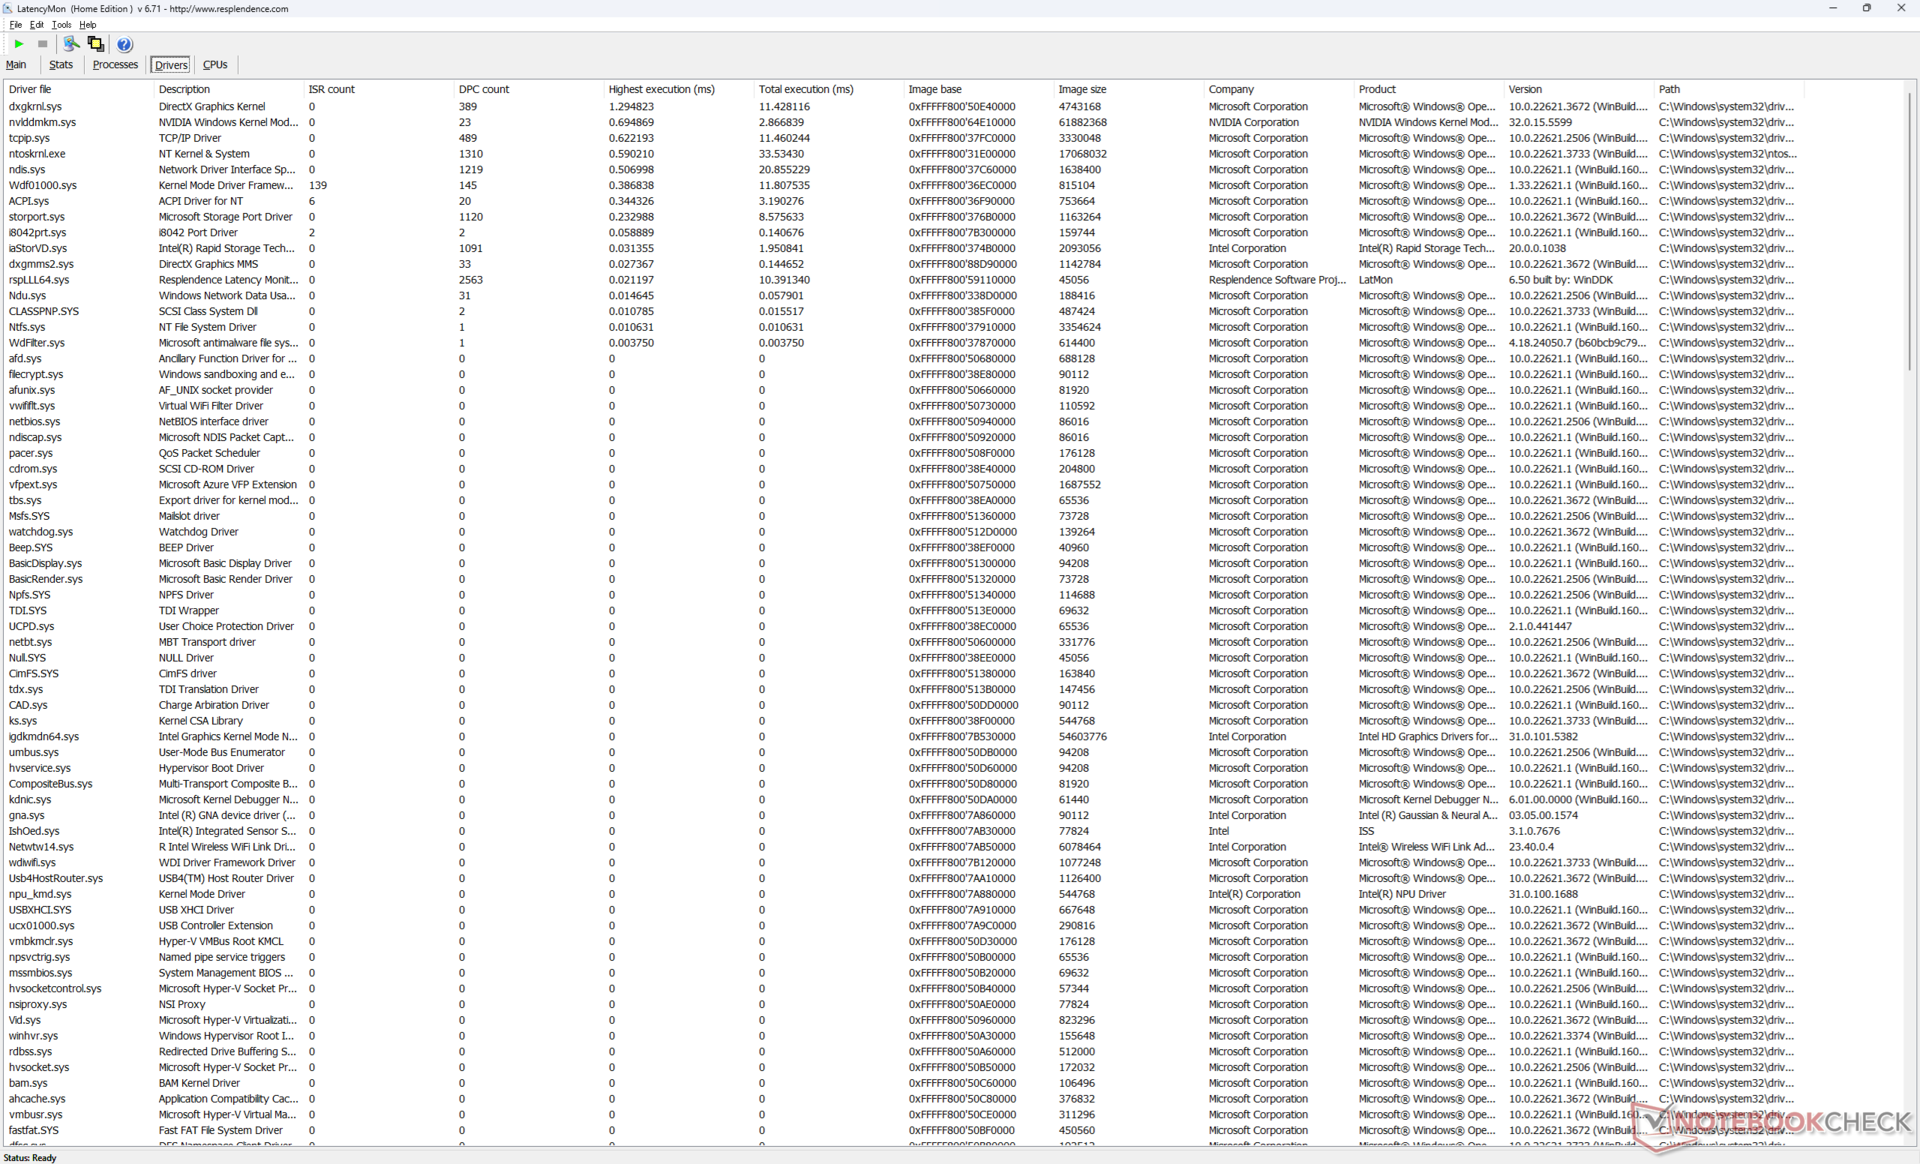
DPC késleltetés
A LatencyMon csak kisebb DPC-problémákat mutat, amikor több böngészőfület nyitunk meg a honlapunkon. a 4K videolejátszás 60 FPS mellett egyébként tökéletes, és nem rögzítettünk kiesett képkockákat.
| DPC Latencies / LatencyMon - interrupt to process latency (max), Web, Youtube, Prime95 | |
| Lenovo Legion 5 16IRX G9 | |
| Asus VivoBook Pro 16 K6602VU | |
| Dell Inspiron 16 Plus 7630 | |
| Dell Inspiron 16 Plus 7620 | |
| Dell Inspiron 16 Plus 7640 | |
| Samsung Galaxy Book4 Ultra | |
* ... a kisebb jobb
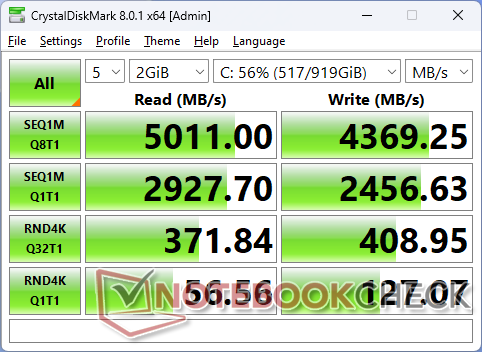
Tárolóeszközök
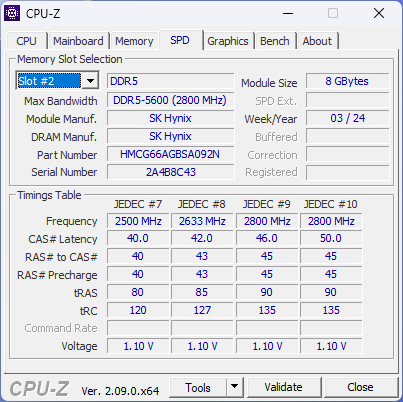
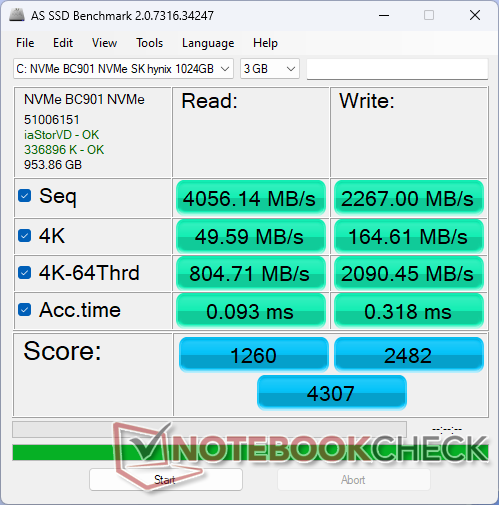
A tesztegységünkhöz egy lassabb SK Hynix meghajtóval a tavalyi modell Western Digital meghajtója helyett. Az SK Hynix meghajtó érezhetően lassabb, amint azt a benchmark-tesztjeink is mutatják, de nem szenved teljesítménycsökkentő problémáktól, így összességében stabilabb az átviteli sebesség.

| Drive Performance Rating - Percent | |
| Lenovo Legion 5 16IRX G9 | |
| Samsung Galaxy Book4 Ultra | |
| Dell Inspiron 16 Plus 7630 | |
| Asus VivoBook Pro 16 K6602VU | |
| Dell Inspiron 16 Plus 7640 | |
| Dell Inspiron 16 Plus 7620 | |
* ... a kisebb jobb
Disk Throttling: DiskSpd Read Loop, Queue Depth 8
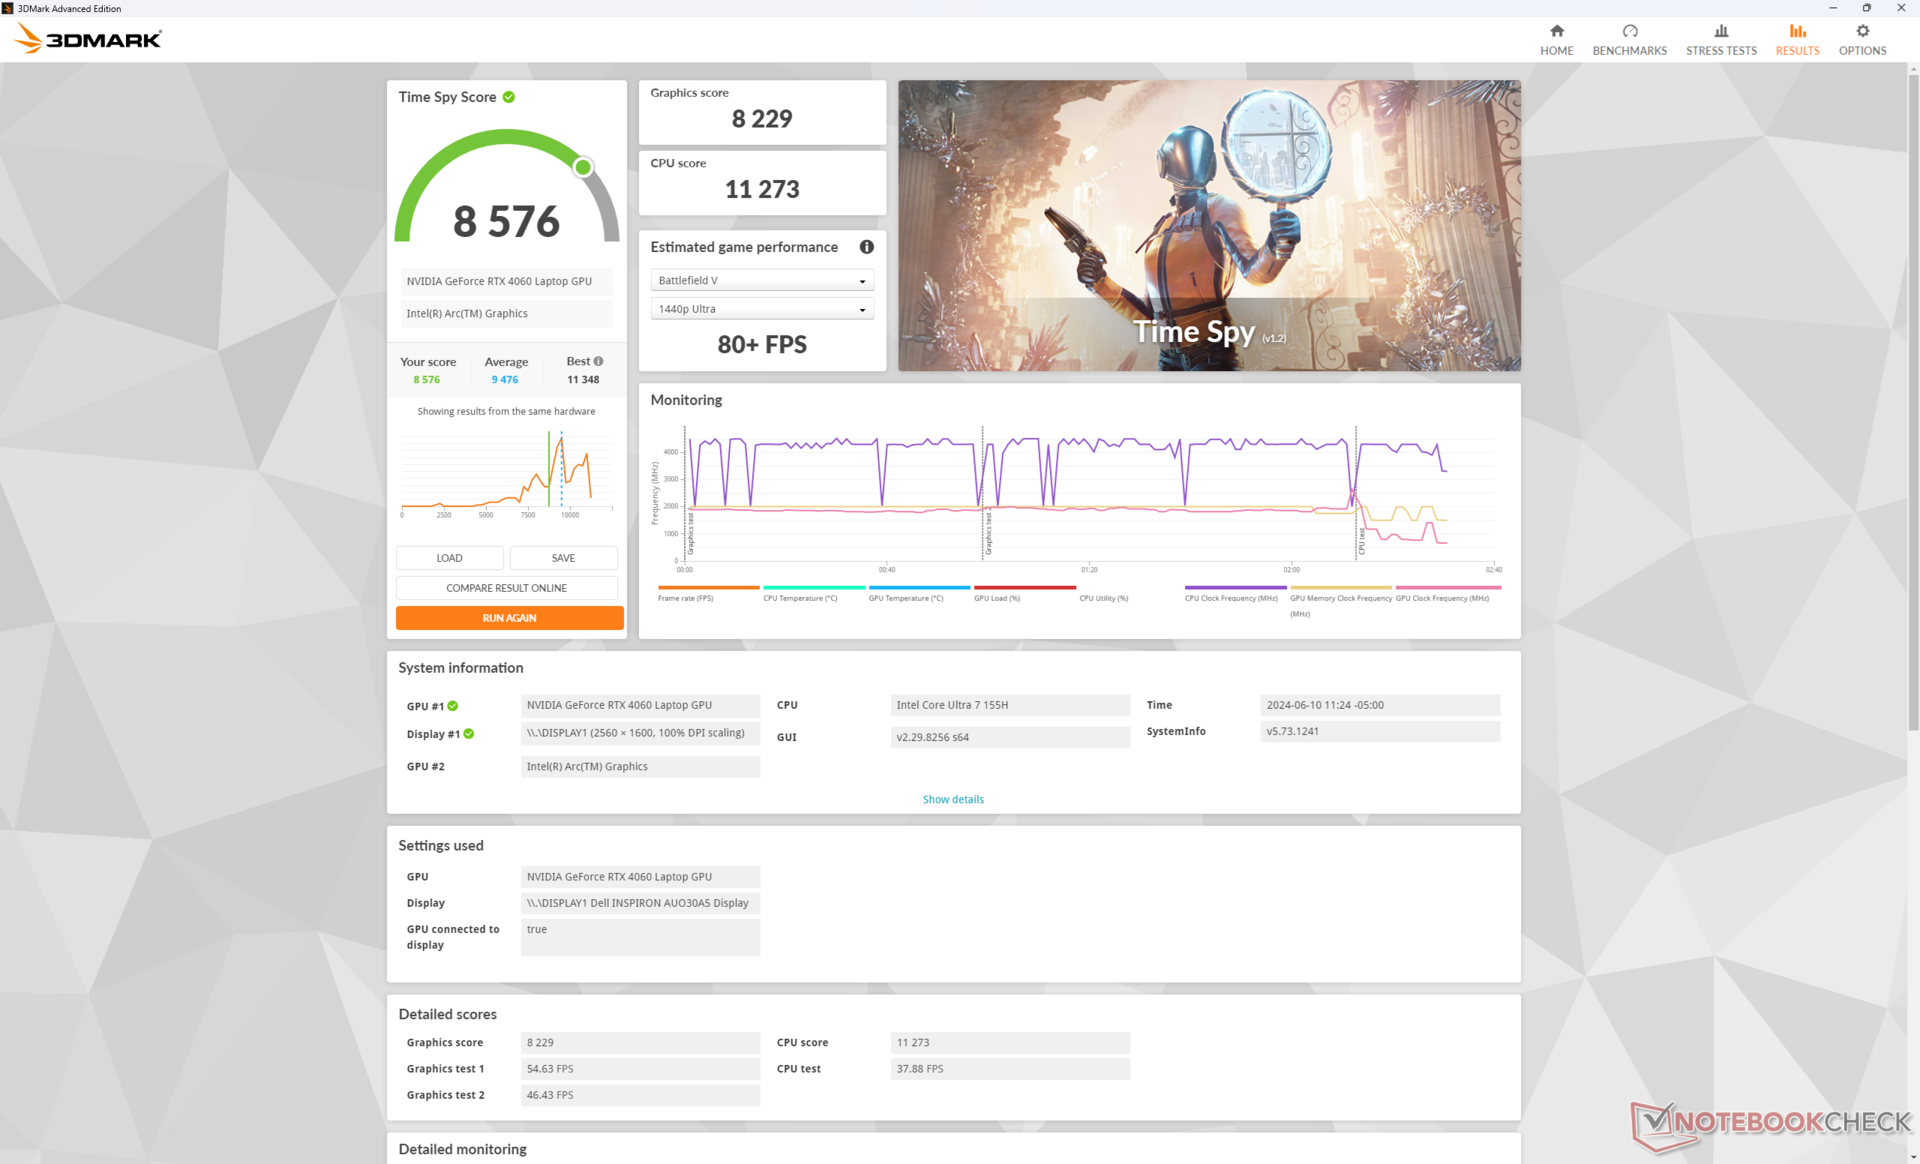
GPU teljesítmény
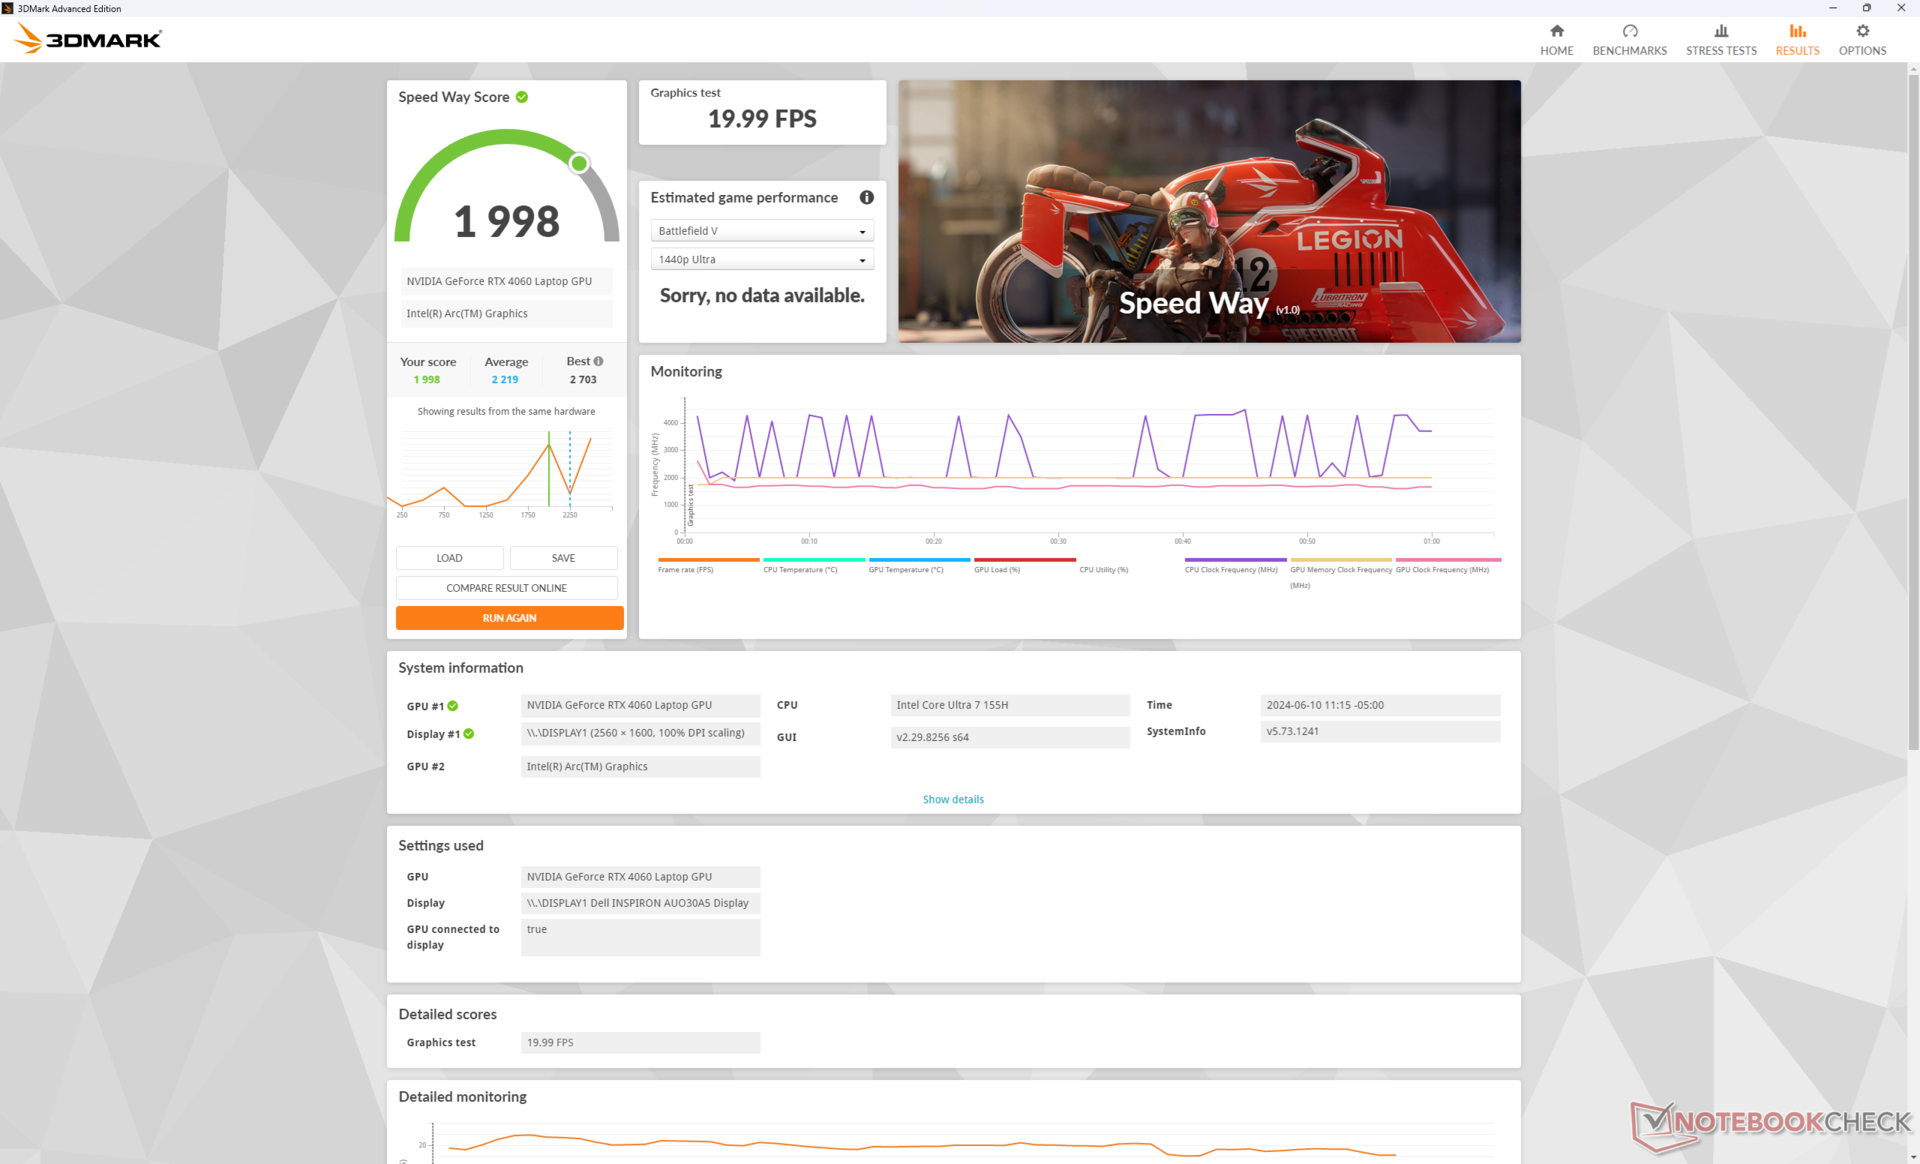
Az Nvidia GPU opciók változatlanok maradnak a GeForce RTX 4050 és a 4060 opciók. a 3DMark eredmények néhány százalékponttal magasabbak, mint korábban, de ez sajnos nem tükröződik a tényleges játékteljesítményben.
Az RTX 4050-re való visszaminősítés várhatóan csak 10 százalékkal befolyásolja a teljesítményt. Ha egyáltalán nem választjuk a diszkrét grafikát, az sokkal jelentősebben, 60-80 százalékkal befolyásolja a teljesítményt.
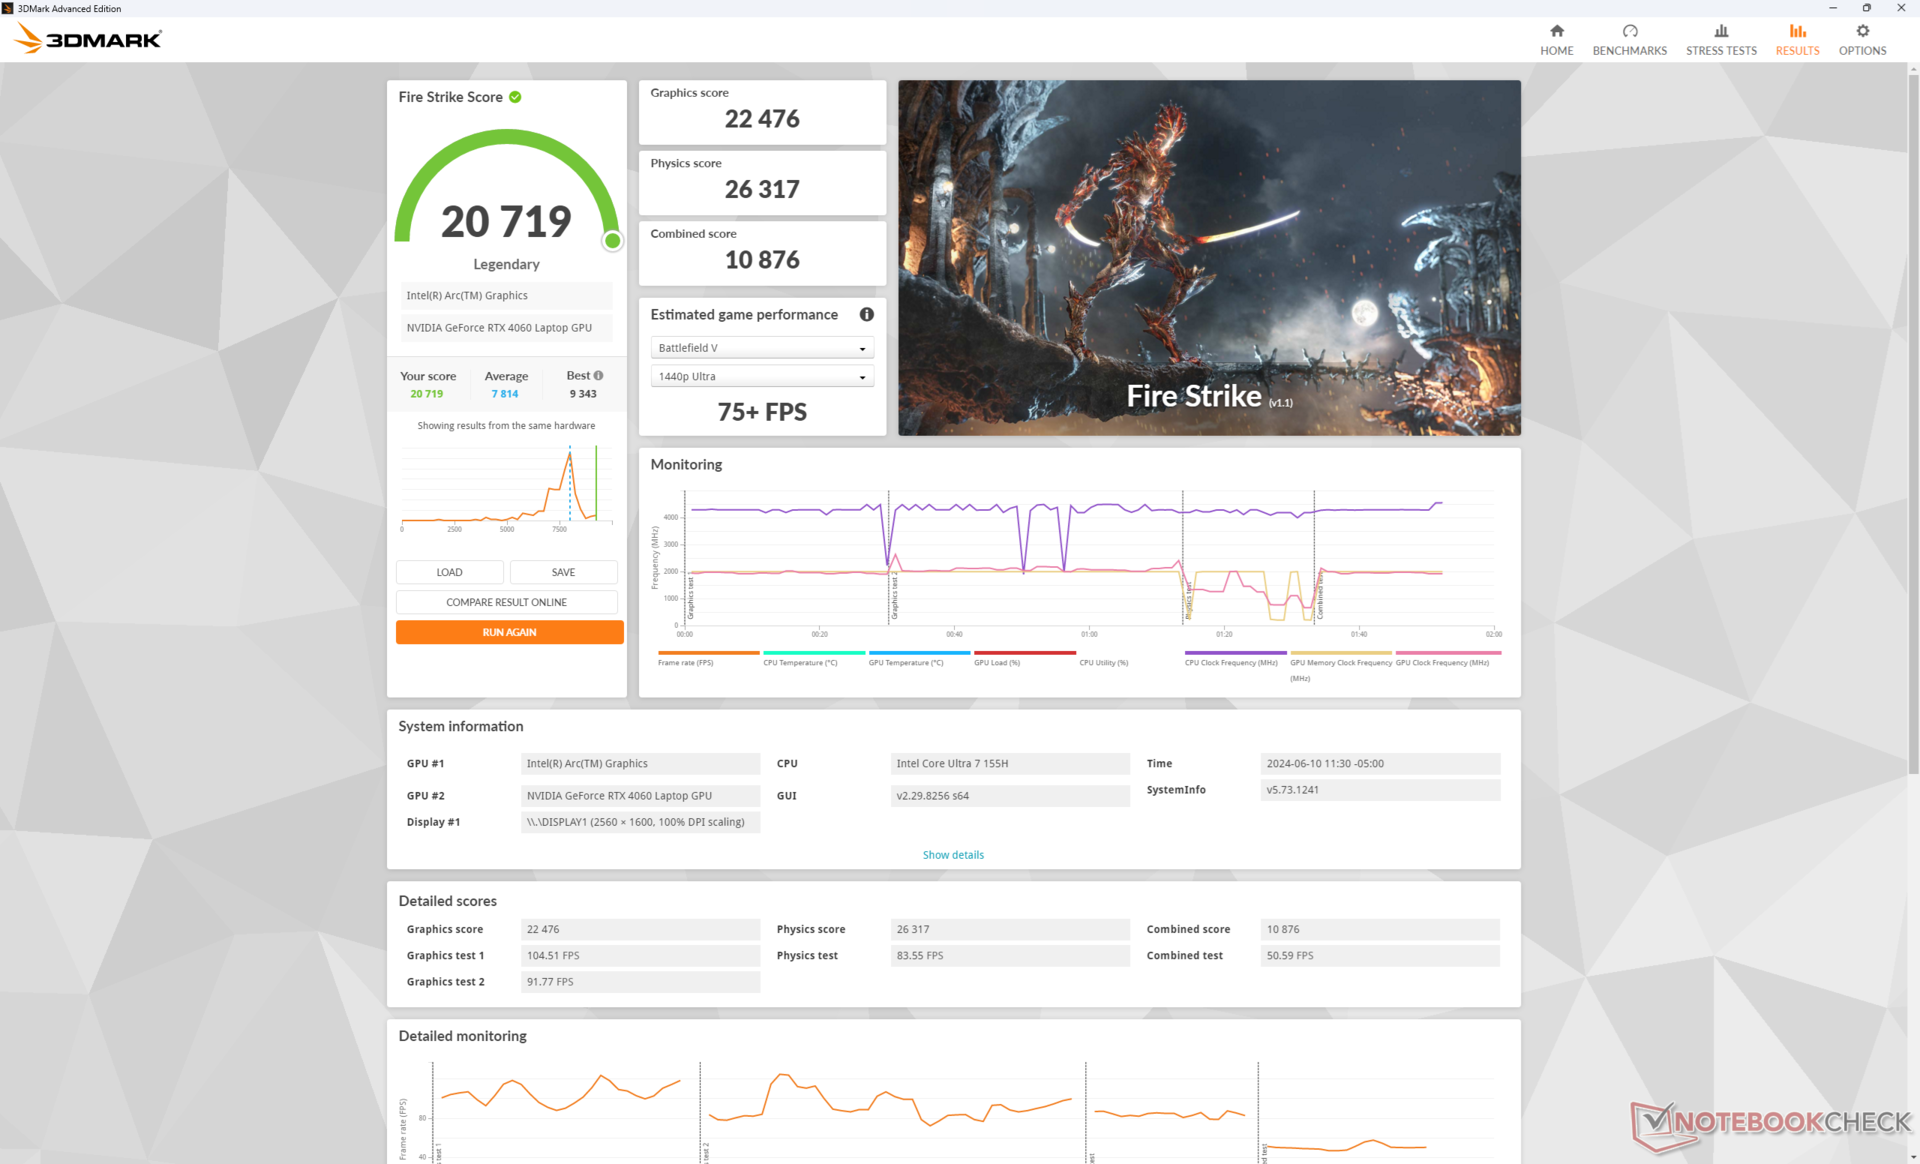
| Teljesítményprofil | Grafikus pontszám | Fizikai pontszám | Kombinált pontszám |
| Teljesítmény mód | 22476 | 26317 | 10876 |
| Kiegyensúlyozott mód | 22542 (-0%) | 27226 (-0%) | 10829 (-0%) |
| Akkumulátor teljesítmény | 21957 (-2%) | 26817 (-0%) | 9623 (-12%) |
A Teljesítmény üzemmód helyett a Kiegyensúlyozott üzemmódban történő futtatás nem befolyásolja jelentősen a teljesítményt, amint azt a fenti Fire Strike eredménytáblázat is mutatja. Még az akkumulátoros üzemmódban történő futtatás is elég jól megőrzi a teljesítményt.
| 3DMark Performance Rating - Percent | |
| Acer Nitro 16 AN16-41 | |
| Lenovo Legion 5 16IRX G9 | |
| Framework Laptop 16 | |
| Átlagos NVIDIA GeForce RTX 4060 Laptop GPU | |
| Lenovo Legion S7 16ARHA7 | |
| Acer Nitro 16 AN16-41-R7YE | |
| Dell Inspiron 16 Plus 7640 | |
| Dell Inspiron 16 Plus 7630 | |
| Asus VivoBook Pro 16 K6602VU | |
| Dell Inspiron 16 Plus 7620 | |
| Acer Swift Edge SFE16 Ryzen 7 7840U | |
| Lenovo Yoga 7 2-in-1 16IML9 | |
| Lenovo ThinkPad E16 G1-21JUS08X00 | |
| Lenovo ThinkBook 16 G6 ABP | |
| 3DMark 11 - 1280x720 Performance GPU | |
| Acer Nitro 16 AN16-41 | |
| Framework Laptop 16 | |
| Lenovo Legion 5 16IRX G9 | |
| Lenovo Legion S7 16ARHA7 | |
| Átlagos NVIDIA GeForce RTX 4060 Laptop GPU (28136 - 38912, n=57) | |
| Acer Nitro 16 AN16-41-R7YE | |
| Dell Inspiron 16 Plus 7640 | |
| Dell Inspiron 16 Plus 7630 | |
| Asus VivoBook Pro 16 K6602VU | |
| Dell Inspiron 16 Plus 7620 | |
| Acer Swift Edge SFE16 Ryzen 7 7840U | |
| Lenovo Yoga 7 2-in-1 16IML9 | |
| Lenovo ThinkPad E16 G1-21JUS08X00 | |
| Lenovo ThinkBook 16 G6 ABP | |
| 3DMark 11 Performance | 21491 pontok | |
| 3DMark Fire Strike Score | 20719 pontok | |
| 3DMark Time Spy Score | 8576 pontok | |
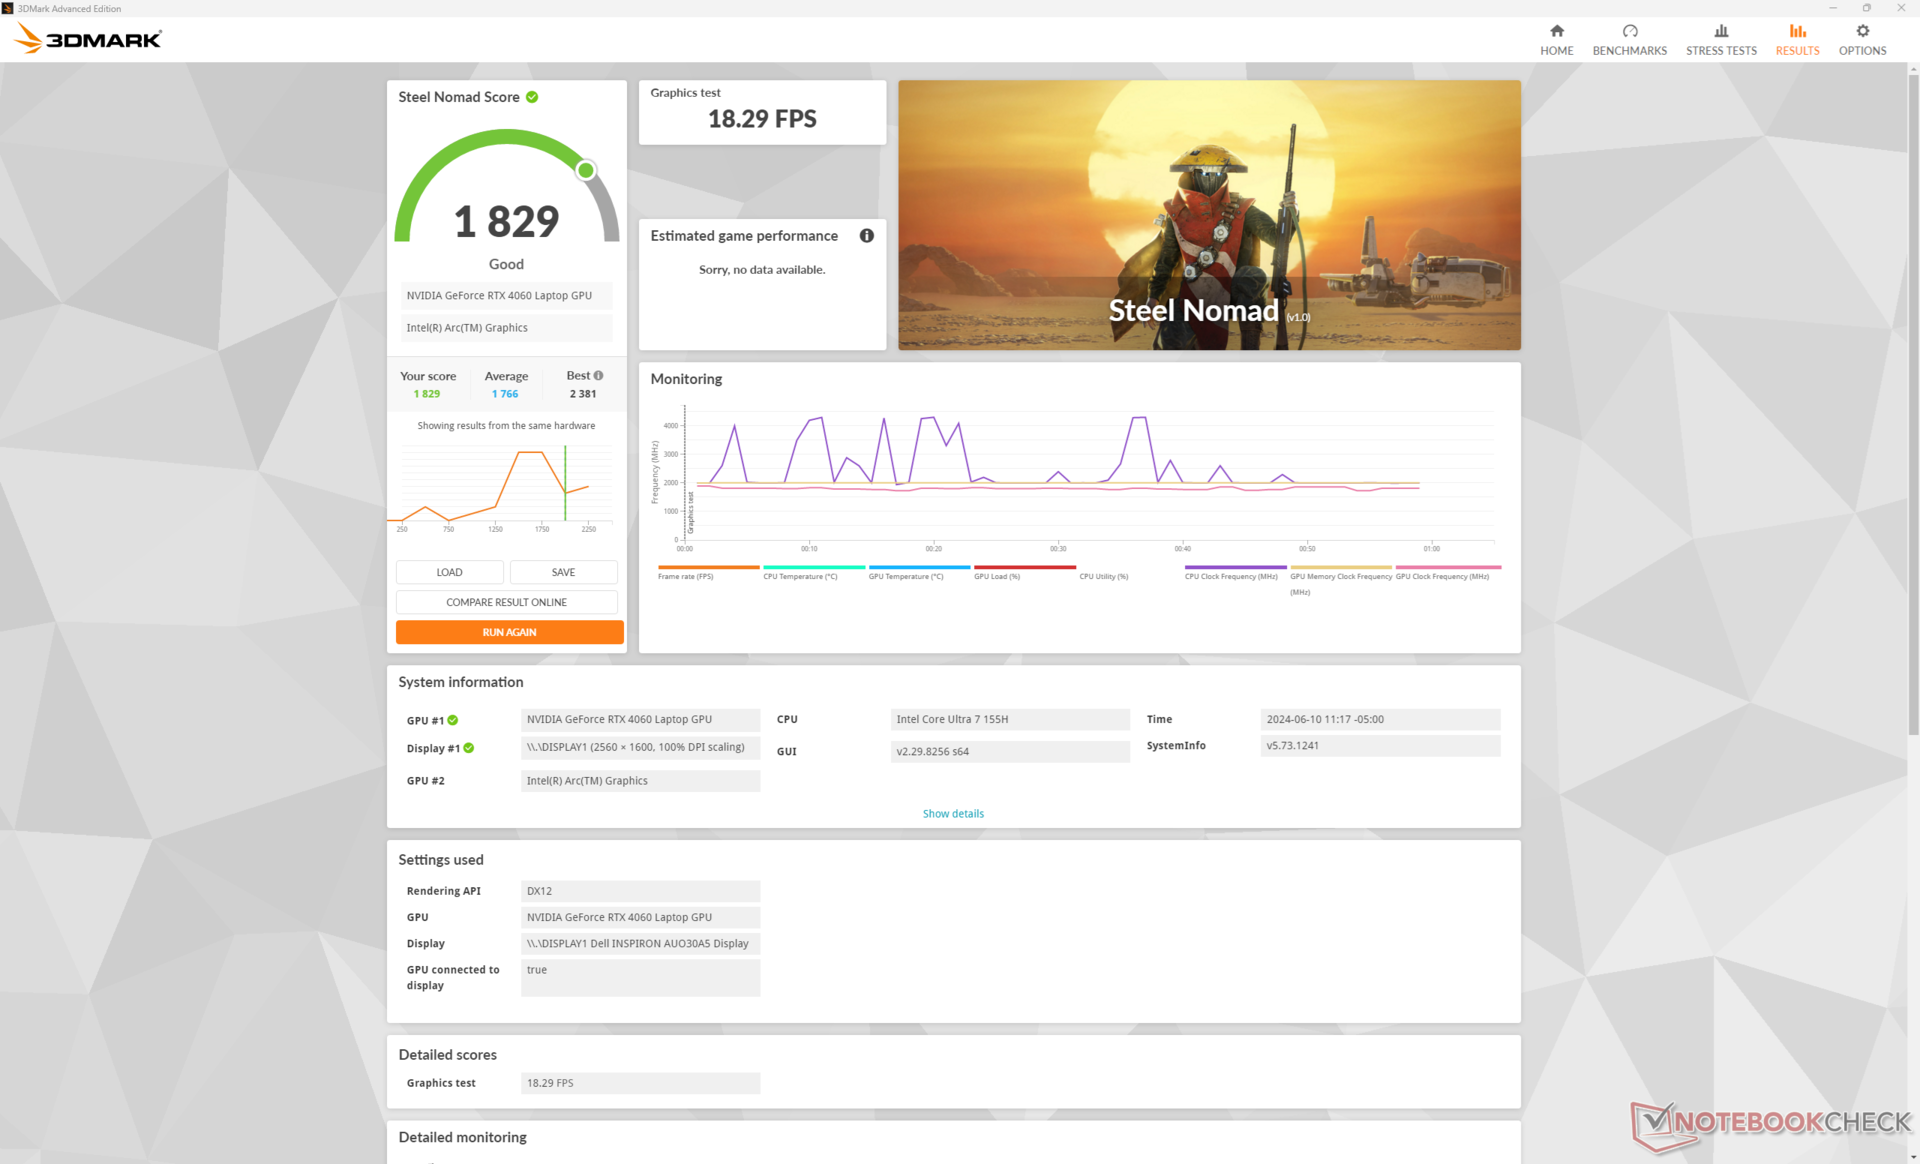
| 3DMark Steel Nomad Score | 1829 pontok | |
Segítség | ||
* ... a kisebb jobb
Játékteljesítmény
A játékokban nyújtott teljesítmény nem változott, sőt, talán még kissé rosszabb is, mint korábban. A Final Fantasy XV például 10 százalékkal lassabban futhat, mint az Inspiron 16 Plus 7630-on, és kisebb lemaradások figyelhetők meg más játékoknál is, például az F1 22 és a Strange Brigade esetében.
| Performance Rating - Percent | |
| Lenovo Legion 5 16IRX G9 | |
| Dell Inspiron 16 Plus 7630 | |
| Dell Inspiron 16 Plus 7640 | |
| Asus VivoBook Pro 16 K6602VU | |
| Dell Inspiron 16 Plus 7620 -1! | |
| Samsung Galaxy Book4 Ultra | |
| The Witcher 3 - 1920x1080 Ultra Graphics & Postprocessing (HBAO+) | |
| Lenovo Legion 5 16IRX G9 | |
| Dell Inspiron 16 Plus 7630 | |
| Dell Inspiron 16 Plus 7640 | |
| Asus VivoBook Pro 16 K6602VU | |
| Dell Inspiron 16 Plus 7620 | |
| Samsung Galaxy Book4 Ultra | |
| Final Fantasy XV Benchmark - 1920x1080 High Quality | |
| Lenovo Legion 5 16IRX G9 | |
| Dell Inspiron 16 Plus 7630 | |
| Dell Inspiron 16 Plus 7640 | |
| Asus VivoBook Pro 16 K6602VU | |
| Samsung Galaxy Book4 Ultra | |
| Dell Inspiron 16 Plus 7620 | |
| Strange Brigade - 1920x1080 ultra AA:ultra AF:16 | |
| Lenovo Legion 5 16IRX G9 | |
| Dell Inspiron 16 Plus 7630 | |
| Dell Inspiron 16 Plus 7640 | |
| Asus VivoBook Pro 16 K6602VU | |
| Samsung Galaxy Book4 Ultra | |
| Dell Inspiron 16 Plus 7620 | |
| Dota 2 Reborn - 1920x1080 ultra (3/3) best looking | |
| Lenovo Legion 5 16IRX G9 | |
| Dell Inspiron 16 Plus 7630 | |
| Dell Inspiron 16 Plus 7620 | |
| Dell Inspiron 16 Plus 7640 | |
| Samsung Galaxy Book4 Ultra | |
| Asus VivoBook Pro 16 K6602VU | |
| X-Plane 11.11 - 1920x1080 high (fps_test=3) | |
| Lenovo Legion 5 16IRX G9 | |
| Dell Inspiron 16 Plus 7630 | |
| Asus VivoBook Pro 16 K6602VU | |
| Dell Inspiron 16 Plus 7620 | |
| Dell Inspiron 16 Plus 7640 | |
| Samsung Galaxy Book4 Ultra | |
| Far Cry 5 - 1920x1080 Ultra Preset AA:T | |
| Lenovo Legion 5 16IRX G9 | |
| Dell Inspiron 16 Plus 7640 | |
| Asus VivoBook Pro 16 K6602VU | |
| Dell Inspiron 16 Plus 7630 | |
| Samsung Galaxy Book4 Ultra | |
| Baldur's Gate 3 | |
| 1920x1080 Low Preset | |
| Átlagos NVIDIA GeForce RTX 4060 Laptop GPU (102.8 - 160.3, n=15) | |
| Dell Inspiron 16 Plus 7640 | |
| Framework Laptop 16 | |
| Lenovo Yoga 7 2-in-1 16IML9 | |
| 1920x1080 Medium Preset | |
| Átlagos NVIDIA GeForce RTX 4060 Laptop GPU (77.5 - 125.7, n=18) | |
| Dell Inspiron 16 Plus 7640 | |
| Framework Laptop 16 | |
| 1920x1080 High Preset | |
| Átlagos NVIDIA GeForce RTX 4060 Laptop GPU (68.7 - 110.7, n=18) | |
| Dell Inspiron 16 Plus 7640 | |
| Framework Laptop 16 | |
| 1920x1080 Ultra Preset | |
| Átlagos NVIDIA GeForce RTX 4060 Laptop GPU (66.5 - 105.5, n=19) | |
| Dell Inspiron 16 Plus 7640 | |
| Framework Laptop 16 | |
| 2560x1440 Ultra Preset | |
| Átlagos NVIDIA GeForce RTX 4060 Laptop GPU (45.2 - 72.2, n=14) | |
| Dell Inspiron 16 Plus 7640 | |
| Framework Laptop 16 | |
| Cyberpunk 2077 2.2 Phantom Liberty | |
| 1920x1080 Low Preset (FSR off) | |
| Lenovo Legion 5 16IRX G9 | |
| Átlagos NVIDIA GeForce RTX 4060 Laptop GPU (96.7 - 136.1, n=22) | |
| Framework Laptop 16 | |
| Dell Inspiron 16 Plus 7640 | |
| Lenovo Yoga 7 2-in-1 16IML9 | |
| 1920x1080 Medium Preset (FSR off) | |
| Lenovo Legion 5 16IRX G9 | |
| Átlagos NVIDIA GeForce RTX 4060 Laptop GPU (77.7 - 110.4, n=23) | |
| Dell Inspiron 16 Plus 7640 | |
| Framework Laptop 16 | |
| Lenovo Yoga 7 2-in-1 16IML9 | |
| 1920x1080 High Preset (FSR off) | |
| Lenovo Legion 5 16IRX G9 | |
| Átlagos NVIDIA GeForce RTX 4060 Laptop GPU (65.2 - 102, n=26) | |
| Dell Inspiron 16 Plus 7640 | |
| Framework Laptop 16 | |
| Lenovo Yoga 7 2-in-1 16IML9 | |
| 1920x1080 Ultra Preset (FSR off) | |
| Lenovo Legion 5 16IRX G9 | |
| Átlagos NVIDIA GeForce RTX 4060 Laptop GPU (56.4 - 93.1, n=31) | |
| Framework Laptop 16 | |
| Dell Inspiron 16 Plus 7640 | |
| Lenovo Yoga 7 2-in-1 16IML9 | |
| 2560x1440 Ultra Preset (FSR off) | |
| Lenovo Legion 5 16IRX G9 | |
| Átlagos NVIDIA GeForce RTX 4060 Laptop GPU (32.9 - 51.8, n=19) | |
| Framework Laptop 16 | |
| Dell Inspiron 16 Plus 7640 | |
Witcher 3 FPS Chart
| alacsony | közepes | magas | ultra | QHD | |
|---|---|---|---|---|---|
| The Witcher 3 (2015) | 375.8 | 276.8 | 160.3 | 84.1 | 61.9 |
| Dota 2 Reborn (2015) | 173.5 | 152.1 | 143.2 | 135.1 | |
| Final Fantasy XV Benchmark (2018) | 137.6 | 98.4 | 78.8 | 58.8 | |
| X-Plane 11.11 (2018) | 123.7 | 109 | 86.5 | ||
| Far Cry 5 (2018) | 138 | 125 | 118 | 110 | 83 |
| Strange Brigade (2018) | 360 | 225 | 178.1 | 153.5 | 105.2 |
| Tiny Tina's Wonderlands (2022) | 177.4 | 116 | 91.9 | 71.1 | 48 |
| F1 22 (2022) | 197 | 184.3 | 151.3 | 51.8 | 32.1 |
| Baldur's Gate 3 (2023) | 111.1 | 93.2 | 82.4 | 76.7 | 53.2 |
| Cyberpunk 2077 2.2 Phantom Liberty (2023) | 96.8 | 83.1 | 69.9 | 59.8 | 36.8 |
Kibocsátás
Rendszerzaj - Hangos játék közben
A belső ventilátorok hosszabb ideig képesek csendesebbek maradni, mint a tavalyi modellnél. A 3DMark 06 futtatásakor például a ventilátorok zaja az első benchmark jelenet végéig 29 dB(A) körül mozog, míg az Inspiron 16 Plus 7630 sokkal hangosabb, 35 dB(A). A két laptop egyébként 50 dB(A) fölött stabilizálódik, amikor hosszabb időn keresztül igényesebb terhelést, például játékokat futtat.
Zajszint
| Üresjárat |
| 24.2 / 24.2 / 24.2 dB(A) |
| Terhelés |
| 28.9 / 51 dB(A) |
 | ||
30 dB csendes 40 dB(A) hallható 50 dB(A) hangos |
||
min: | ||
| Dell Inspiron 16 Plus 7640 NVIDIA GeForce RTX 4060 Laptop GPU, Ultra 7 155H, SK hynix BC901 HFS001TEJ4X164N | Dell Inspiron 16 Plus 7630 NVIDIA GeForce RTX 4060 Laptop GPU, i7-13700H, WD PC SN740 SDDPTQD-1T00 | Dell Inspiron 16 Plus 7620 GeForce RTX 3050 Ti Laptop GPU, i7-12700H, Kioxia BG5 KBG50ZNS512G | Samsung Galaxy Book4 Ultra NVIDIA GeForce RTX 4050 Laptop GPU, Ultra 7 155H, Samsung PM9A1 MZVL2512HCJQ | Lenovo Legion 5 16IRX G9 NVIDIA GeForce RTX 4060 Laptop GPU, i7-14650HX, Samsung PM9A1 MZVL21T0HCLR | Asus VivoBook Pro 16 K6602VU NVIDIA GeForce RTX 4050 Laptop GPU, i9-13900H, Micron 2400 MTFDKBA1T0QFM | |
|---|---|---|---|---|---|---|
| Noise | -2% | -13% | 0% | -17% | -11% | |
| off / környezet * | 23.8 | 23.2 3% | 23.3 2% | 24.2 -2% | 24 -1% | 20.96 12% |
| Idle Minimum * | 24.2 | 23.2 4% | 25.7 -6% | 24.2 -0% | 24 1% | 25.28 -4% |
| Idle Average * | 24.2 | 23.2 4% | 26.1 -8% | 24.2 -0% | 28.8 -19% | 25.28 -4% |
| Idle Maximum * | 24.2 | 23.2 4% | 30.6 -26% | 24.2 -0% | 32 -32% | 25.28 -4% |
| Load Average * | 28.9 | 35.1 -21% | 46.2 -60% | 37.9 -31% | 45.5 -57% | 51.88 -80% |
| Witcher 3 ultra * | 51 | 52.5 -3% | 49.2 4% | 41.7 18% | 53.1 -4% | 49 4% |
| Load Maximum * | 51 | 52.5 -3% | 49.4 3% | 41.7 18% | 55.7 -9% | 51.8 -2% |
* ... a kisebb jobb
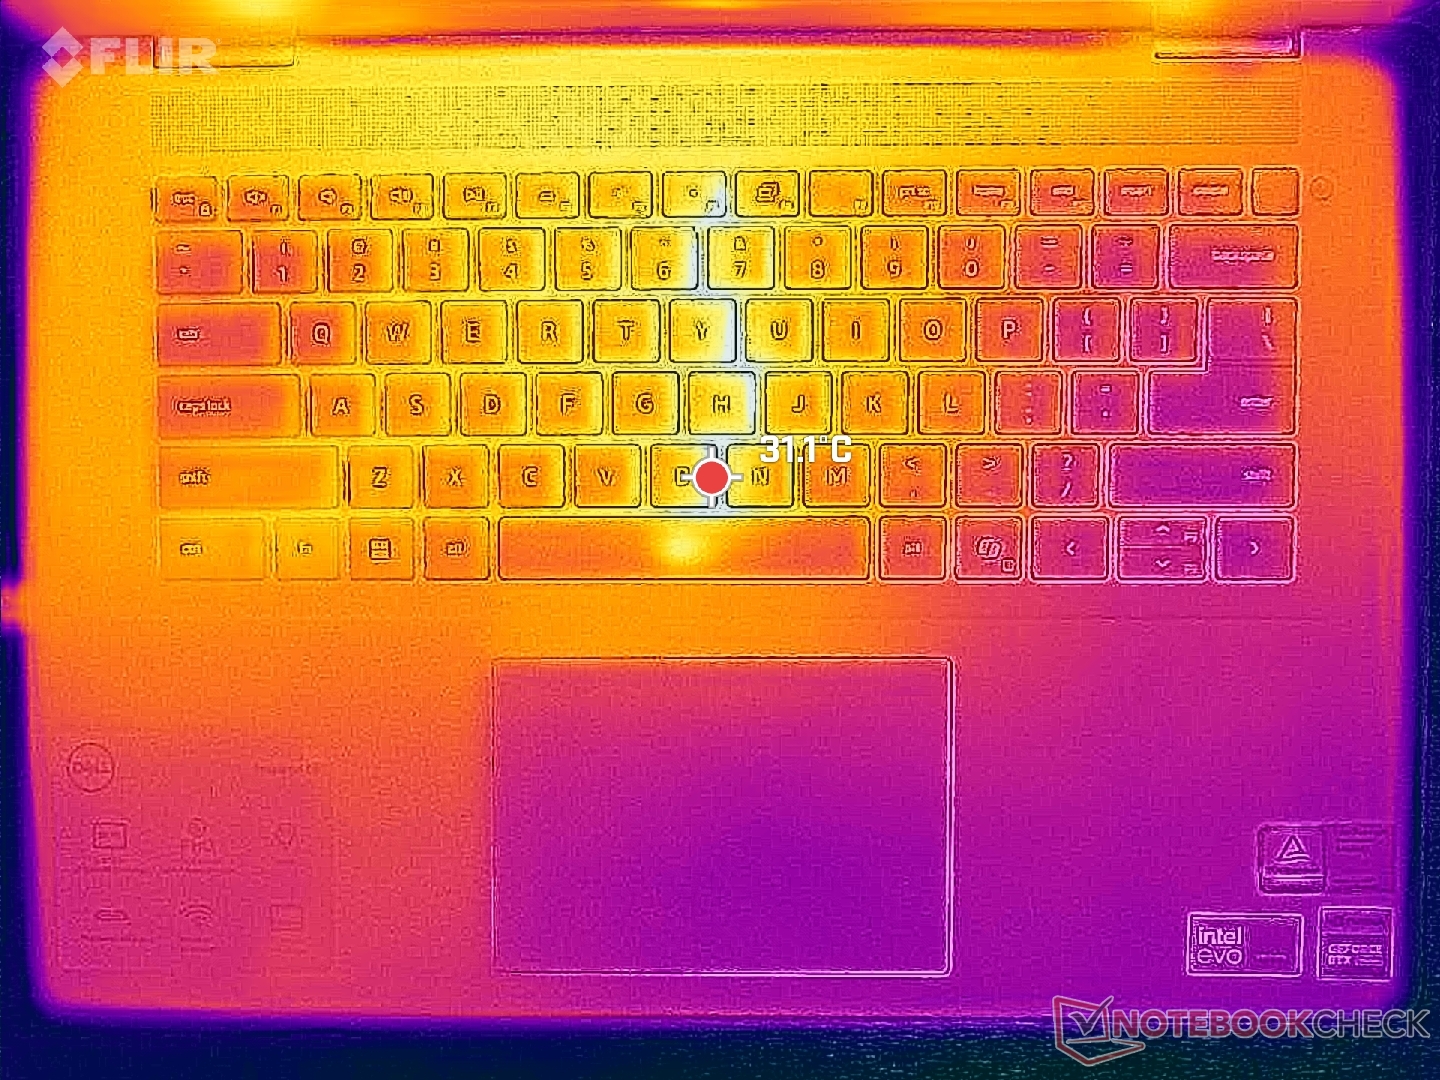
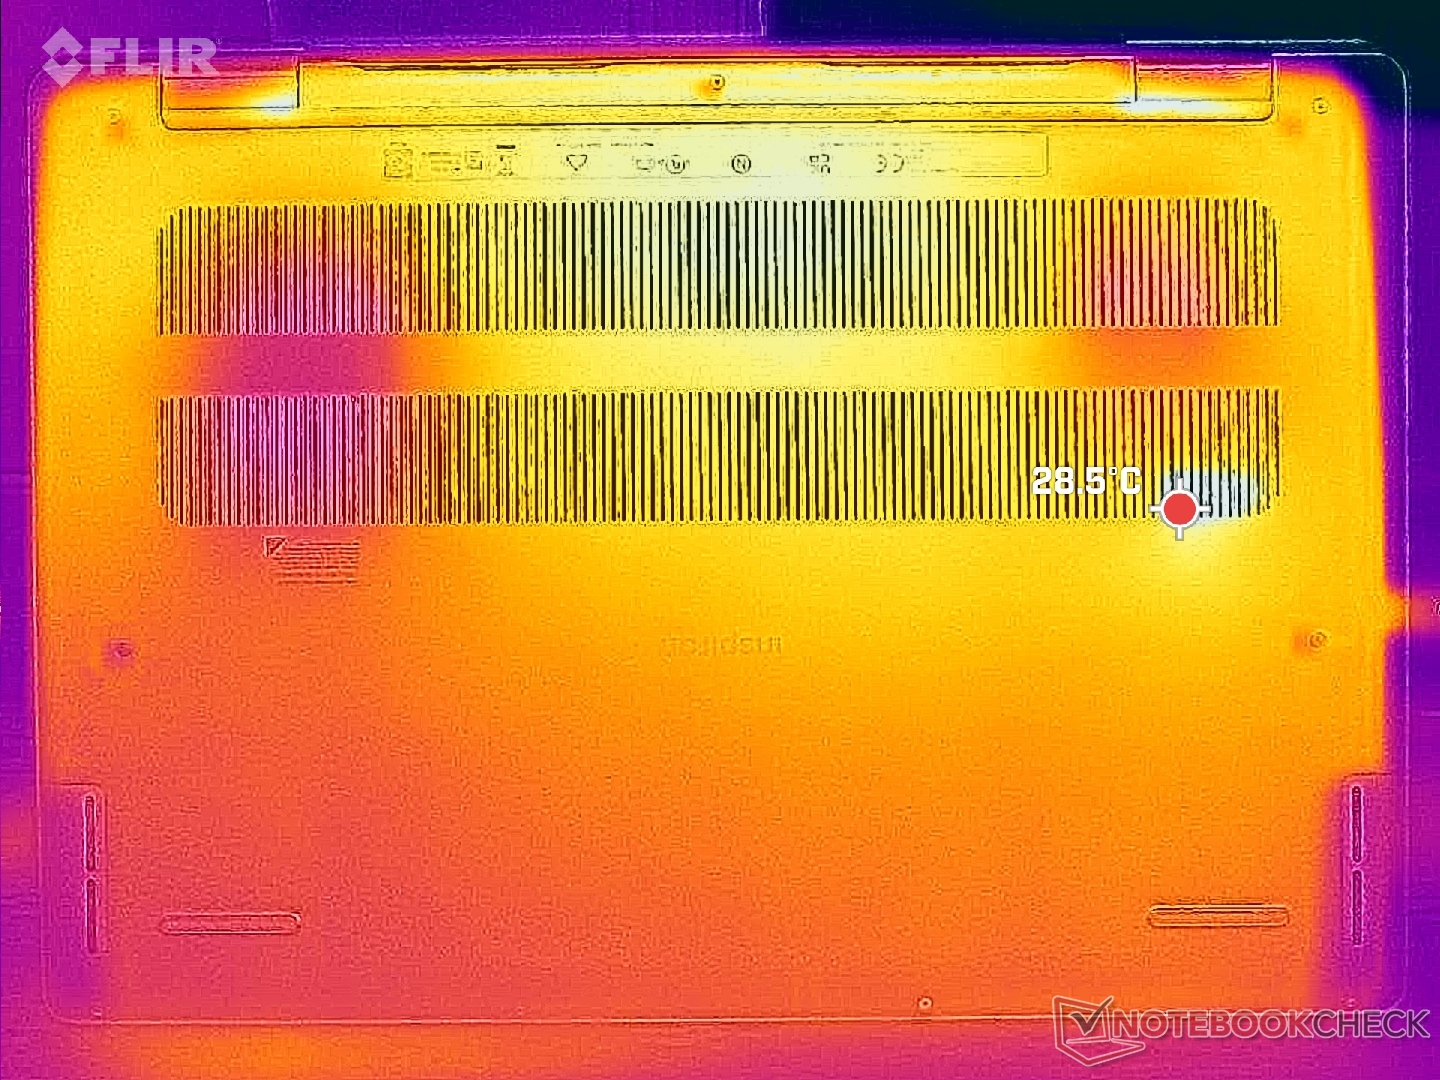
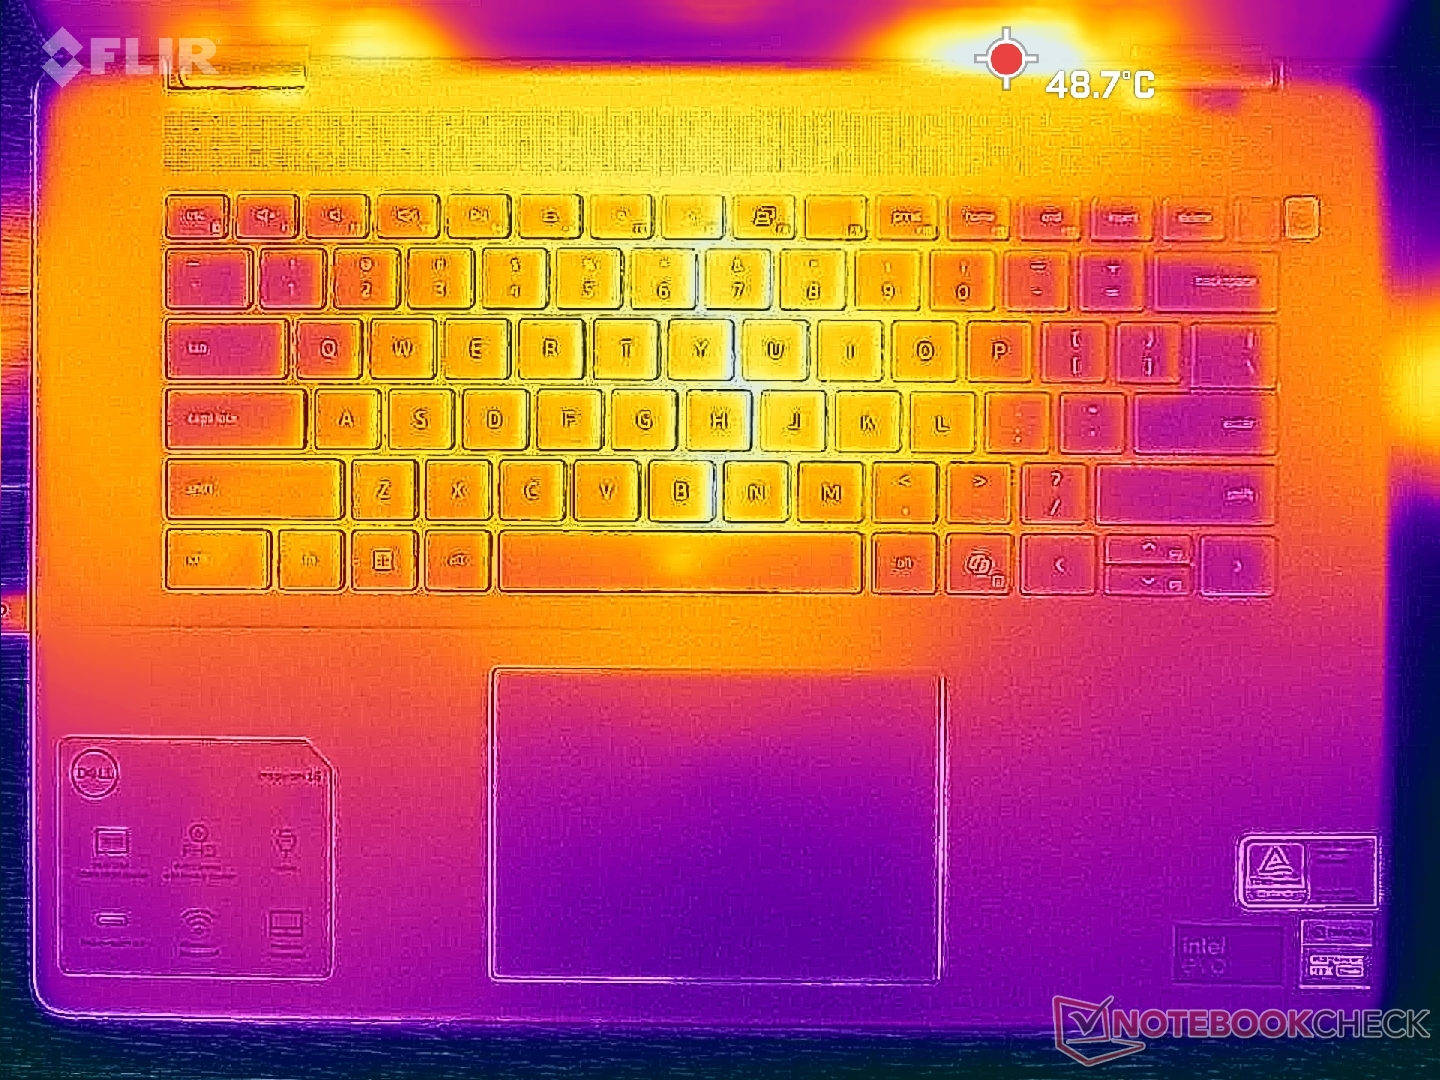
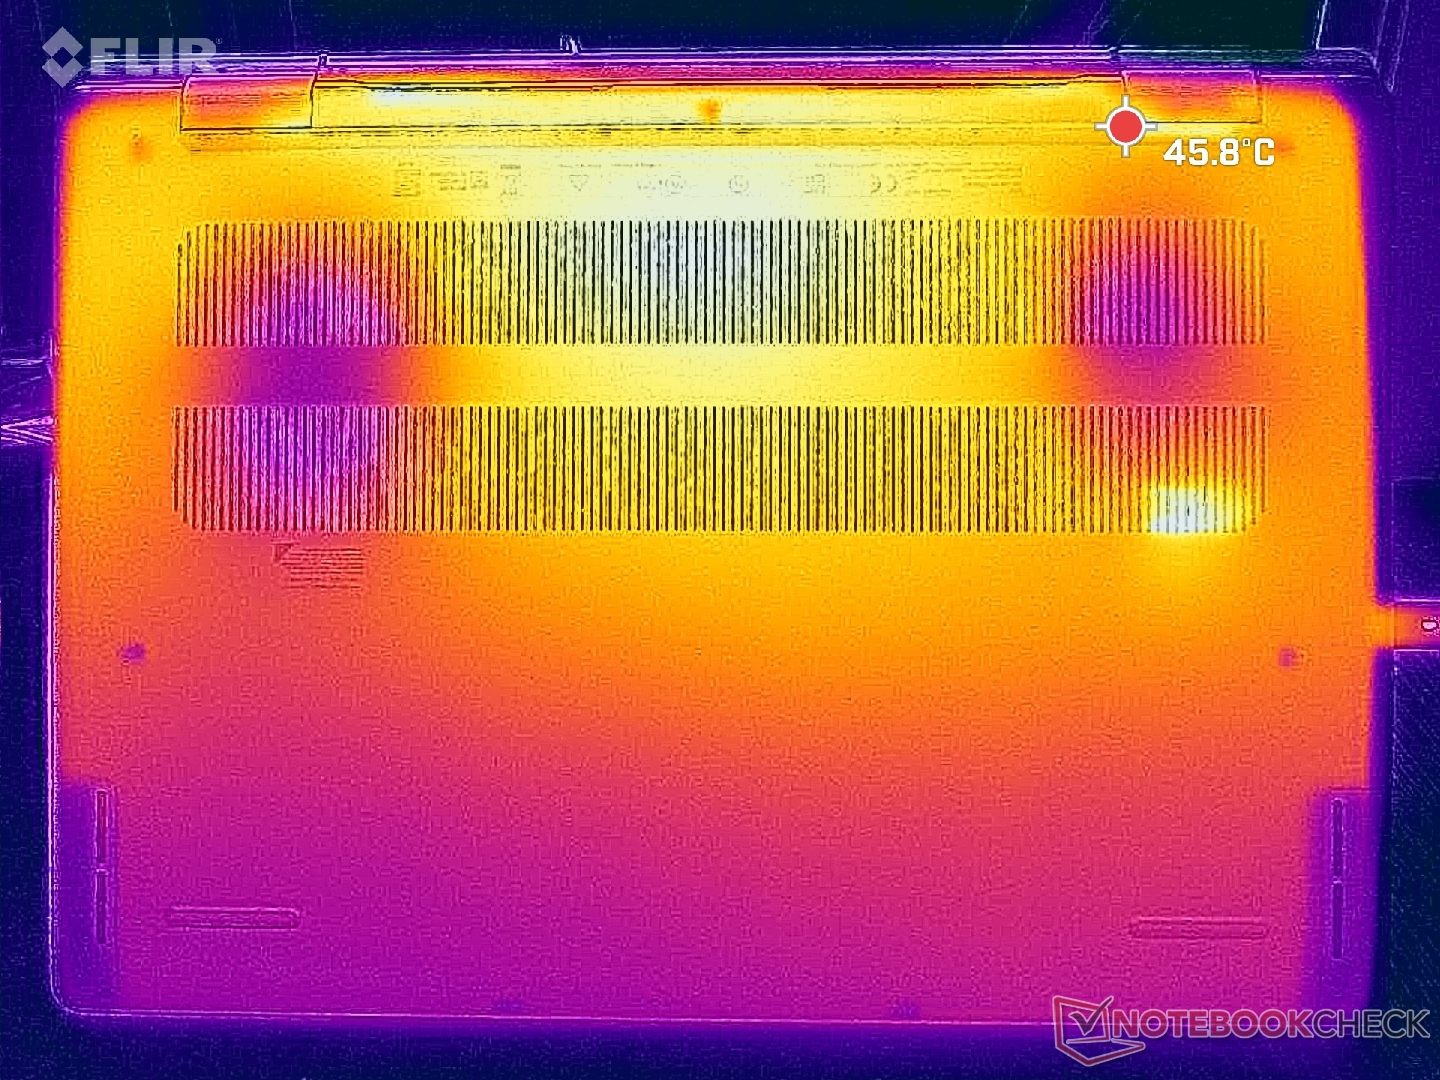
Hőmérséklet
A felszíni hőmérséklet a széleken elhelyezett sok szellőzőrács ellenére eléggé felmelegedhet. A forró pontok játék közben elérhetik a 43 C fokot mind a C, mind a D burkolaton, hogy összehasonlítható legyen a Lenovo Legion 5i 16 G9 gaming laptophoz.
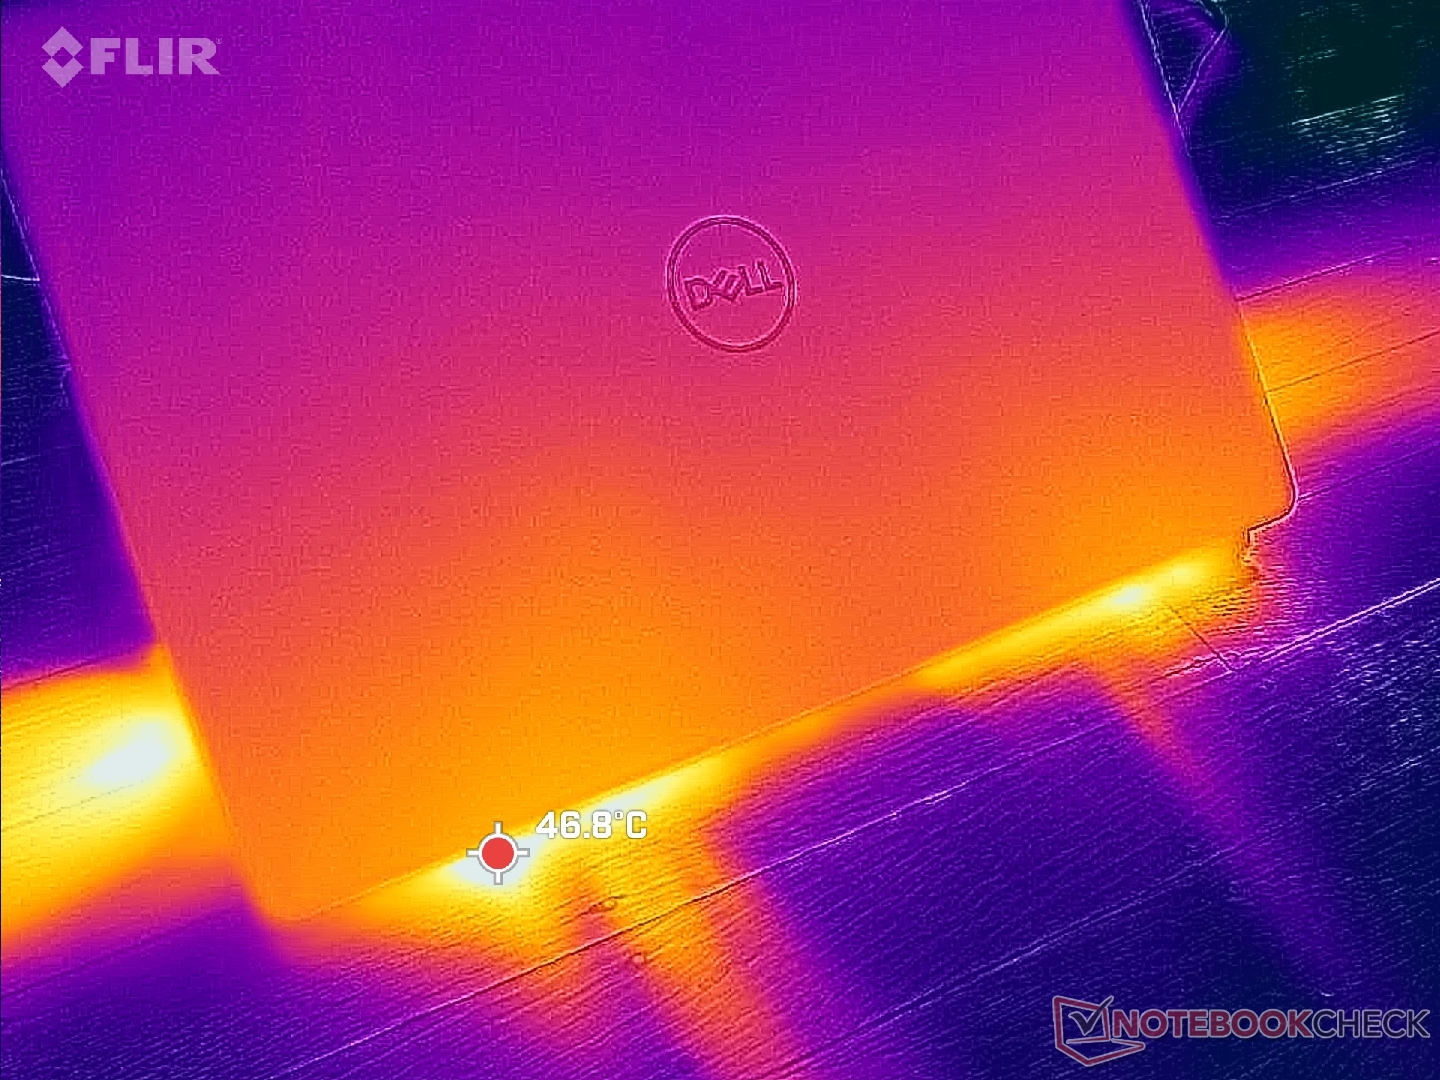
(±) A felső oldalon a maximális hőmérséklet 43.4 °C / 110 F, összehasonlítva a 36.9 °C / 98 F átlagával , 21.1 és 71 °C között a Multimedia osztálynál.
(±) Az alsó maximum 41.6 °C / 107 F-ig melegszik fel, összehasonlítva a 39.2 °C / 103 F átlagával
(+) Üresjáratban a felső oldal átlagos hőmérséklete 29.9 °C / 86 F, összehasonlítva a 31.3 °C / ### eszközátlaggal class_avg_f### F.
(+) A csuklótámasz és az érintőpad eléri a bőr maximális hőmérsékletét (35.2 °C / 95.4 F), ezért nem forrók.
(-) A hasonló eszközök csuklótámasz területének átlagos hőmérséklete 28.8 °C / 83.8 F volt (-6.4 °C / -11.6 F).
| Dell Inspiron 16 Plus 7640 Intel Core Ultra 7 155H, NVIDIA GeForce RTX 4060 Laptop GPU | Dell Inspiron 16 Plus 7630 Intel Core i7-13700H, NVIDIA GeForce RTX 4060 Laptop GPU | Dell Inspiron 16 Plus 7620 Intel Core i7-12700H, NVIDIA GeForce RTX 3050 Ti Laptop GPU | Samsung Galaxy Book4 Ultra Intel Core Ultra 7 155H, NVIDIA GeForce RTX 4050 Laptop GPU | Lenovo Legion 5 16IRX G9 Intel Core i7-14650HX, NVIDIA GeForce RTX 4060 Laptop GPU | Asus VivoBook Pro 16 K6602VU Intel Core i9-13900H, NVIDIA GeForce RTX 4050 Laptop GPU | |
|---|---|---|---|---|---|---|
| Heat | -7% | -0% | 17% | 0% | -14% | |
| Maximum Upper Side * | 43.4 | 47.8 -10% | 46 -6% | 38.5 11% | 40.4 7% | 42.6 2% |
| Maximum Bottom * | 41.6 | 42.2 -1% | 45.8 -10% | 41.2 1% | 43.8 -5% | 48.4 -16% |
| Idle Upper Side * | 32.8 | 35.2 -7% | 29.2 11% | 23.5 28% | 30.3 8% | 39.4 -20% |
| Idle Bottom * | 32.4 | 35 -8% | 31 4% | 24.1 26% | 35.3 -9% | 39.8 -23% |
* ... a kisebb jobb
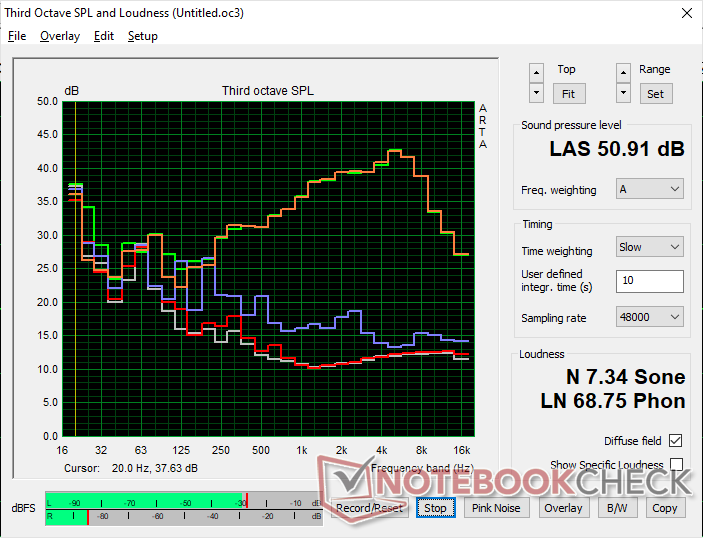
Hangszórók
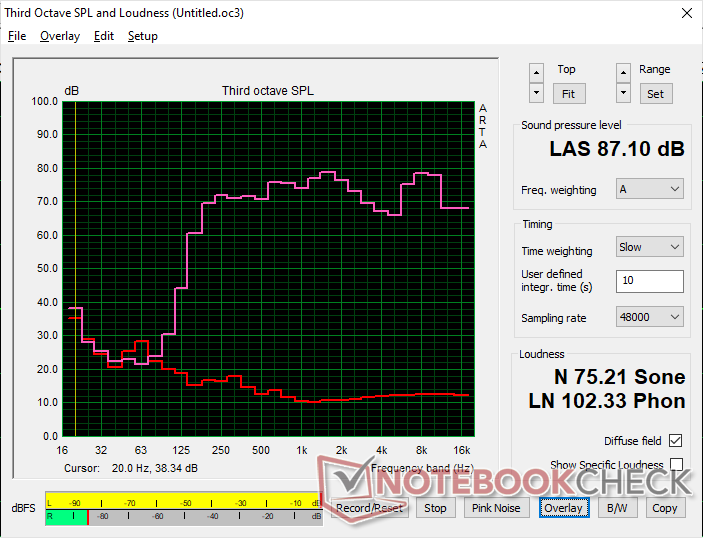
Dell Inspiron 16 Plus 7640 hangelemzés
(+) | a hangszórók viszonylag hangosan tudnak játszani (87.1 dB)
Basszus 100 - 315 Hz
(±) | csökkentett basszus – átlagosan 13.9%-kal alacsonyabb, mint a medián
(±) | a basszus linearitása átlagos (13.7% delta az előző frekvenciához)
Közepes 400-2000 Hz
(+) | kiegyensúlyozott középpontok – csak 3.6% választja el a mediántól
(+) | a középpontok lineárisak (3.4% delta az előző frekvenciához)
Maximum 2-16 kHz
(+) | kiegyensúlyozott csúcsok – csak 4.3% választja el a mediántól
(+) | a csúcsok lineárisak (5.7% delta az előző frekvenciához képest)
Összességében 100 - 16.000 Hz
(+) | általános hangzás lineáris (11.3% eltérés a mediánhoz képest)
Ugyanazon osztályhoz képest
» 13%Ebben az osztályban az összes tesztelt eszköz %-a jobb volt, 4% hasonló, 83%-kal rosszabb
» A legjobb delta értéke 5%, az átlag 18%, a legrosszabb 45% volt
Az összes tesztelt eszközzel összehasonlítva
» 6% az összes tesztelt eszköz jobb volt, 2% hasonló, 92%-kal rosszabb
» A legjobb delta értéke 4%, az átlag 24%, a legrosszabb 134% volt
Apple MacBook Pro 16 2021 M1 Pro hangelemzés
(+) | a hangszórók viszonylag hangosan tudnak játszani (84.7 dB)
Basszus 100 - 315 Hz
(+) | jó basszus – csak 3.8% választja el a mediántól
(+) | a basszus lineáris (5.2% delta az előző frekvenciához)
Közepes 400-2000 Hz
(+) | kiegyensúlyozott középpontok – csak 1.3% választja el a mediántól
(+) | a középpontok lineárisak (2.1% delta az előző frekvenciához)
Maximum 2-16 kHz
(+) | kiegyensúlyozott csúcsok – csak 1.9% választja el a mediántól
(+) | a csúcsok lineárisak (2.7% delta az előző frekvenciához képest)
Összességében 100 - 16.000 Hz
(+) | általános hangzás lineáris (4.6% eltérés a mediánhoz képest)
Ugyanazon osztályhoz képest
» 0%Ebben az osztályban az összes tesztelt eszköz %-a jobb volt, 0% hasonló, 100%-kal rosszabb
» A legjobb delta értéke 5%, az átlag 18%, a legrosszabb 45% volt
Az összes tesztelt eszközzel összehasonlítva
» 0% az összes tesztelt eszköz jobb volt, 0% hasonló, 100%-kal rosszabb
» A legjobb delta értéke 4%, az átlag 24%, a legrosszabb 134% volt
Energiagazdálkodás
Energiafogyasztás
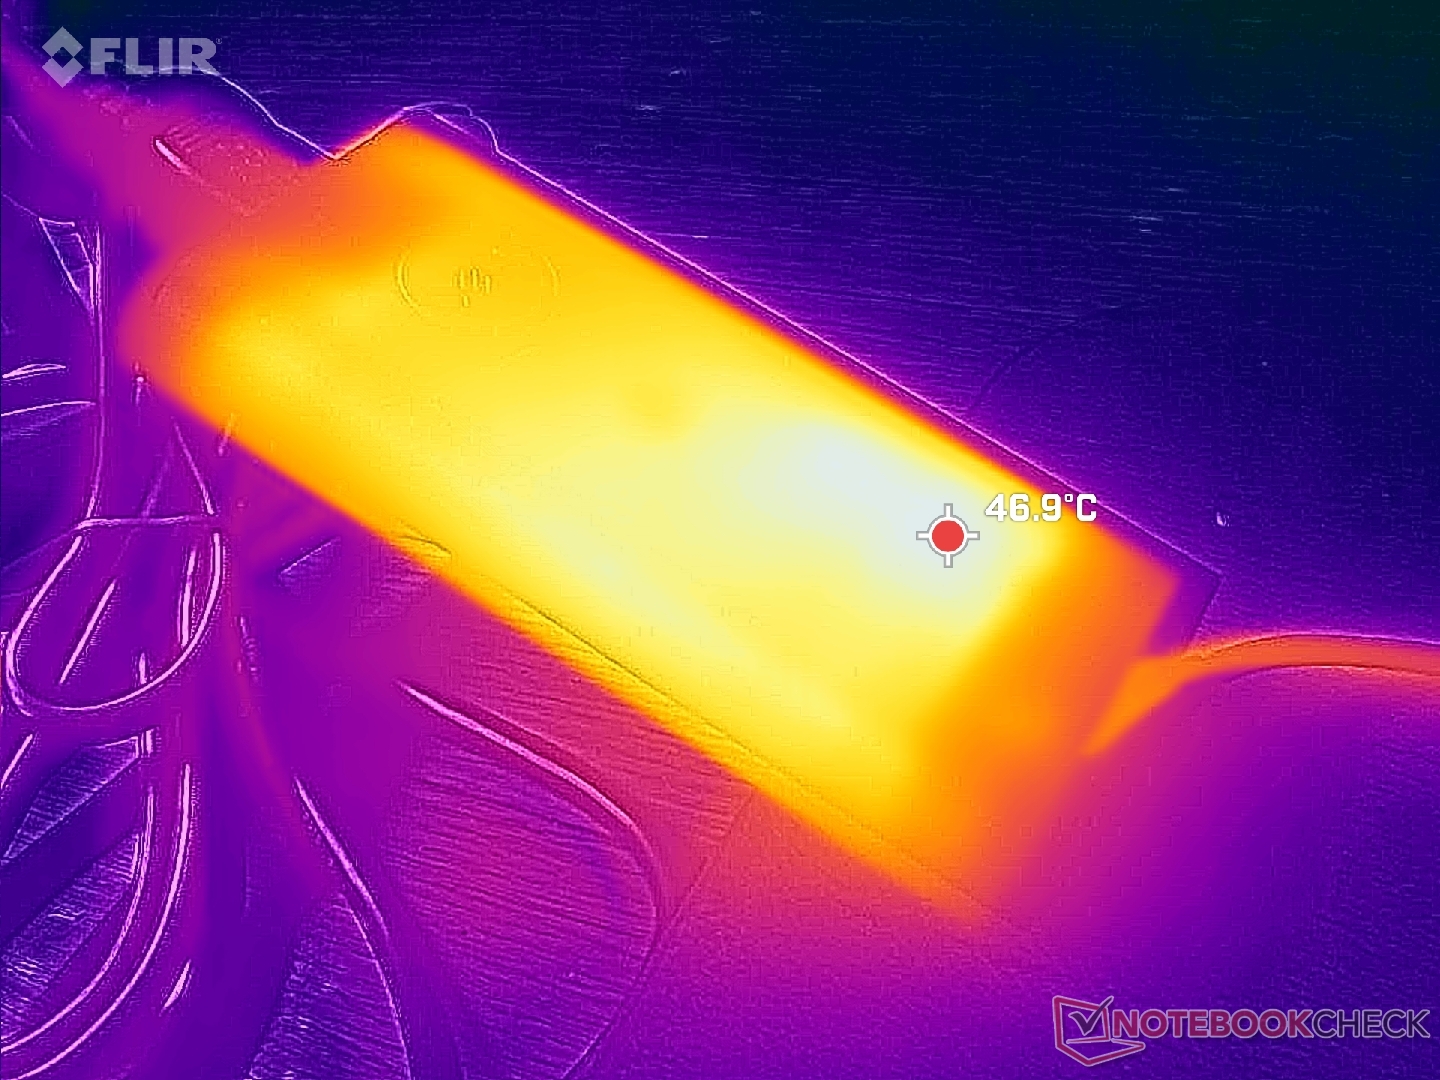
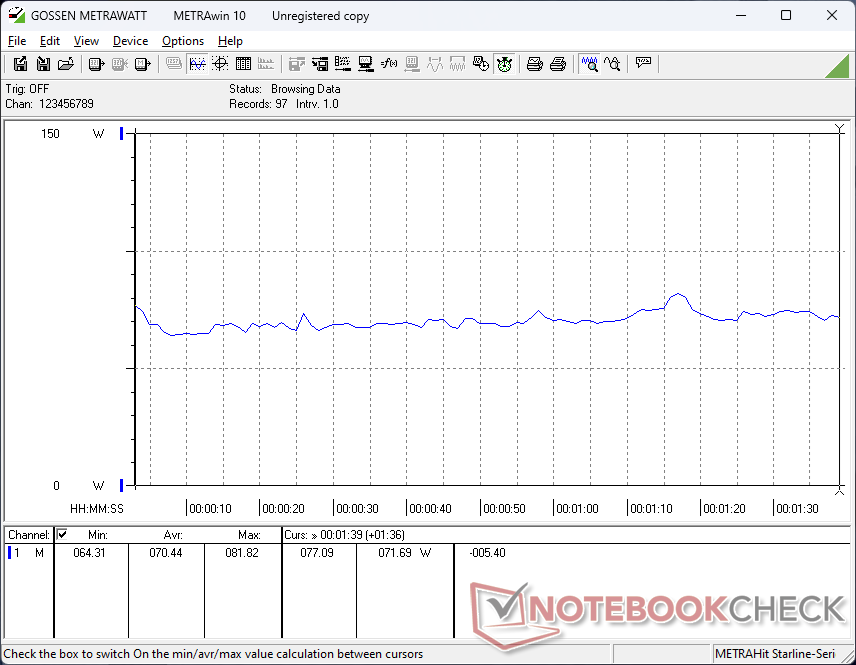
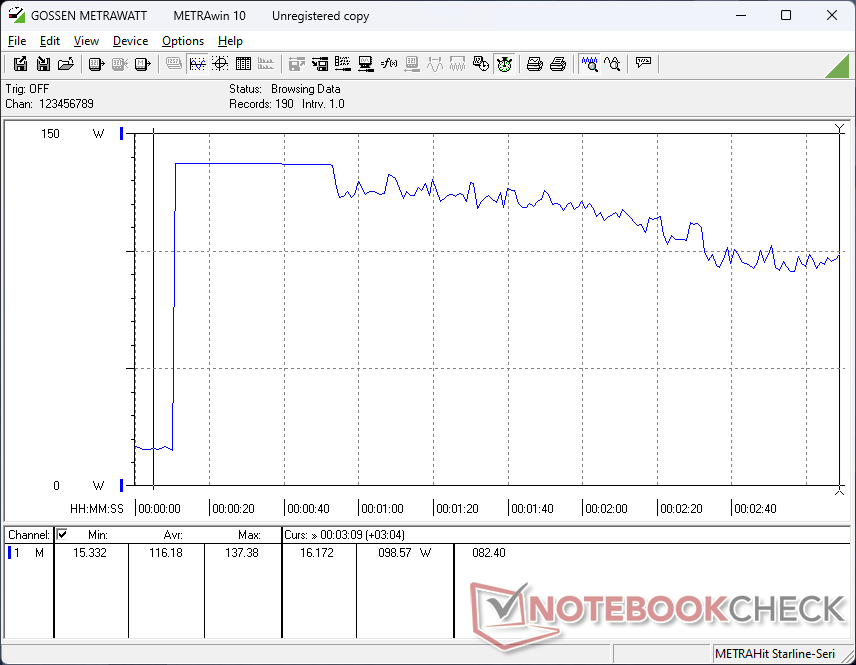
Az energiafogyasztás észrevehetően alacsonyabb, mint a tavalyi modellnél, amikor az asztali gép üresjáratban van, ami magyarázatot adhat az alábbiakban bemutatott, általában hosszabb akkumulátor-üzemidőre. A rendszer 4 W és 16 W között igényelne, szemben az Inspiron 16 Plus 7630 16 W és 21 W közötti értékével. A fogyasztás igényesebb alkalmazások, például játékok futtatásakor egyébként közel azonos, ha nem is valamivel alacsonyabb néhány wattal.
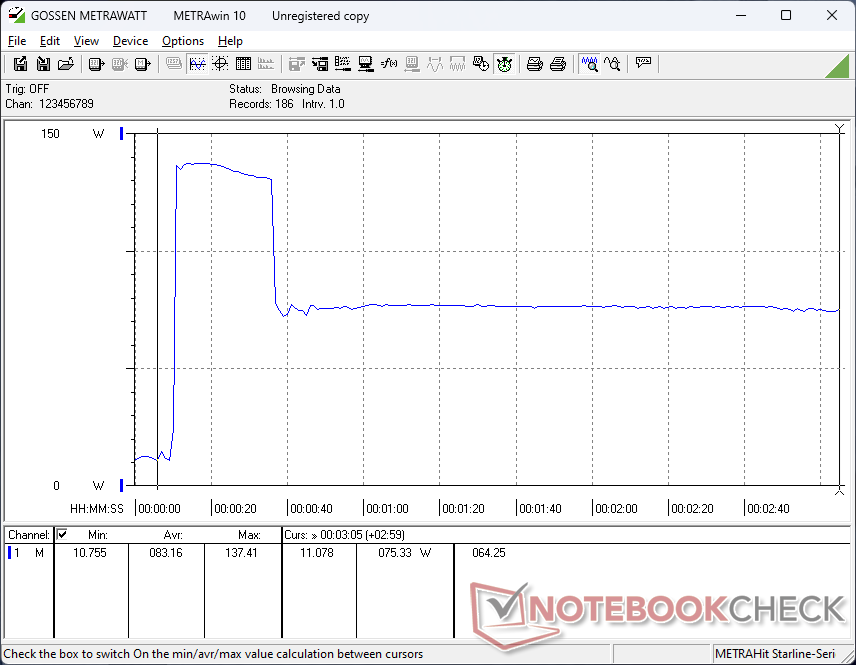
Érdekesség, hogy a modellhez egy univerzális, 130 W-os USB-C hálózati adaptert (~14,3 x 6,5 x 2,2 cm) mellékelnek a tavalyi modellhez mellékelt 130 W-os, saját fejlesztésű AC hordozható töltő helyett. A hordó AC adapter portja azonban megmaradt, ami azt jelenti, hogy a rendszer továbbra is feltölthető egy kompatibilis hordó töltőn keresztül. A Prime95 és a FurMark egyidejű futtatása során ideiglenesen 138 W-os maximális fogyasztást tudtunk rögzíteni.
| Kikapcsolt állapot / Készenlét | |
| Üresjárat | |
| Terhelés |
|
Kulcs:
min: | |
| Dell Inspiron 16 Plus 7640 Ultra 7 155H, NVIDIA GeForce RTX 4060 Laptop GPU, SK hynix BC901 HFS001TEJ4X164N, IPS, 2560x1600, 16" | Dell Inspiron 16 Plus 7630 i7-13700H, NVIDIA GeForce RTX 4060 Laptop GPU, WD PC SN740 SDDPTQD-1T00, IPS, 2560x1600, 16" | Dell Inspiron 16 Plus 7620 i7-12700H, GeForce RTX 3050 Ti Laptop GPU, Kioxia BG5 KBG50ZNS512G, IPS, 3072x1920, 16" | Samsung Galaxy Book4 Ultra Ultra 7 155H, NVIDIA GeForce RTX 4050 Laptop GPU, Samsung PM9A1 MZVL2512HCJQ, OLED, 2880x1800, 16" | Lenovo Legion 5 16IRX G9 i7-14650HX, NVIDIA GeForce RTX 4060 Laptop GPU, Samsung PM9A1 MZVL21T0HCLR, IPS, 2560x1600, 16" | Asus VivoBook Pro 16 K6602VU i9-13900H, NVIDIA GeForce RTX 4050 Laptop GPU, Micron 2400 MTFDKBA1T0QFM, OLED, 3200x2000, 16" | |
|---|---|---|---|---|---|---|
| Power Consumption | -82% | -30% | 9% | -113% | -116% | |
| Idle Minimum * | 4.2 | 15.6 -271% | 6.8 -62% | 4.8 -14% | 15.4 -267% | 21.06 -401% |
| Idle Average * | 6.9 | 17.7 -157% | 9.6 -39% | 7.5 -9% | 19.7 -186% | 24.27 -252% |
| Idle Maximum * | 15.2 | 20.6 -36% | 17 -12% | 7.9 48% | 20.7 -36% | 25.12 -65% |
| Load Average * | 70.4 | 87.4 -24% | 117.5 -67% | 79.3 -13% | 102.6 -46% | 52.4 26% |
| Witcher 3 ultra * | 115.9 | 121.7 -5% | 113.1 2% | 79.2 32% | 191.3 -65% | 110.2 5% |
| Load Maximum * | 137.4 | 138 -0% | 137.4 -0% | 125 9% | 246.6 -79% | 146 -6% |
* ... a kisebb jobb
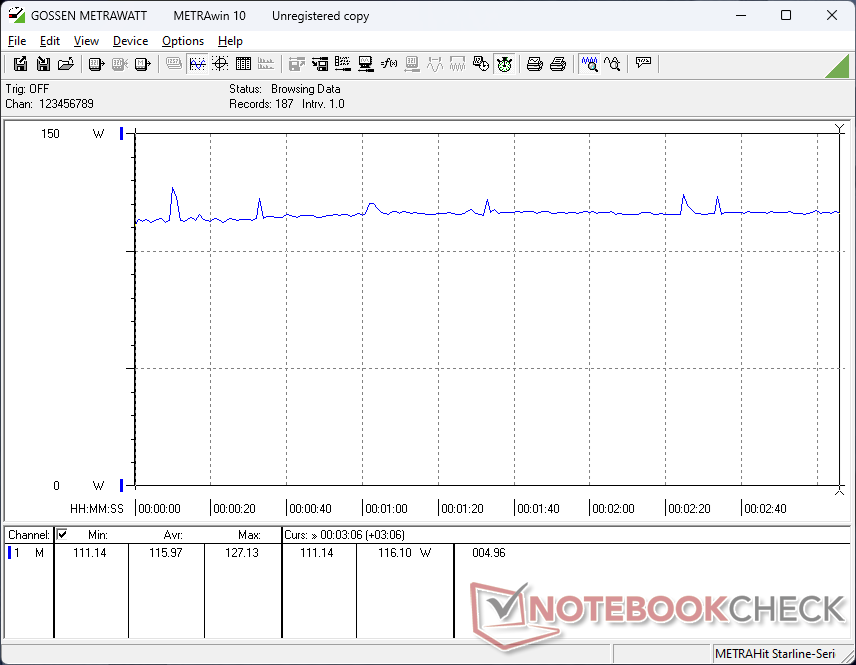
Power Consumption Witcher 3 / Stresstest
Power Consumption external Monitor
Az akkumulátor élettartama
A futási idők sokkal hosszabbak, mint korábban, valószínűleg az optimalizálásnak és az Intel CPU újabb generációjára való átállásnak köszönhetően. A tavalyi modell 9,5 órájához képest közel 13,5 órás valós WLAN-akkumulátor-üzemidőt tudunk rögzíteni.
A töltés üres állapotból a teljes kapacitásig körülbelül 2 órát vesz igénybe a mellékelt USB-C adapterrel.
| Dell Inspiron 16 Plus 7640 Ultra 7 155H, NVIDIA GeForce RTX 4060 Laptop GPU, 90 Wh | Dell Inspiron 16 Plus 7630 i7-13700H, NVIDIA GeForce RTX 4060 Laptop GPU, 86 Wh | Dell Inspiron 16 Plus 7620 i7-12700H, GeForce RTX 3050 Ti Laptop GPU, 86 Wh | Samsung Galaxy Book4 Ultra Ultra 7 155H, NVIDIA GeForce RTX 4050 Laptop GPU, 76 Wh | Lenovo Legion 5 16IRX G9 i7-14650HX, NVIDIA GeForce RTX 4060 Laptop GPU, 80 Wh | Asus VivoBook Pro 16 K6602VU i9-13900H, NVIDIA GeForce RTX 4050 Laptop GPU, 96 Wh | |
|---|---|---|---|---|---|---|
| Akkumulátor üzemidő | -29% | -28% | -18% | -44% | -24% | |
| WiFi v1.3 | 799 | 566 -29% | 575 -28% | 656 -18% | 444 -44% | 606 -24% |
| Reader / Idle | 1055 | 1114 | ||||
| Load | 85 | 69 | 78 | 46 | ||
| H.264 | 1076 | 576 | 585 |
Pro
Kontra
Ítélet - Néhány apró lyuk befoltozása
Míg a 2024 Inspiron 16 Plus 7640 nagyon hasonlíthat a 2023-as verzió, a várható éves processzorfrissítésen túl elég újdonságot hoz az asztalra, amivel az érdeklődő vásárlóknak érdemes tisztában lenniük. Az újabb modell akár két SSD-t is támogat, gyorsabb fekete-fehér és szürke-szürke válaszidőt, hosszabb akkumulátor-üzemidőt és AI-gyorsítást kínál. Ezek a motorháztető alatti változások azoknak a rajongóknak számítanak, akiknek fontos a tárhelybővítés, a gyors játék, az utazás és az AI-alapú programok, például a Co-Pilot. Az Inspiron 16 Plus 7640 ebből a szempontból nem válik elődjéhez képest előnyösebbé.
Az Inspiron 16 Plus 7640 orvosolja elődje néhány hátrányát, hogy még jobb multimédiás gép legyen, mint korábban. Az egyszálas CPU-teljesítmény és a játékteljesítmény azonban egy apró lépést hátrál.
Sajnos a játékteljesítmény az új modellel visszaesik, mivel a legtöbb játék hajlamos egy kicsit lassabban futni, mint korábban. A hardcore játékosok számára ez csalódást okozhat, de a lemaradás nem lehet elég ahhoz, hogy elriassza az alkalmi játékosokat, akiknek az Inspiron sorozatot tervezték. Azoknak a játékosoknak, akik valóban nagyobb teljesítményt szeretnének kipréselni a laptopjukból, nagyobb és drágább modelleket kell fontolóra venniük, mint például az Dell G16 sorozat, Asus Zephyrus G16 sorozatvagy Razer Blade 16 sorozat ahol a TGP gyakran elérheti a három számjegyű értéket.
Ár és elérhetőség
A Core Ultra 7, RTX 4060 és 1600p felülvizsgálati konfigurációnk jelenleg közvetlenül a Dell-től 1300 dollárért szállítható. Eközben az alacsonyabb árkategóriájú Core i7 a UHD Graphics SKU-val mindössze 900 dollárról indul.
Dell Inspiron 16 Plus 7640
- 06/21/2024 v8
Allen Ngo
Átláthatóság
A felülvizsgálandó készülékek kiválasztását szerkesztőségünk végzi. A tesztmintát a gyártó vagy a kiskereskedő kölcsönként bocsátotta a szerző rendelkezésére a felülvizsgálat céljából. A hitelezőnek nem volt befolyása erre a felülvizsgálatra, és a gyártó sem kapott másolatot erről a felülvizsgálatról a közzététel előtt. Nem volt kötelesség ezt az ismertetőt közzétenni. Soha nem fogadunk el kártérítést vagy fizetést értékeléseinkért cserébe. Független médiavállalatként a Notebookcheck nincs alávetve a gyártók, kiskereskedők vagy kiadók felhatalmazásának.
Így tesztel a Notebookcheck
A Notebookcheck minden évben független, laptopok és okostelefonok százait vizsgálja meg szabványosított eljárások alkalmazásával annak érdekében, hogy minden eredmény összehasonlítható legyen. Körülbelül 20 éve folyamatosan fejlesztjük vizsgálati módszereinket, és ennek során iparági szabványokat állítottunk fel. Tesztlaboratóriumainkban kiváló minőségű mérőberendezéseket használnak tapasztalt technikusok és szerkesztők. Ezek a tesztek többlépcsős validációs folyamatot foglalnak magukban. Komplex minősítési rendszerünk több száz megalapozott mérésen és benchmarkon alapul, ami megőrzi az objektivitást.Price comparison

