Asus V16 V3607V laptop felülvizsgálat: GeForce RTX grafika a bank megrongálása nélkül
Core 7 240H teljesítmény debütálása.
Mindaddig, amíg tudja, hol vannak a vágott sarkok, az Asus V16 egy szilárd jack-of-all-trades megoldás lehet, amely elég jól teljesít a legtöbb otthoni, irodai vagy tantermi forgatókönyvekhez.Allen Ngo, 👁 Allen Ngo (fordította DeepL / Ninh Duy) Közzétett 🇺🇸 🇫🇷 ...
Ítélet - jól megalapozott és olcsó
Mivel a Vivobook sorozat ára egyre magasabbra emelkedik, a V16-ot a szűkebb költségvetésű felhasználók számára új, alacsonyabb árkategóriájú opcióként vezették be. A V16 elég jól kielégíti ezt a ~1000 dolláros teret azáltal, hogy egy új és tisztességesen gyors CPU-t és egy diszkrét RTX GPU-t egyensúlyoz ki egy olyan kialakításban, amely meglehetősen vékony és hordozható, hogy versenyképes legyen a következőkkel szemben HP Pavilion Plus 16 vagy a nehezebb Dell Inspiron 16 Plus 7640.
A levágott sarkok ennek ellenére érzékelhetőek. A kijelző például szűk színlefedettséget kínál, míg a műanyag váz meglehetősen olcsónak tűnhet. A fent említett HP erősebbnek tűnik, és még >99 százalékos sRGB színeket is kínál, bár magasabb áron, mint a mi Asusunk.
Az RTX 4050 konfiguráció e cikk írásakor 100 dollárral többe kerül a kiskereskedelemben, mint az RTX 3050 konfiguráció. A potenciális vásárlóknak érdemes megfontolniuk az RTX 4050 opciót, mivel az több mint 50 százalékkal gyorsabb grafikus teljesítményt kínál, mint az RTX 3050.
Pro
Kontra
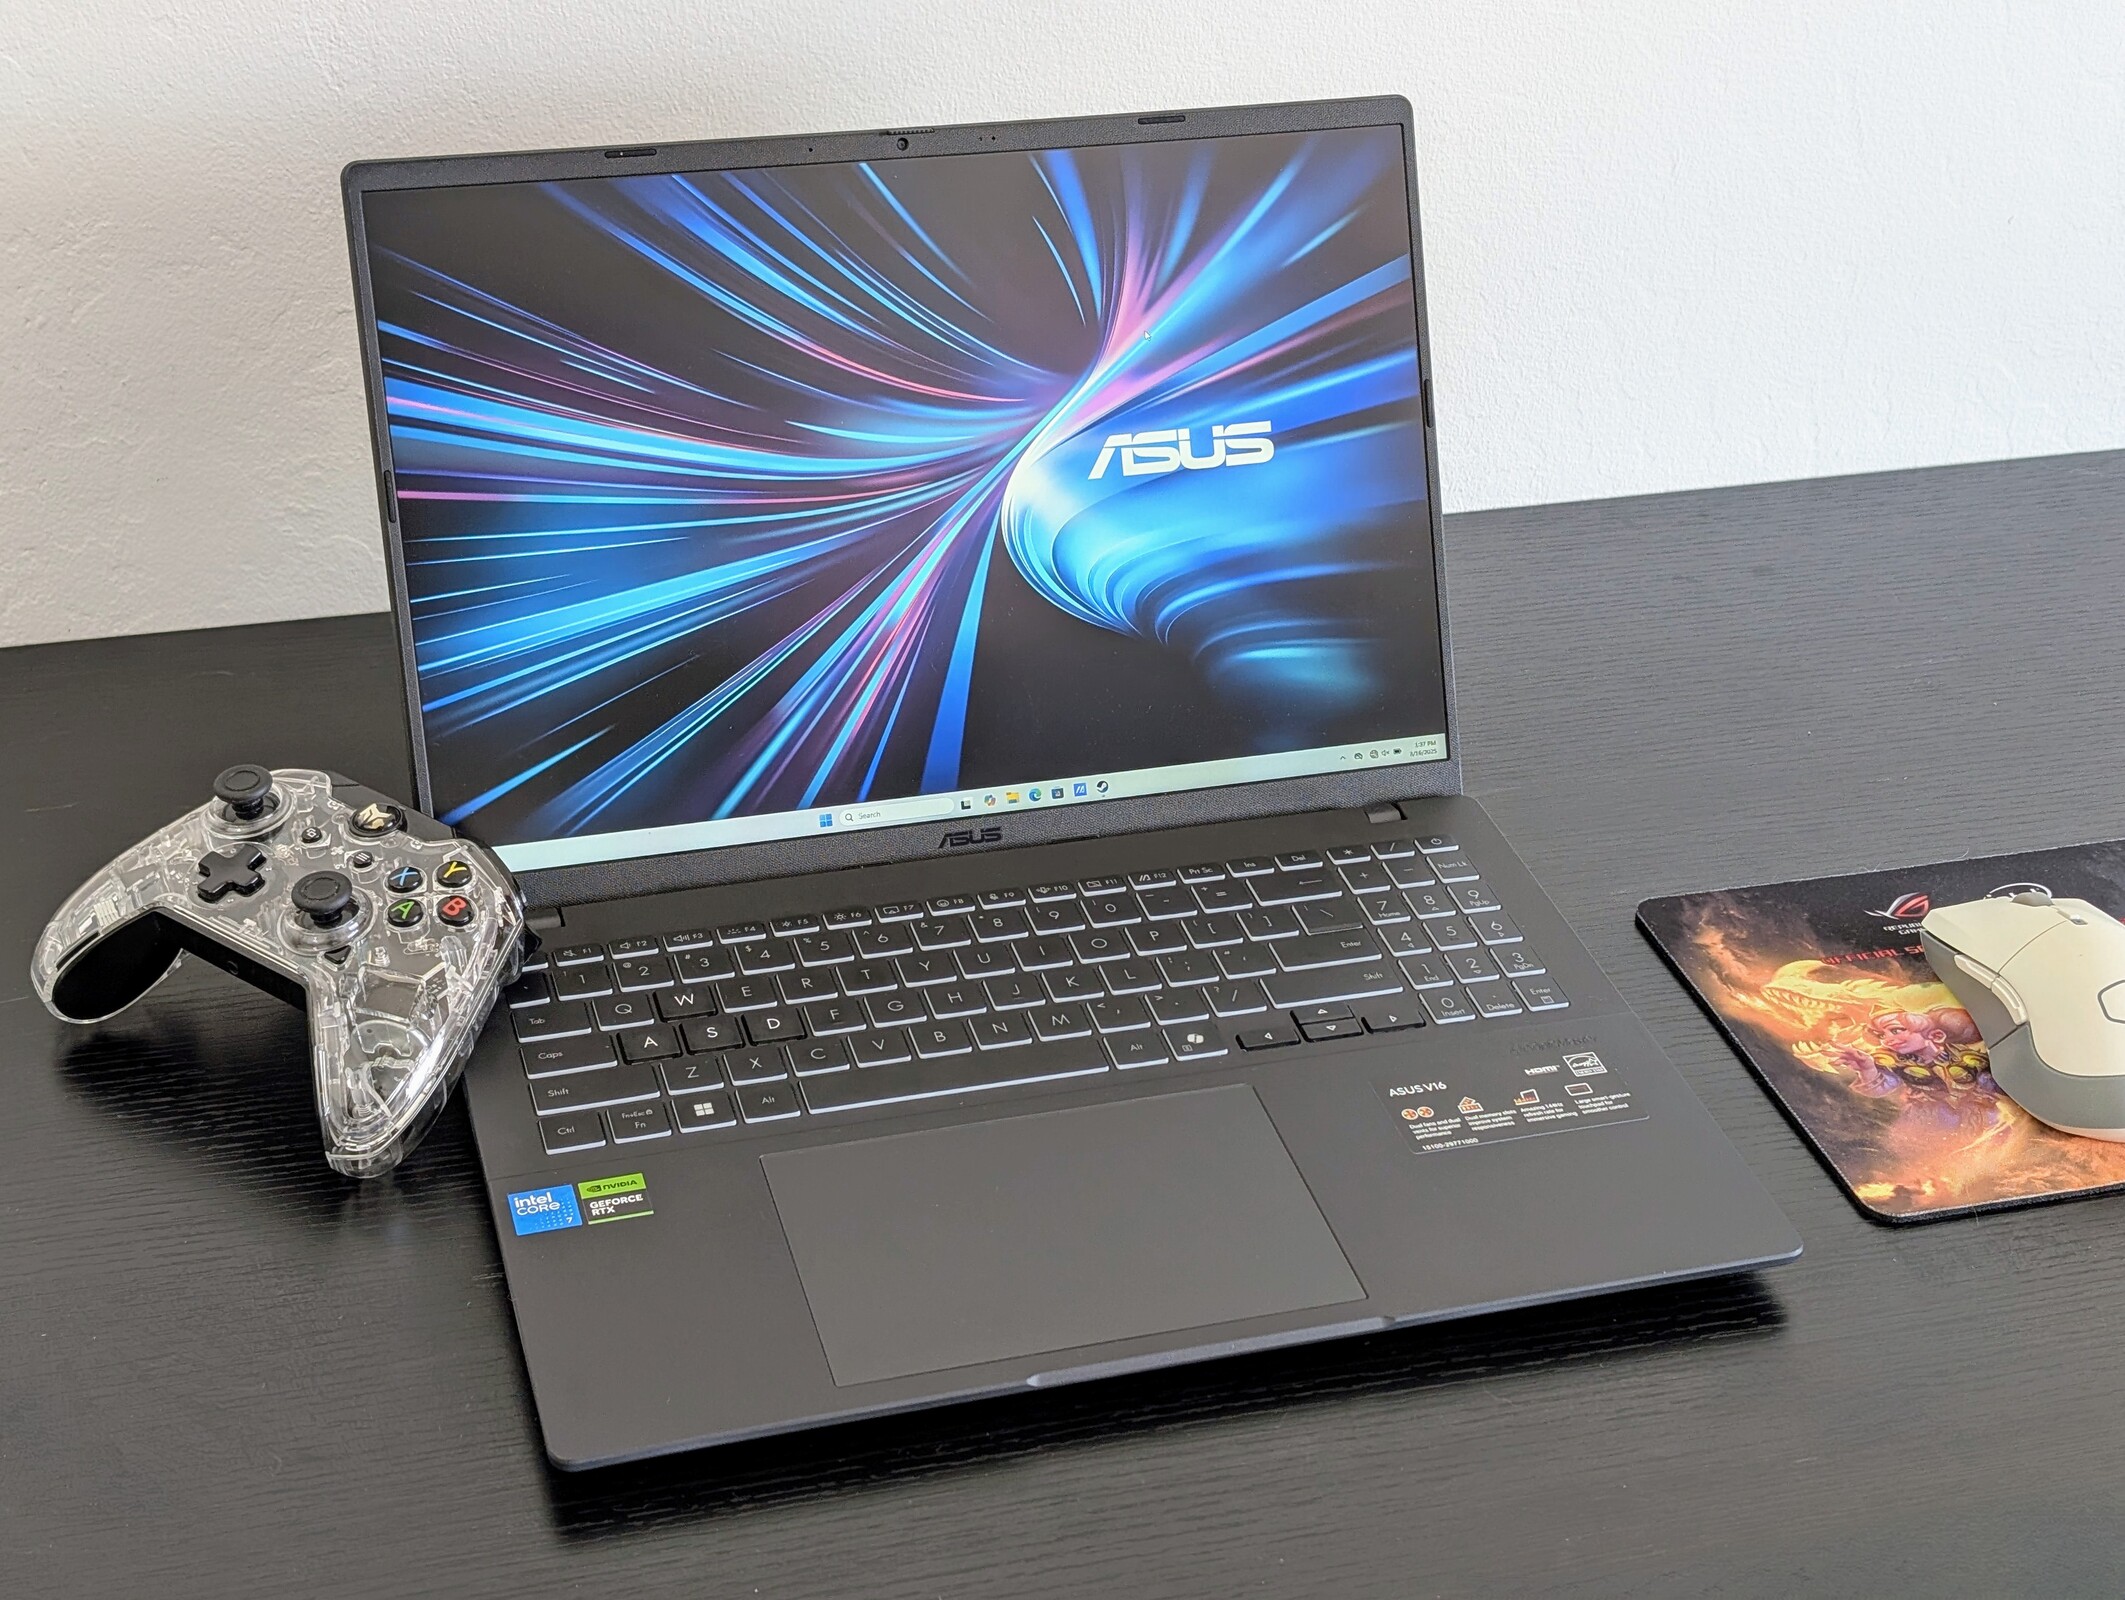
Nem összetévesztendő a VivoBook 16-tal, a V16 az Asus kedvező árú multimédiás modellje, amelynek induló ára még a VivoBook sorozatnál is alacsonyabb. Hiányoznak belőle bizonyos, a VivoBookon megtalálható luxusfunkciók, mint például az OLED és a vonzó fémdizájn. A 2025 V16 az új felső középkategóriás Core 7 240H-val kerül forgalomba.
Tesztkészülékünk a fent említett CPU-val, 1200p 144 Hz-es IPS kijelzővel és a régebbi 6 GB-os GeForce RTX 3050-zel érkezik, hogy az árak 1000 dollár alatt maradjanak. Más SKU-kat ehelyett RTX 4050-gyel szállíthatnak.
A V16 alternatívái közé tartoznak más, diszkrét GPU-val ellátott, kedvező árú multimédiás laptopok, mint például a HP Pavilion Plus 16, Dell Inspiron 16 Plus, vagy a Lenovo IdeaPad Pro 5 16.
További Asus vélemények:
Műszaki adatok
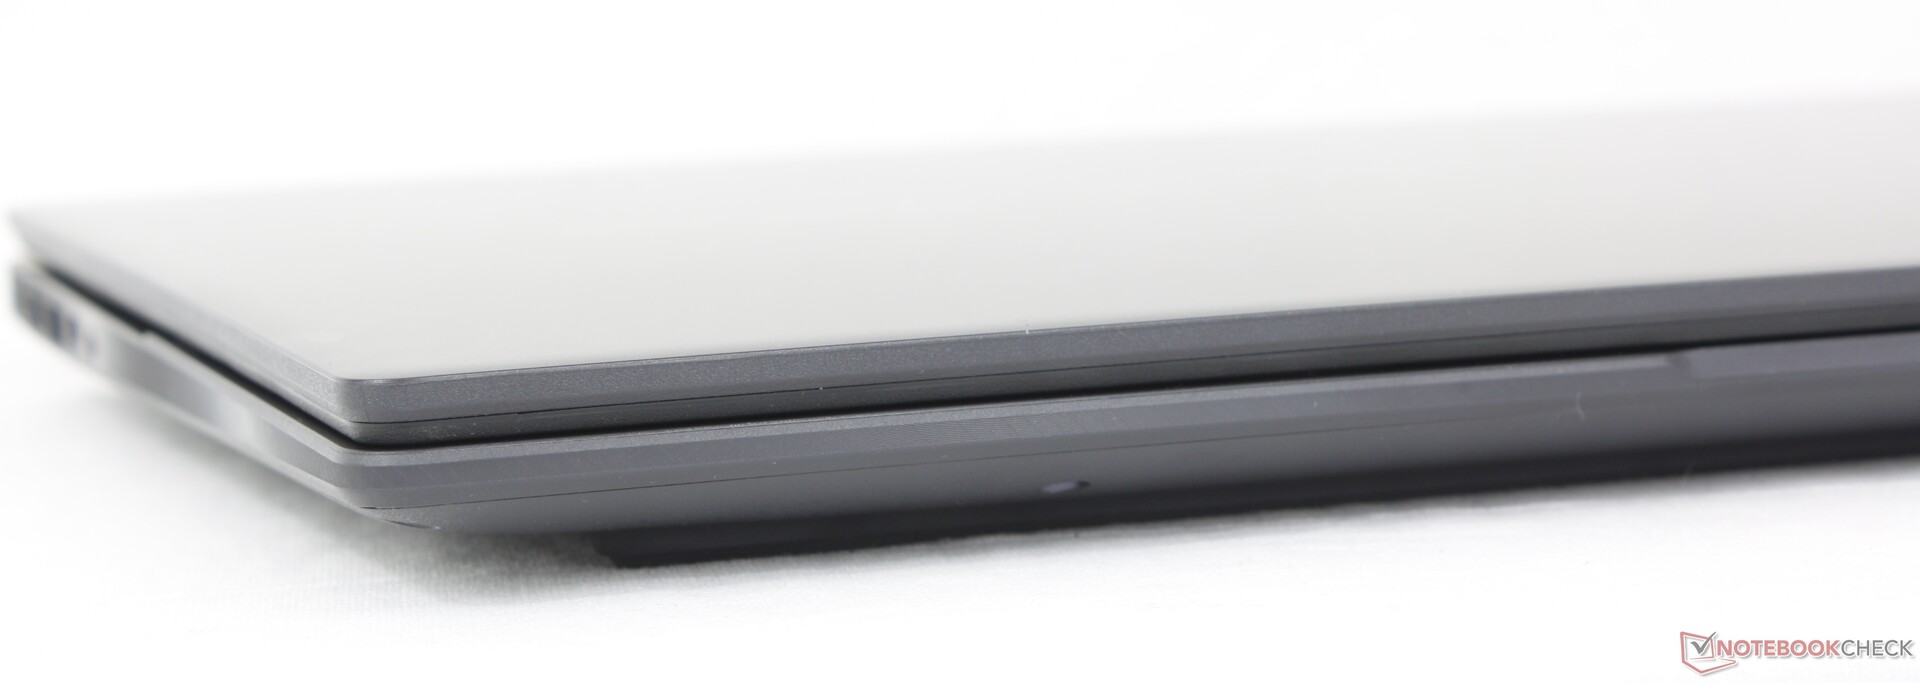
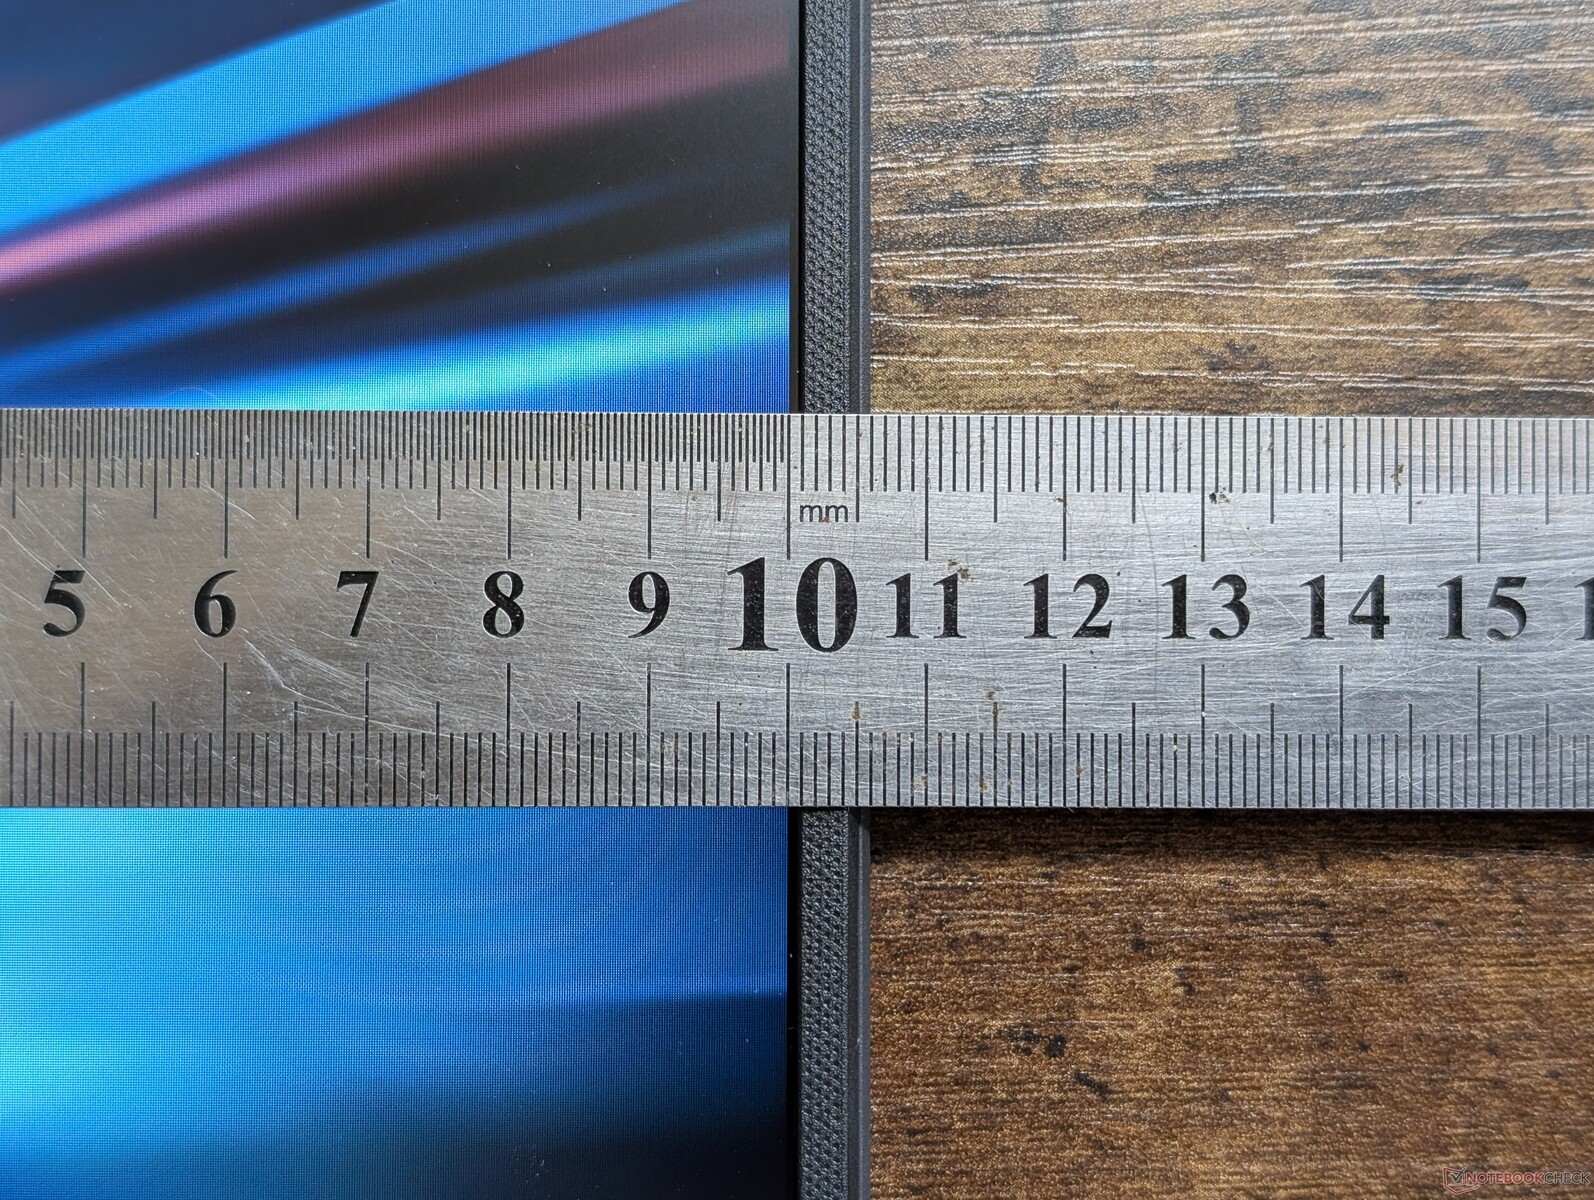
Tok - egyszínű fekete műanyag
Az alváz egyértelműen műanyag, beleértve még a külső borítást is, ahol a gyártók gyakran használnak fémet a jobb első benyomások érdekében. Az alap és a fedél hajlamos a csavarodásra, és rendkívül érzékeny a csúnya ujjlenyomatokra.

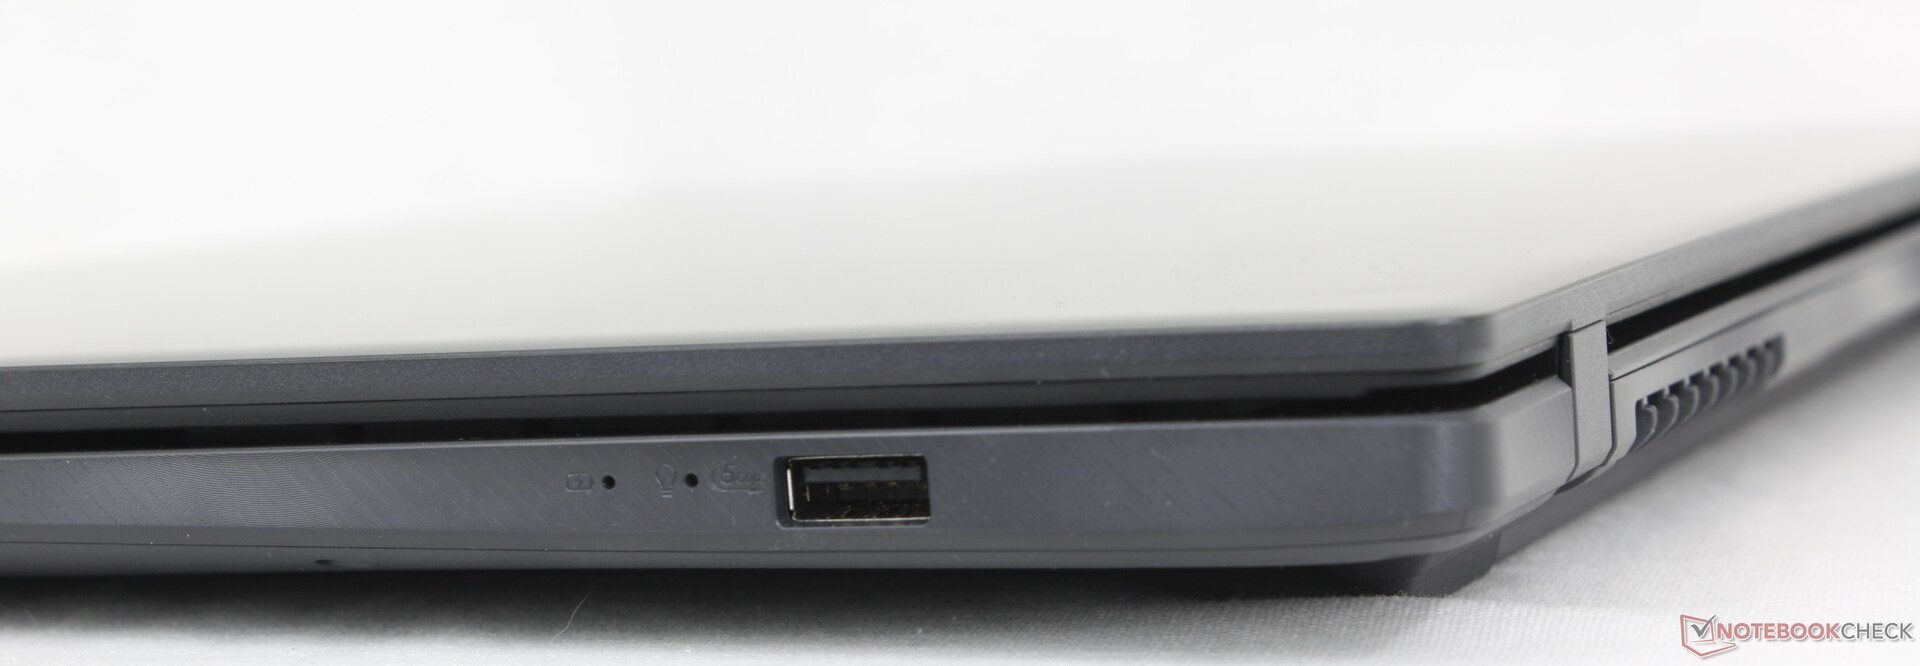
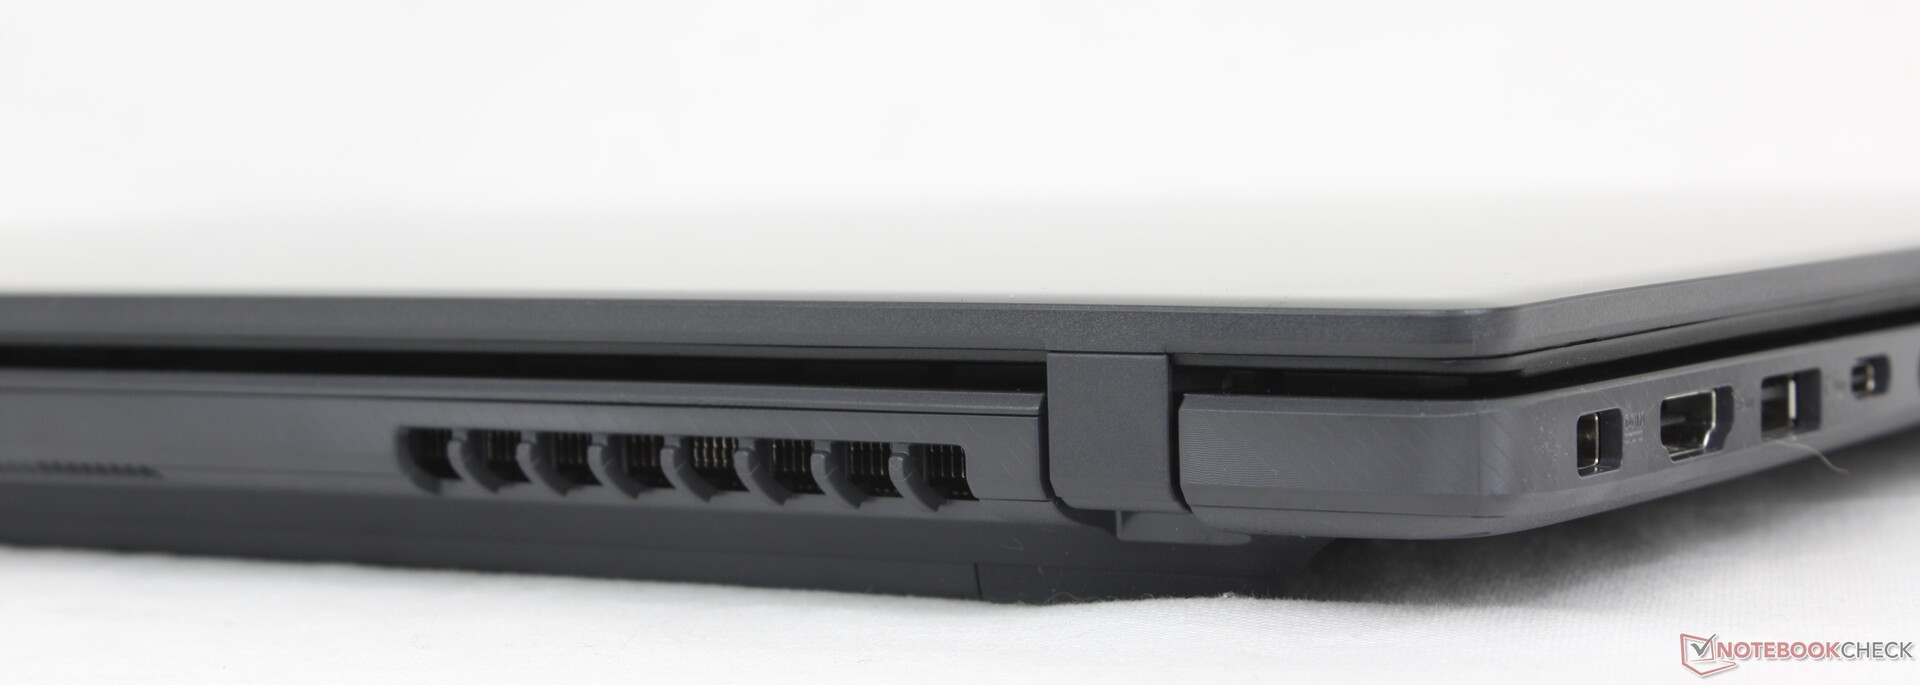
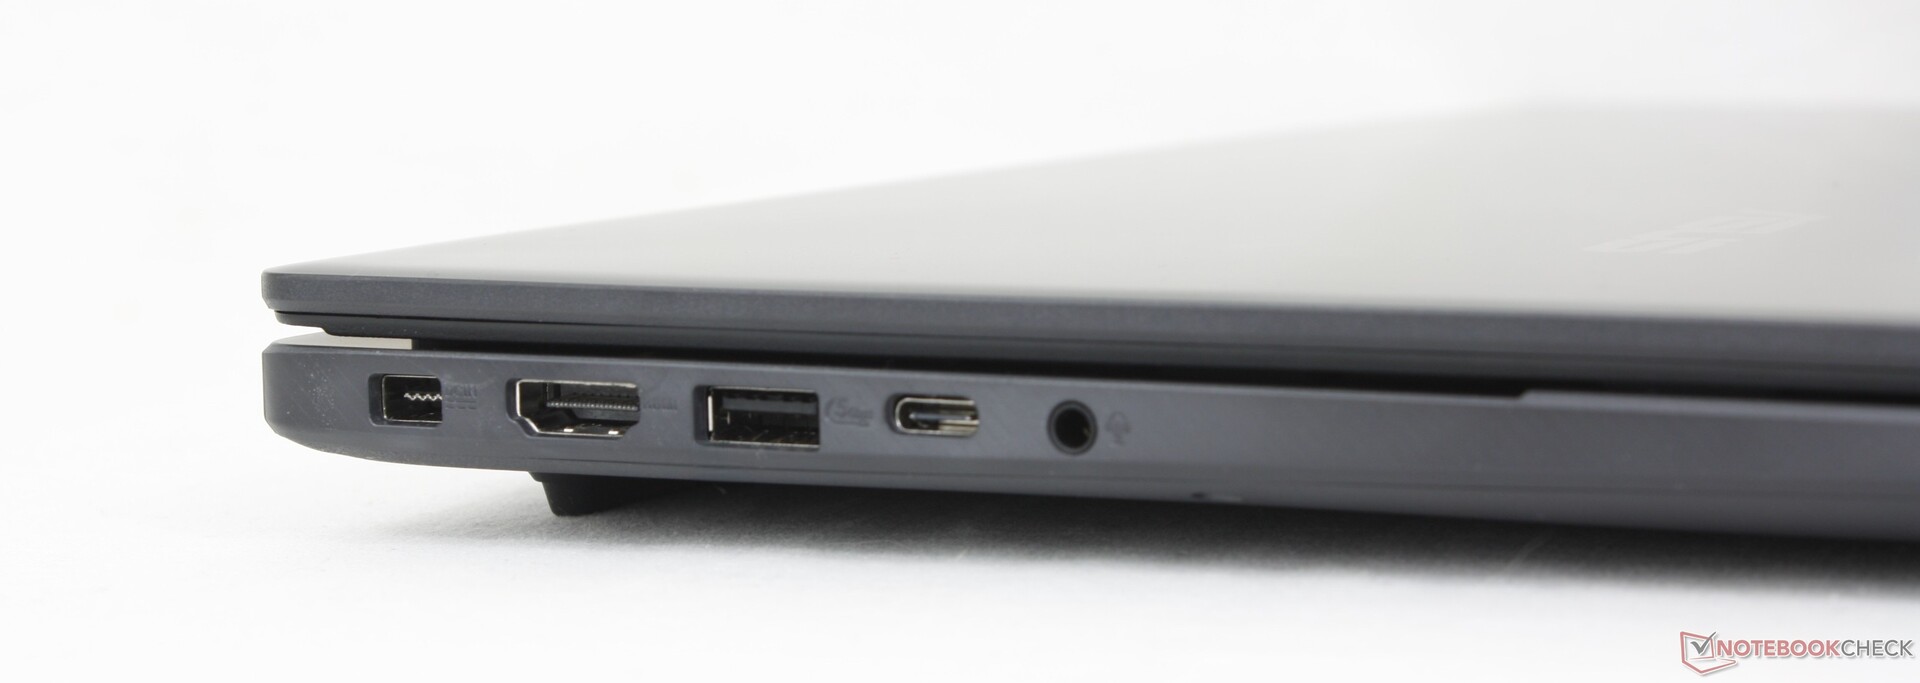
Csatlakozás
Az USB-C port nem támogatja a Thunderboltot, ellentétben a drágább VivoBook Pro 16 amely szélesebb körű portokat integrál. Bosszantó módon a V16 más hálózati adapter kábelt használ, mint a VivoBook sorozat is.
Kommunikáció
A kivehető Realtek RTL8852BE szabványos Wi-Fi 6 és Bluetooth 5.3 kapcsolattal rendelkezik. A Wi-Fi 6E és a Wi-Fi 7 nem támogatott.
| Networking | |
| iperf3 transmit AXE11000 | |
| HP Pavilion Plus 16-ab0456tx | |
| Asus VivoBook Pro 16 K6602VU | |
| Dell Inspiron 16 Plus 7640 | |
| Acer Swift Edge 16 SFE16-44-R0XV | |
| Lenovo ThinkBook 16 G7 IML | |
| Asus V16 V3607V | |
| iperf3 receive AXE11000 | |
| Acer Swift Edge 16 SFE16-44-R0XV | |
| Asus VivoBook Pro 16 K6602VU | |
| HP Pavilion Plus 16-ab0456tx | |
| Dell Inspiron 16 Plus 7640 | |
| Asus V16 V3607V | |
| Lenovo ThinkBook 16 G7 IML | |
| iperf3 transmit AXE11000 6GHz | |
| HP Pavilion Plus 16-ab0456tx | |
| Asus VivoBook Pro 16 K6602VU | |
| Dell Inspiron 16 Plus 7640 | |
| iperf3 receive AXE11000 6GHz | |
| HP Pavilion Plus 16-ab0456tx | |
| Asus VivoBook Pro 16 K6602VU | |
| Dell Inspiron 16 Plus 7640 | |
Webkamera
A 2 MP-es webkamera fizikai redőnnyel alapfelszereltség. A költségek megtakarítása érdekében nincs IR-kamera.


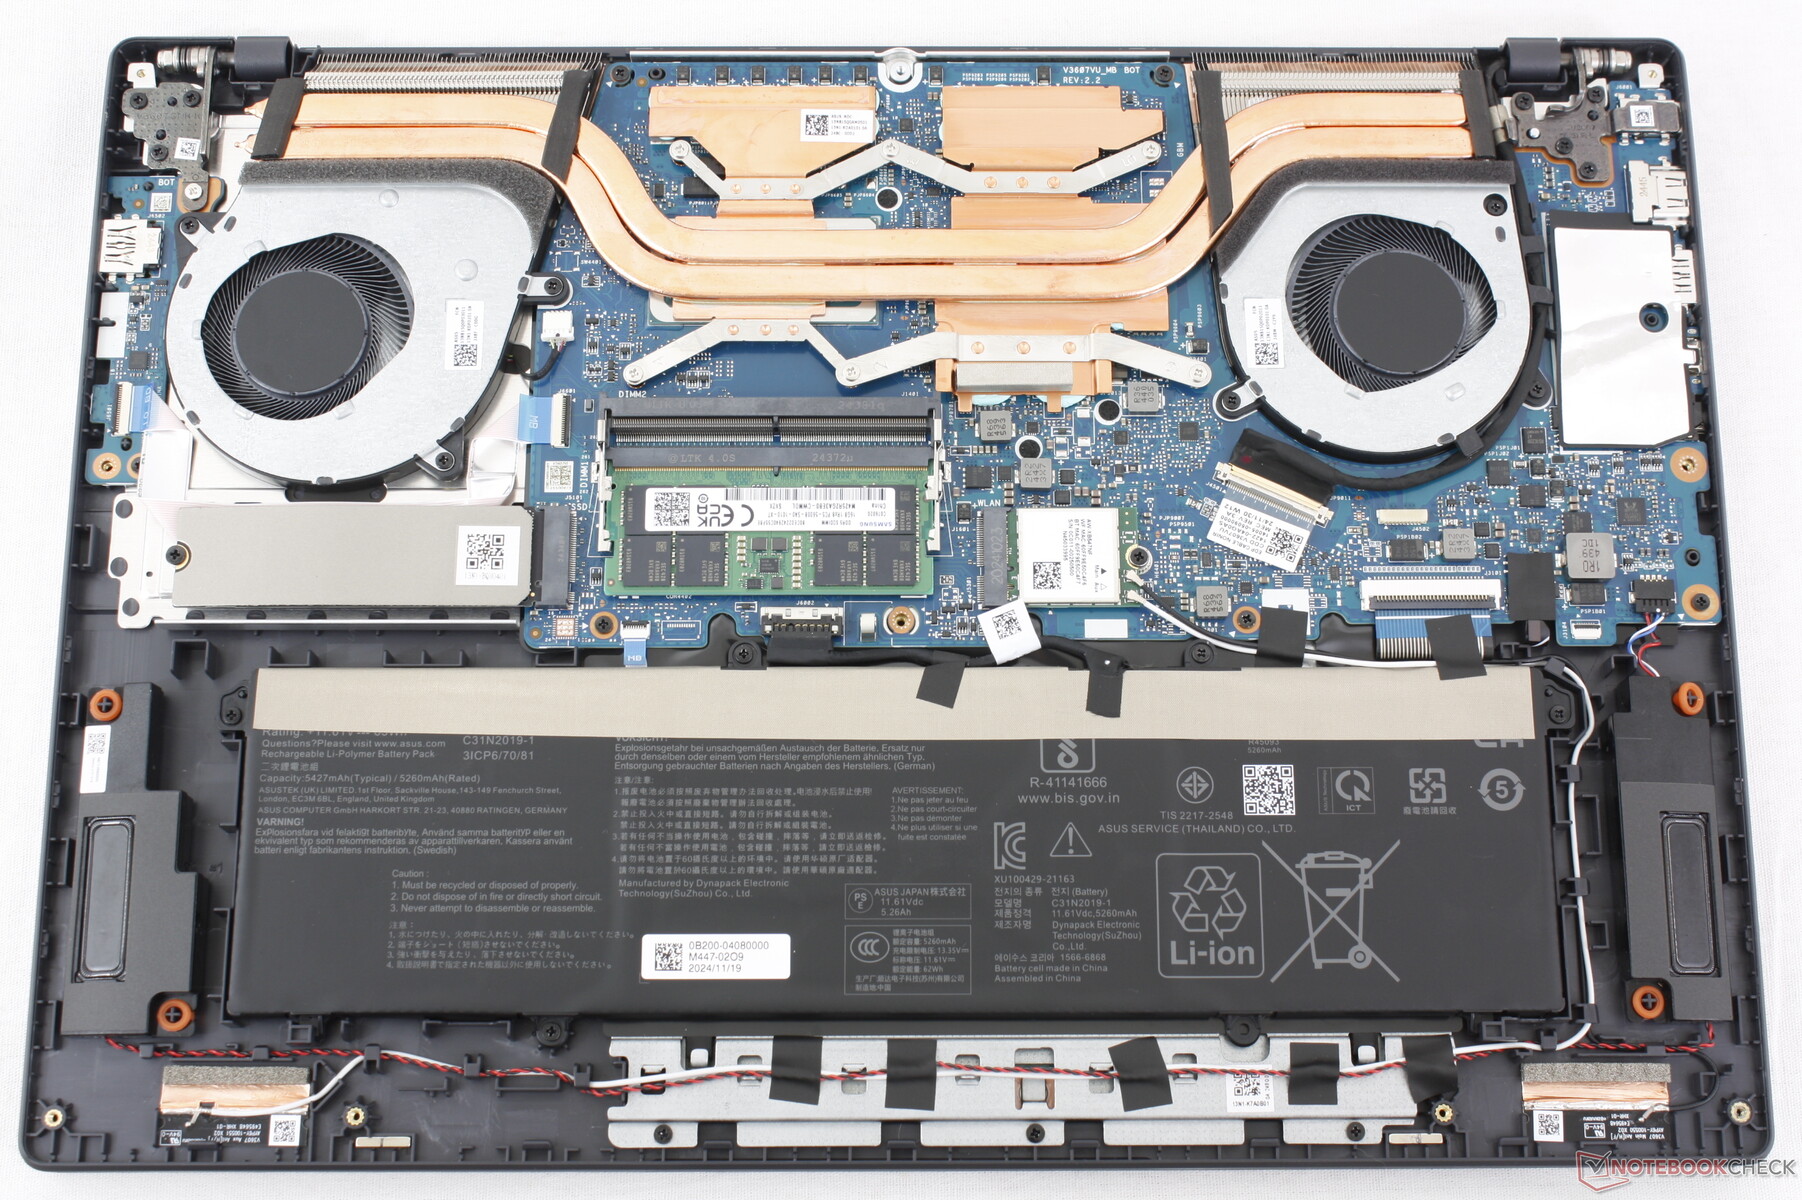
Karbantartás
Az alsó panel viszonylag könnyen leemelhető egy Phillips csavarhúzóval a könnyű szervizelés érdekében. A másodlagos SSD nem támogatott.
Fenntarthatóság
Az Asus célja, hogy szén-dioxid-semleges legyen, de egyébként a V16 gyártási folyamatáról nincsenek konkrétumok. A kiskereskedelmi csomagolás többnyire papír és karton, nagyon kevés műanyag csomagolással.
Tartozékok és garancia
A dobozban a hálózati adapteren és a papírmunkán kívül nincs más extra. Az Egyesült Államokban történő vásárlás esetén egy év gyártói garancia érvényes.
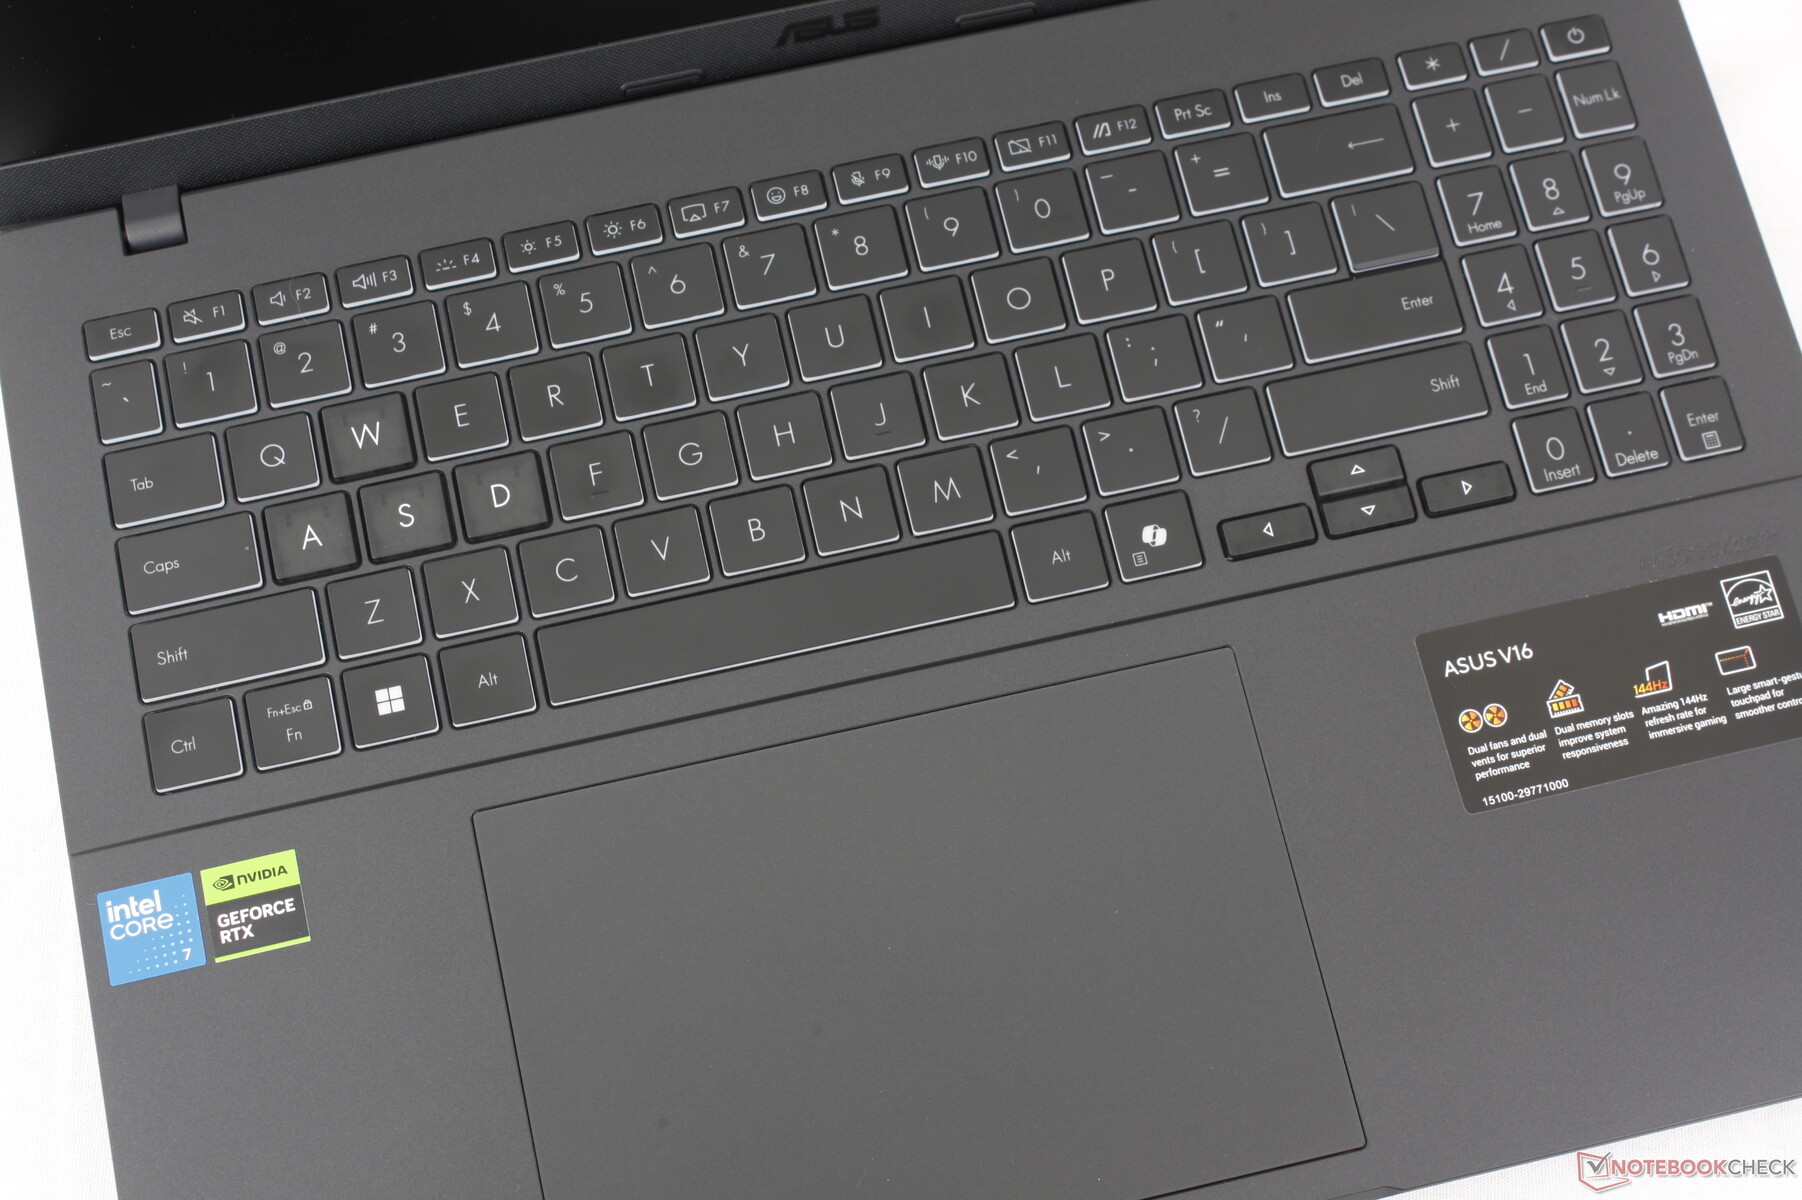
Bemeneti eszközök - VivoBook Vibes
Billentyűzet
A V16 jobb híján a VivoBook 16 sorozat billentyűzetét veszi át. Az út és a visszajelzés lehetett volna mélyebb, illetve erősebb, de elég megbízhatóan működik anélkül, hogy többet kellene költeni a jobb billentyűzettel rendelkező alternatívákra, mint például egy ThinkPad T sorozat vagy a EliteBook.
Touchpad
A kattintópad nagy, 15 x 10 cm-es, szemben a mindössze 11,5 x 8 cm-es, a Dell Inspiron 16 Plus 7640. Sajnos a visszajelzés nagyon lágy és halk. A lenyomáshoz is több erőre lenne szükség, mint a legtöbb más laptopon, ami rövid idő után kényelmetlen lehet.
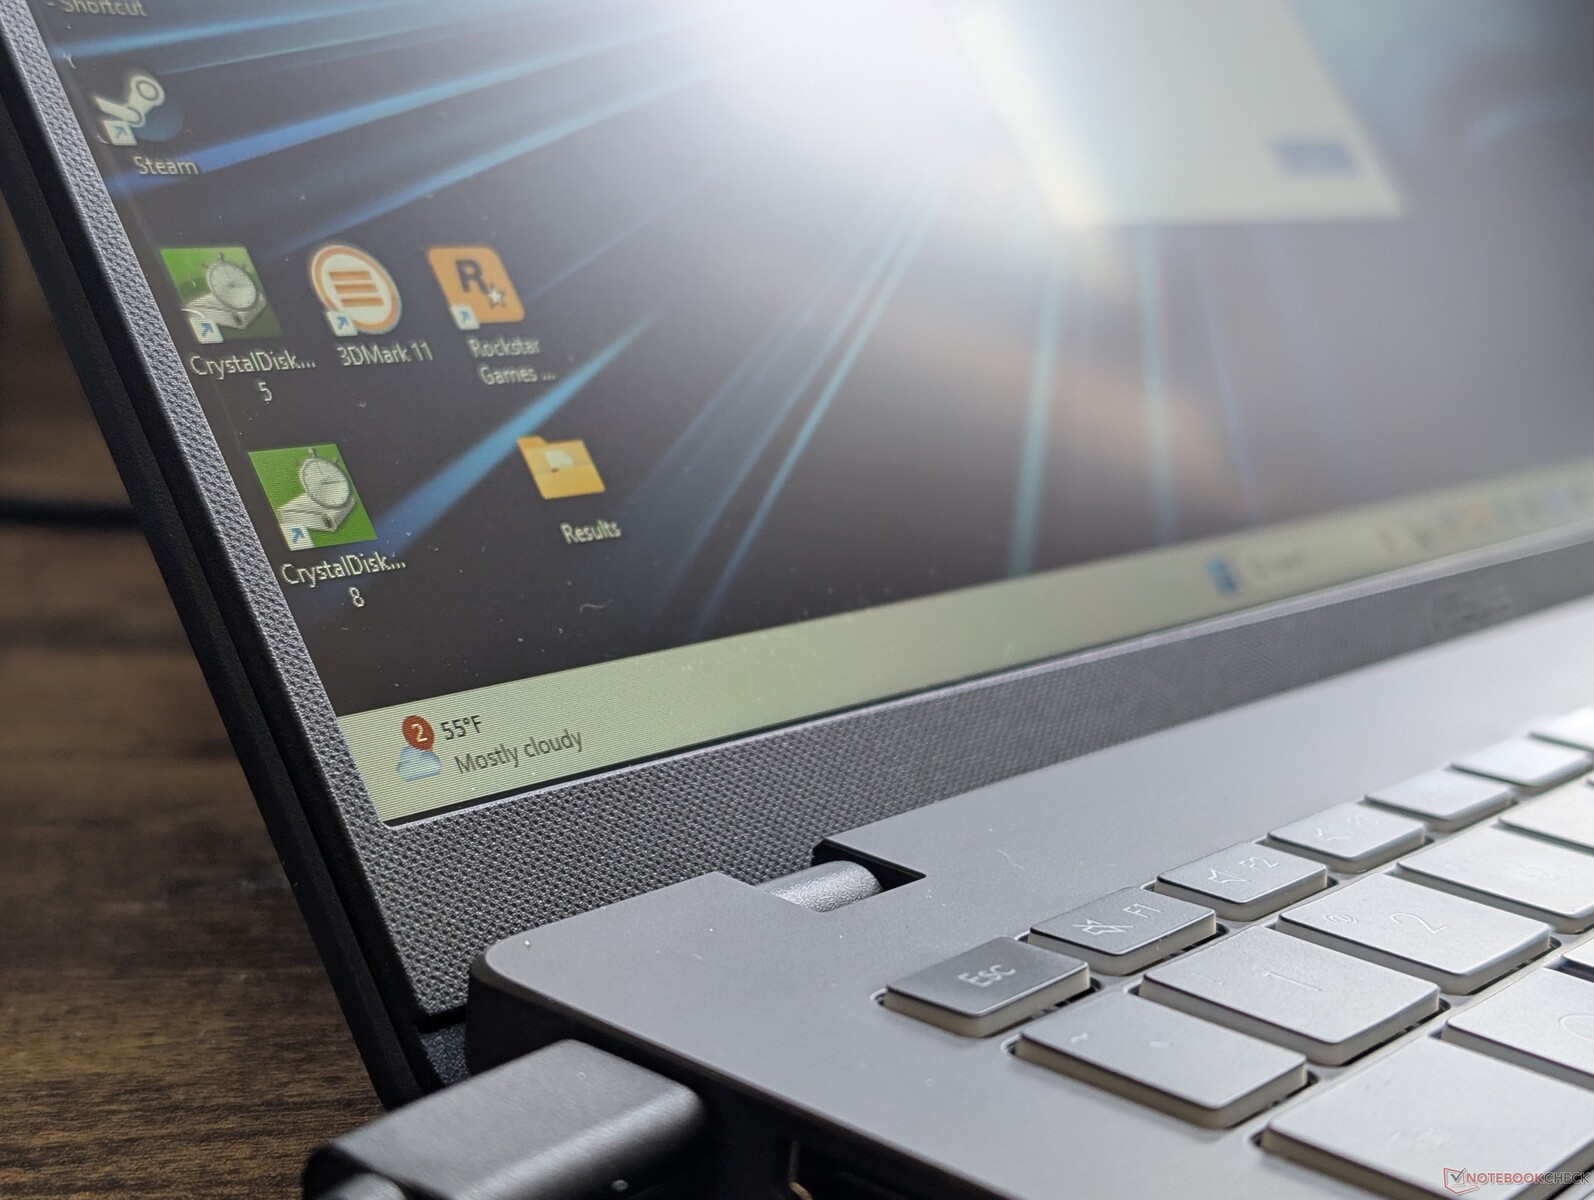
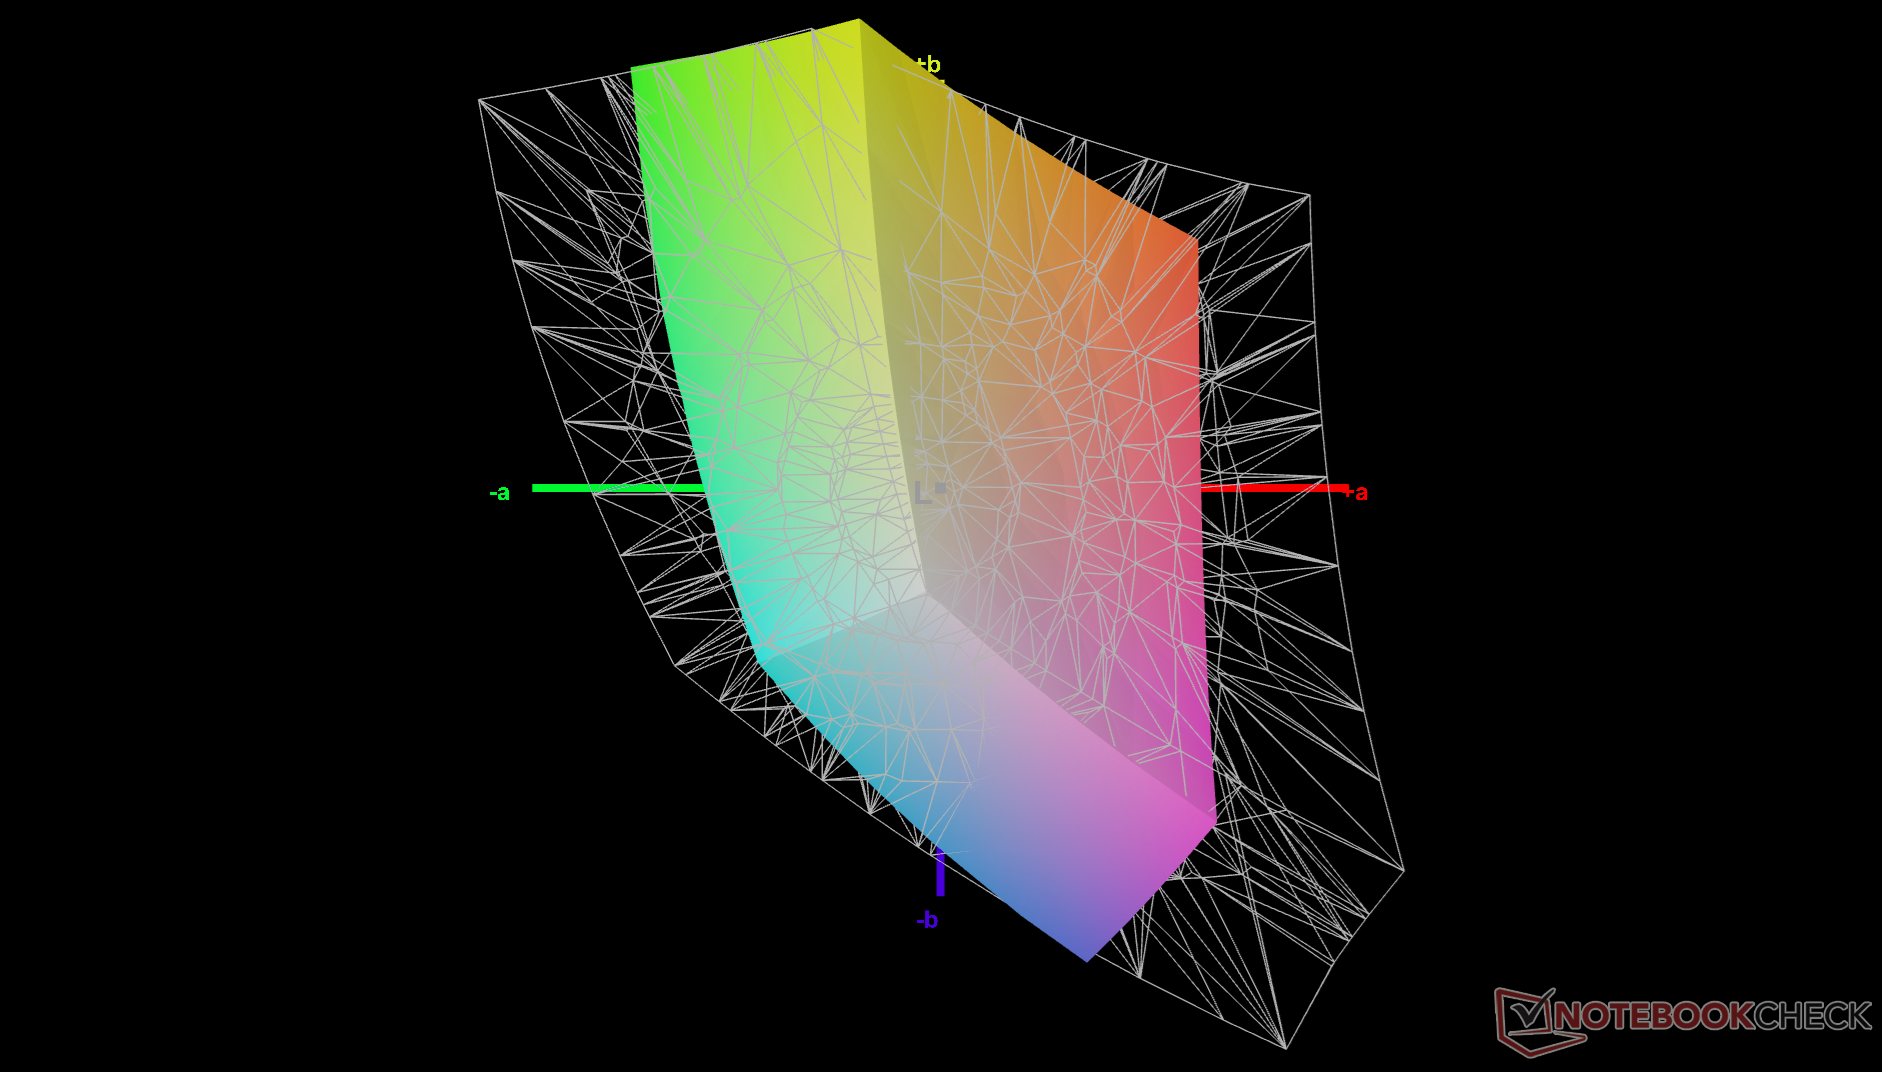
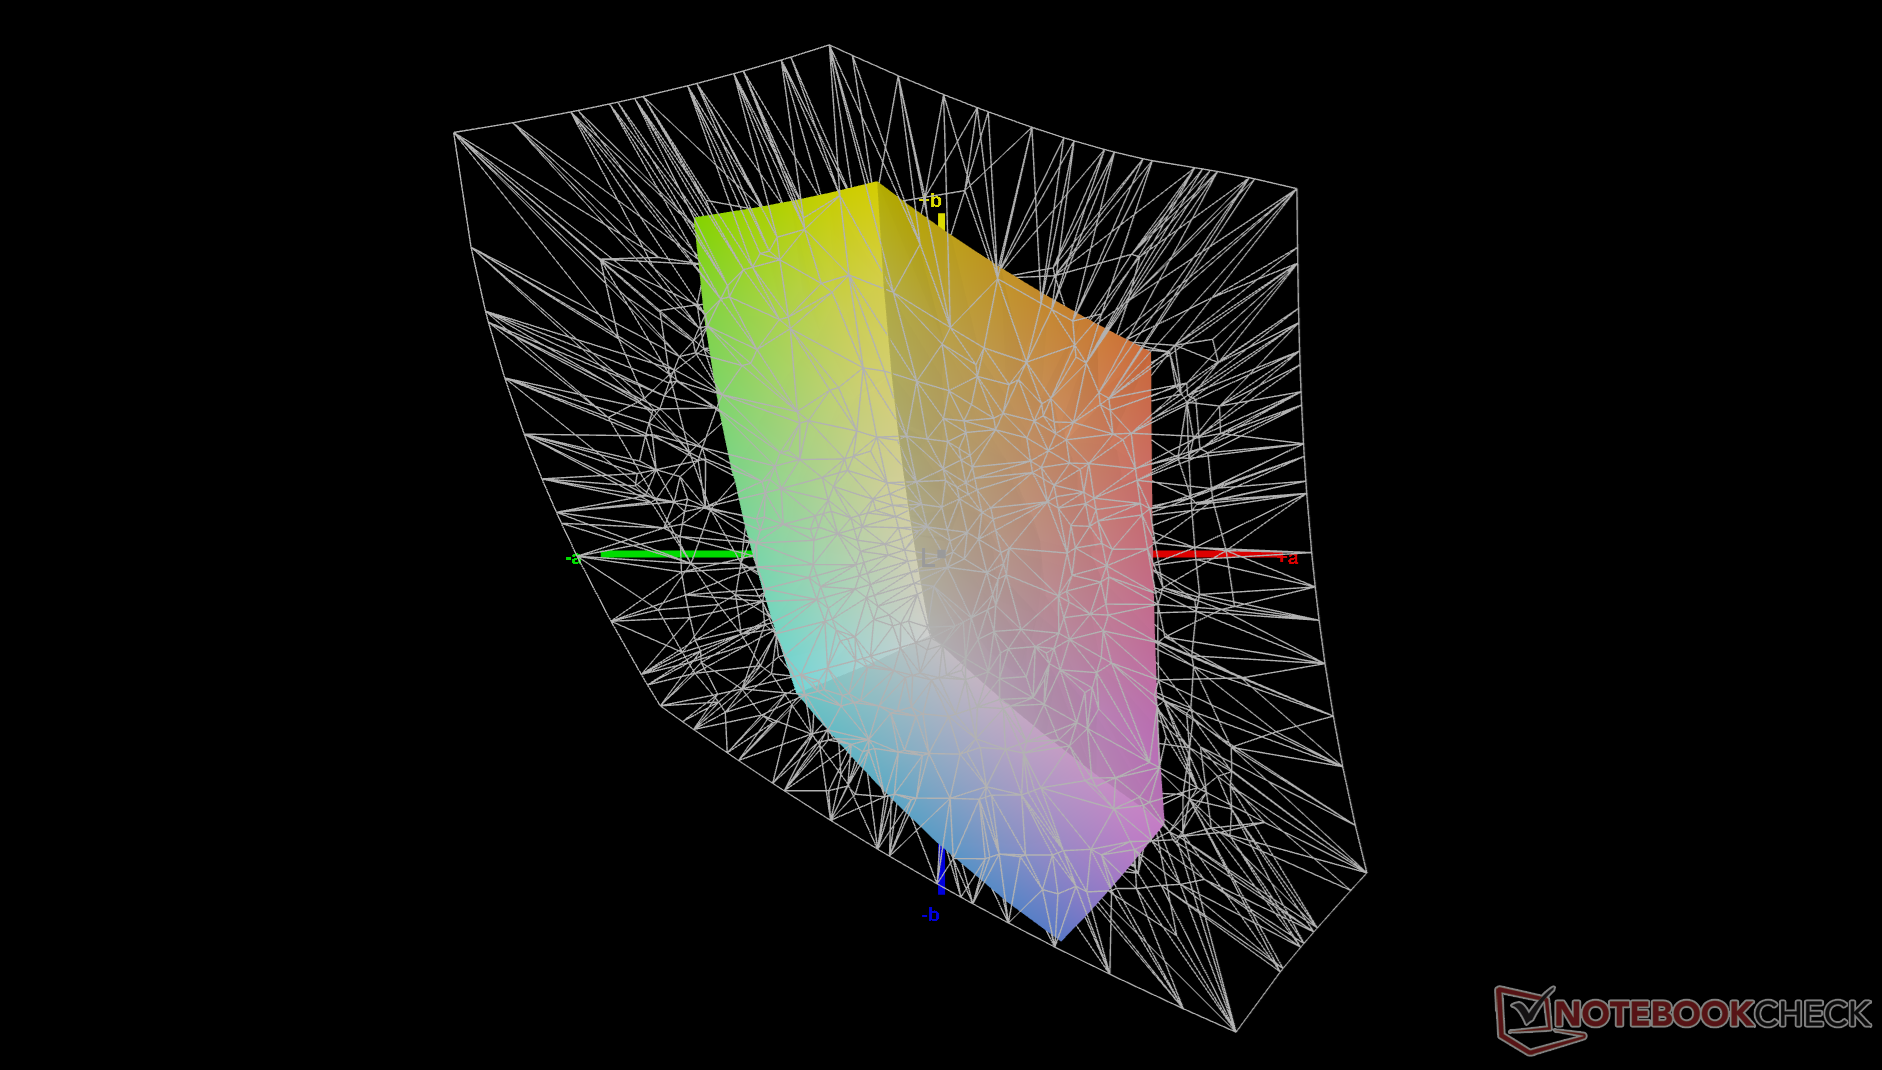
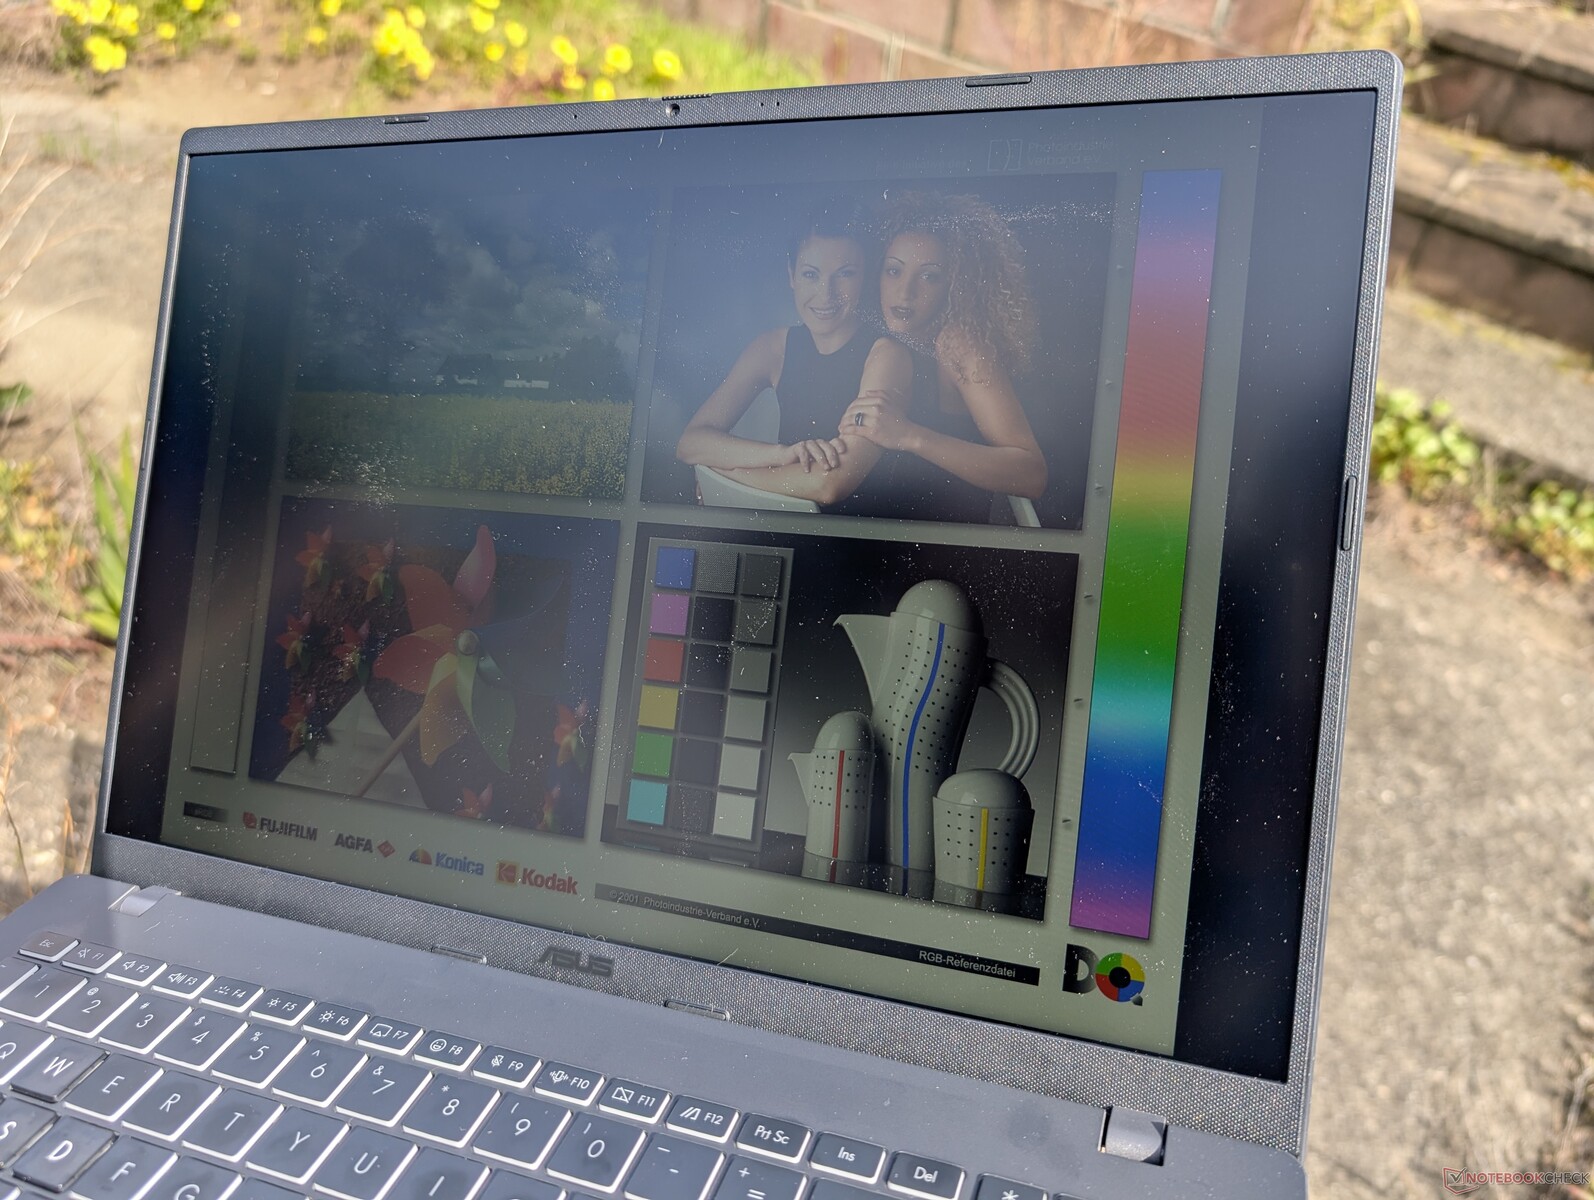
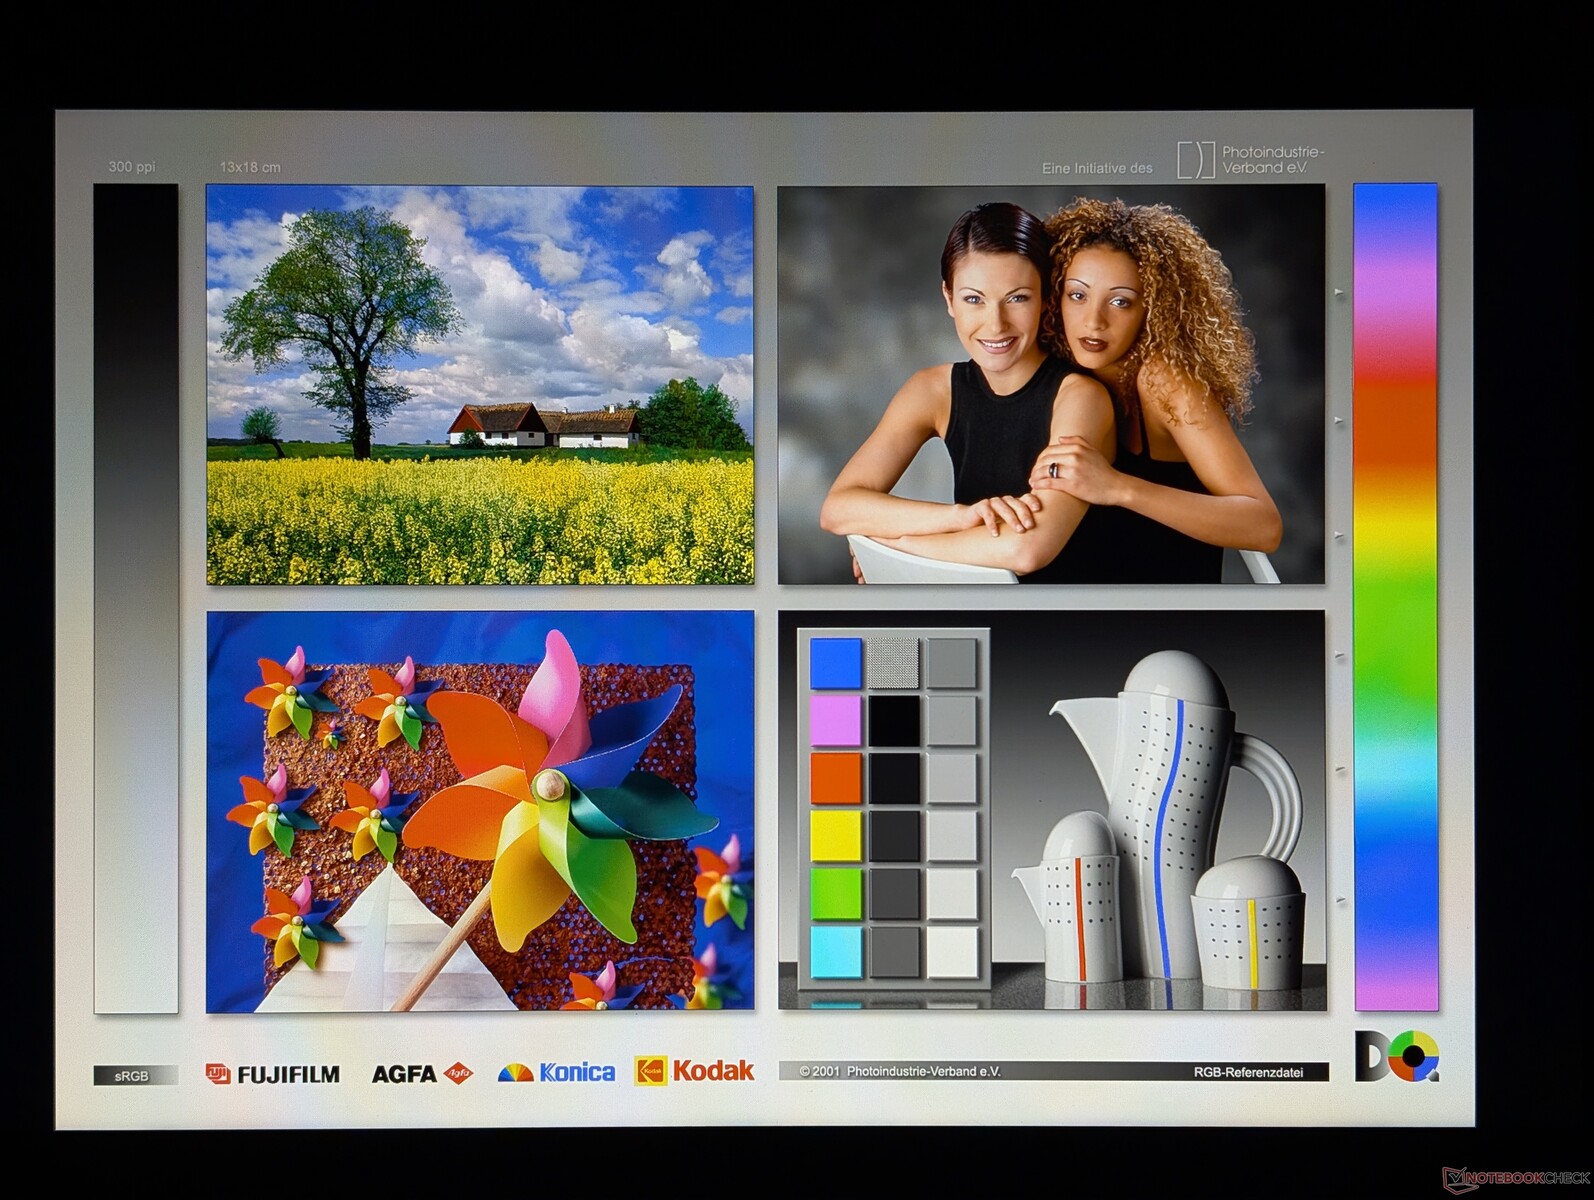
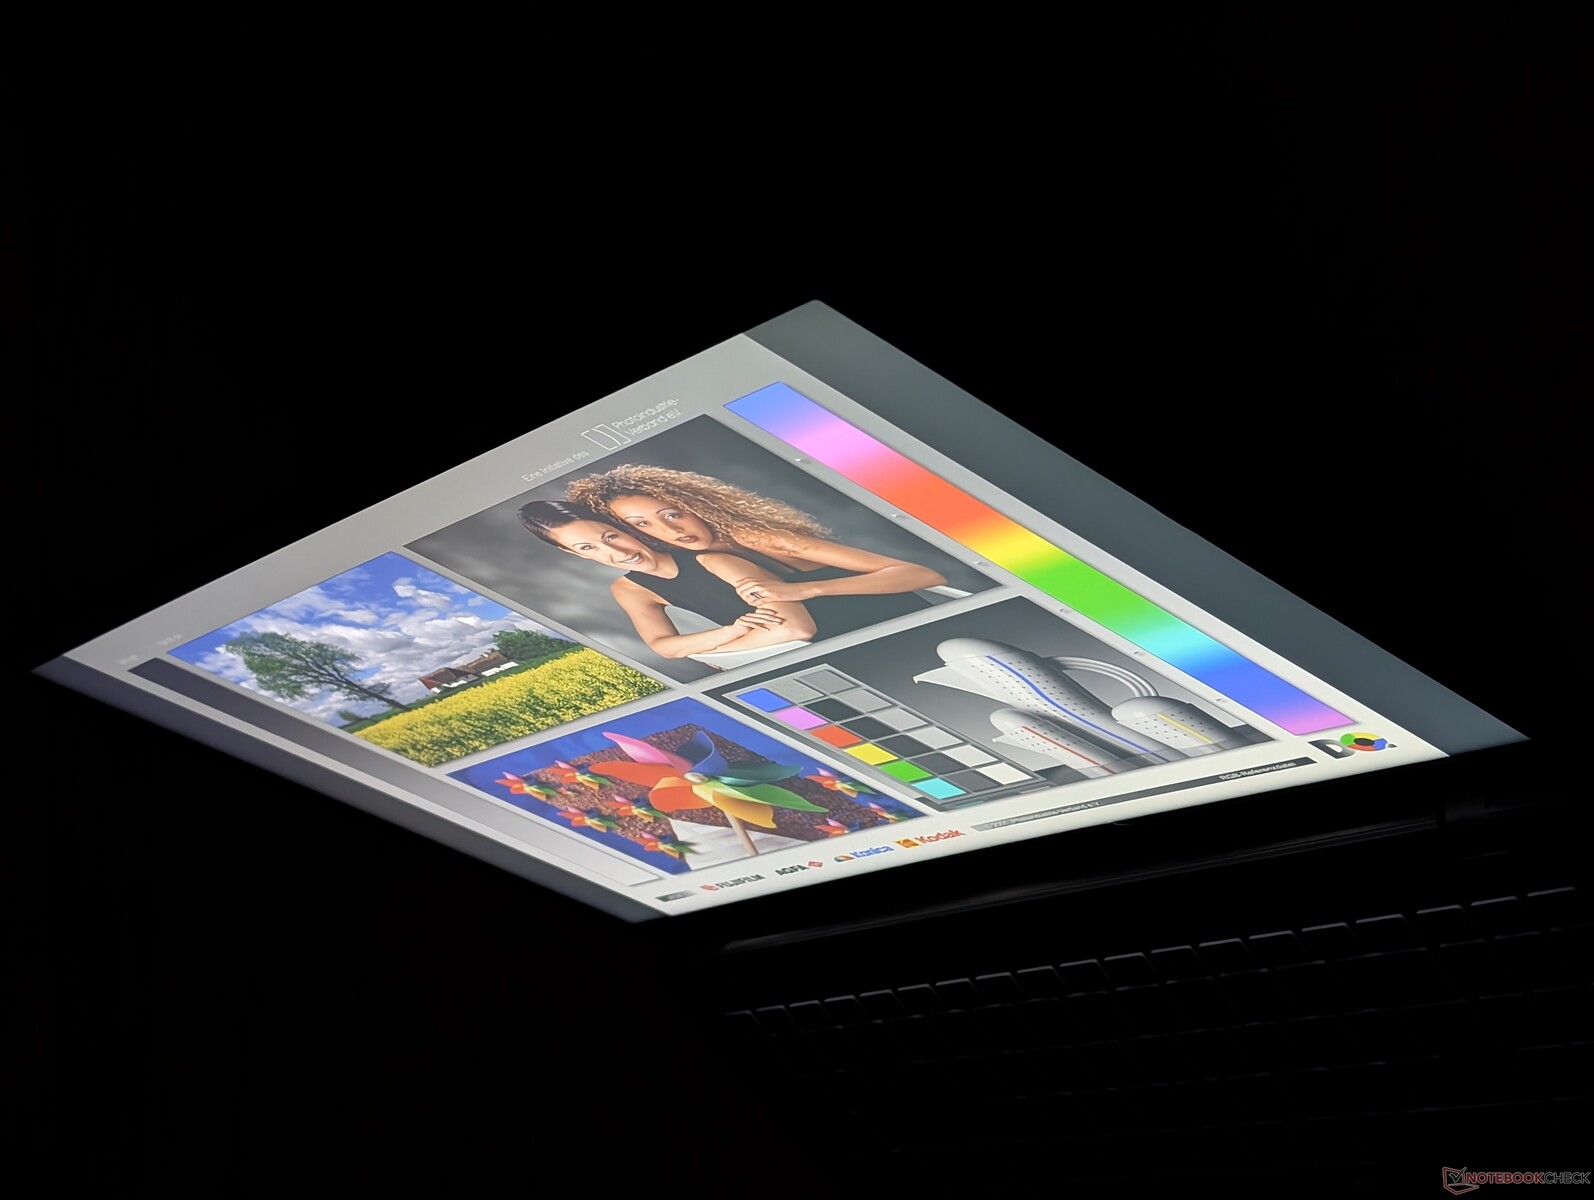
Kijelző - 144 Hz alapfelszereltség
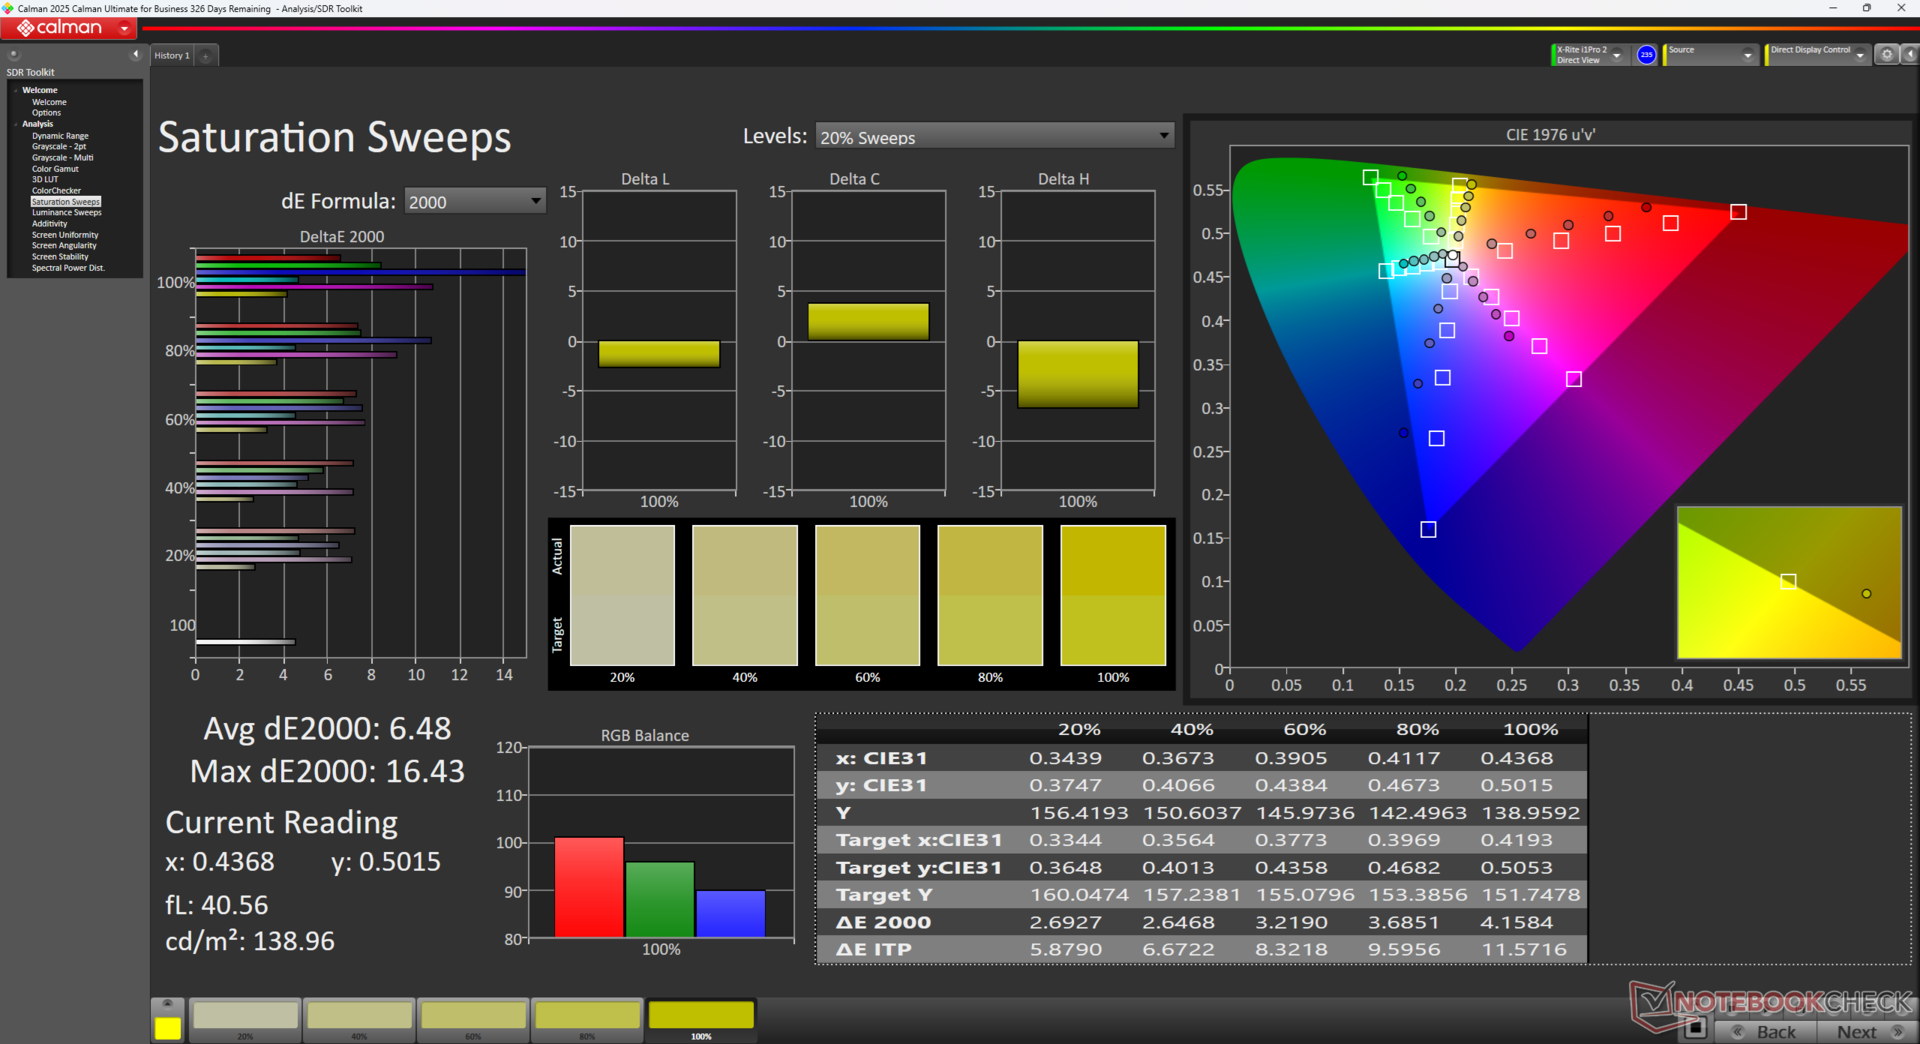
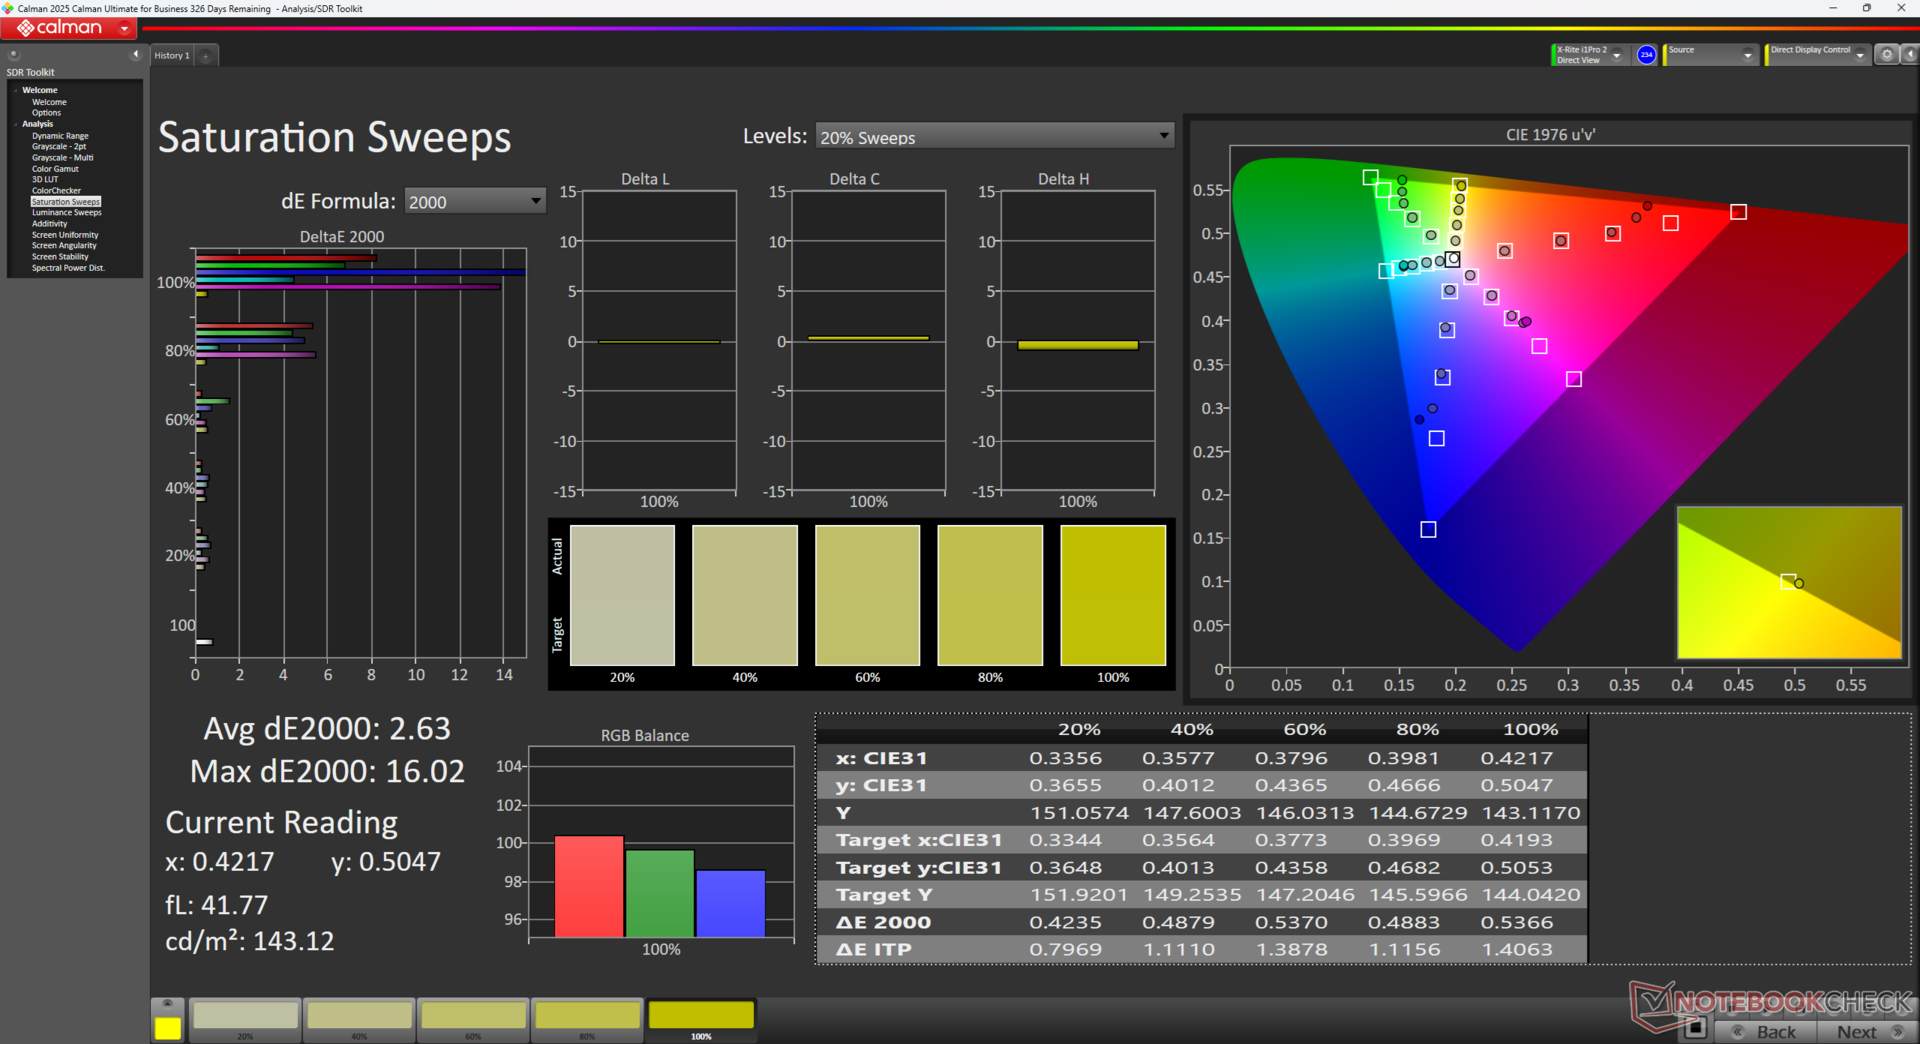
A kijelző legfigyelemreméltóbb jellemzője a 144 Hz-es natív frissítési frekvencia a vajsima kurzorvezérlés és érzékenység érdekében. Egyébként ez egy olcsó panel a szűk színeivel, alacsony kontrasztarányával és átlagos maximális fényerejével.

| |||||||||||||||||||||||||
Fényerő megoszlás: 88 %
Centrumban: 313.3 cd/m²
Kontraszt: 627:1 (Fekete: 0.5 cd/m²)
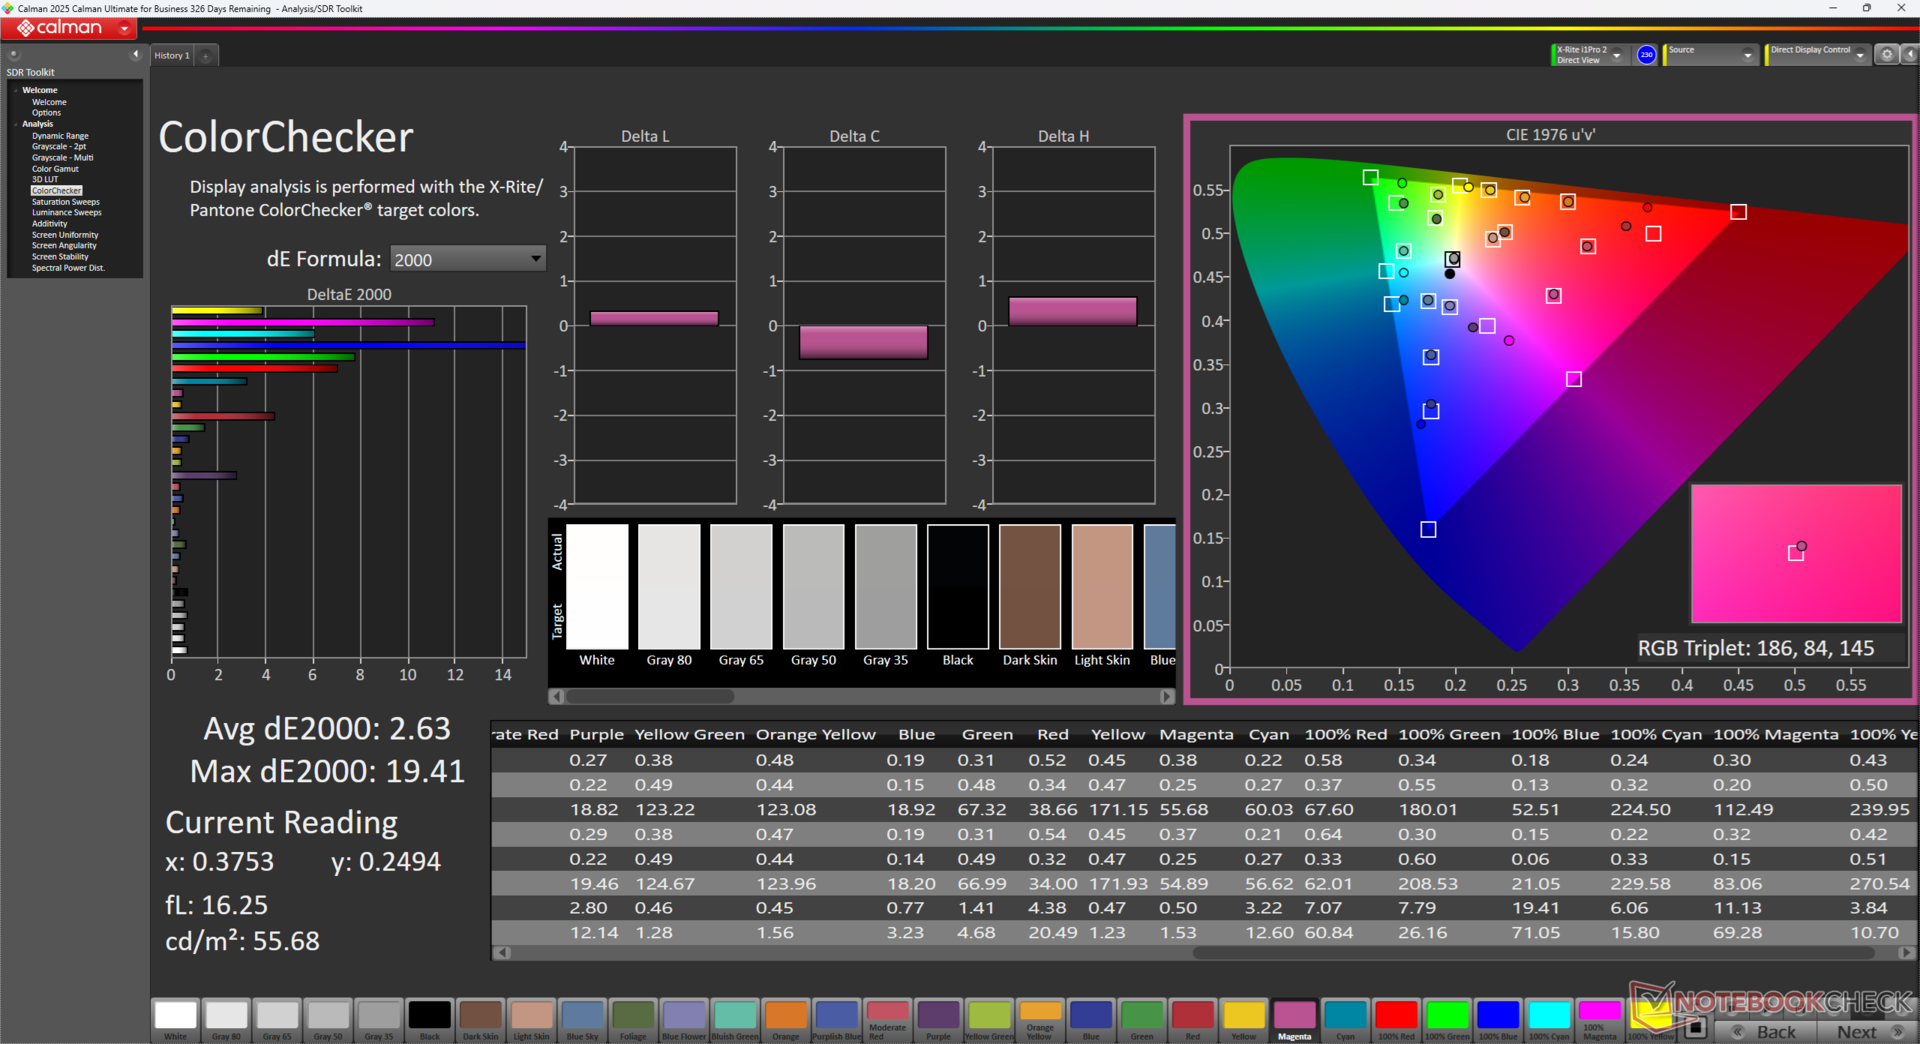
ΔE ColorChecker Calman: 6.09 | ∀{0.5-29.43 Ø4.75}
calibrated: 2.63
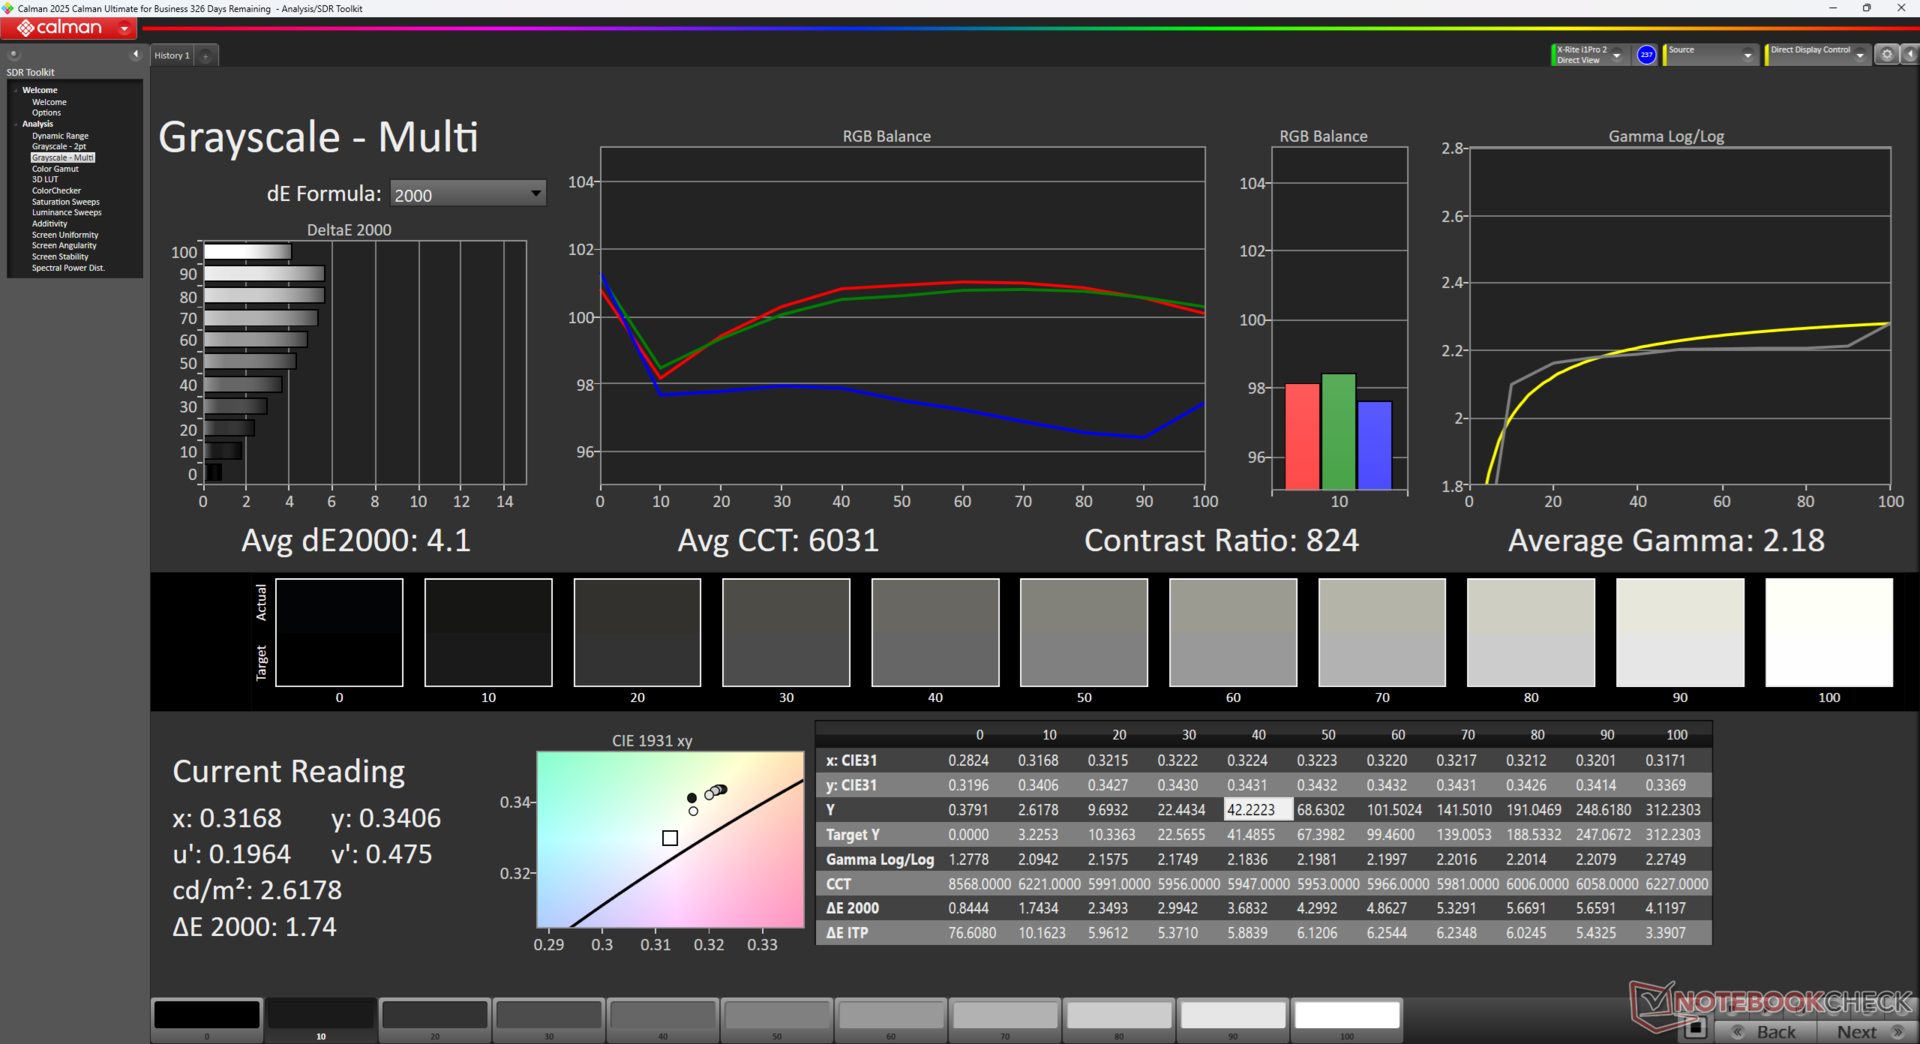
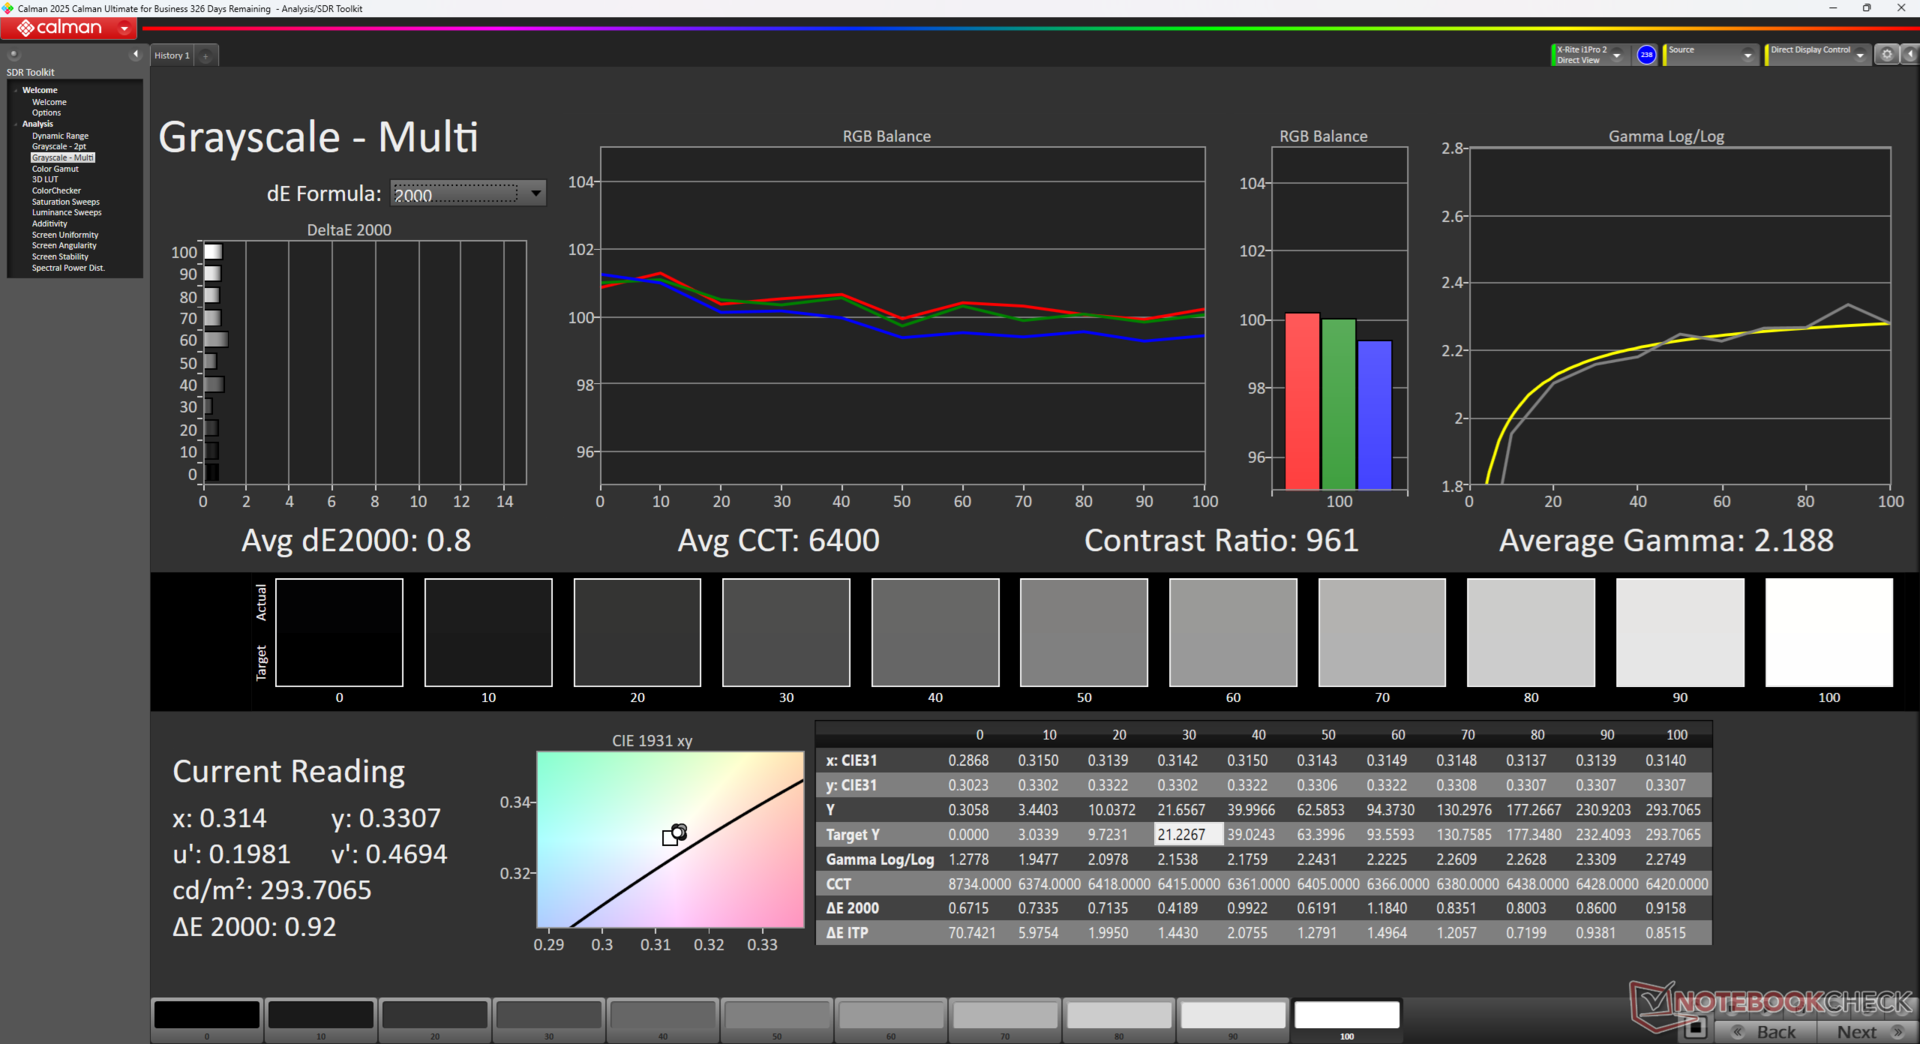
ΔE Greyscale Calman: 4.1 | ∀{0.09-98 Ø5}
42.2% AdobeRGB 1998 (Argyll 3D)
59.7% sRGB (Argyll 3D)
40.9% Display P3 (Argyll 3D)
Gamma: 2.18
CCT: 6031 K
| Asus V16 V3607V MNG007QX2-2, IPS, 1920x1200, 16", 144 Hz | Asus VivoBook Pro 16 K6602VU Samsung ATNA60BX01-1, OLED, 3200x2000, 16", 120 Hz | Dell Inspiron 16 Plus 7640 AU Optronics B160QAN, IPS, 2560x1600, 16", 120 Hz | Lenovo ThinkBook 16 G7 IML LEN160WUXGA, IPS, 1920x1200, 16", 60 Hz | HP Pavilion Plus 16-ab0456tx AU Optronics AUOFDA4, IPS, 2560x1600, 16", 120 Hz | Acer Swift Edge 16 SFE16-44-R0XV Samsung ATNA60BX03-0, OLED, 3200x2000, 16", 120 Hz | |
|---|---|---|---|---|---|---|
| Display | 112% | 78% | 2% | 76% | 115% | |
| Display P3 Coverage (%) | 40.9 | 98.7 141% | 76 86% | 41.6 2% | 74.6 82% | 99.9 144% |
| sRGB Coverage (%) | 59.7 | 99.7 67% | 99.8 67% | 61.2 3% | 99 66% | 100 68% |
| AdobeRGB 1998 Coverage (%) | 42.2 | 96.5 129% | 76.7 82% | 43 2% | 76.5 81% | 98 132% |
| Response Times | 58% | -11% | 9% | 59% | 97% | |
| Response Time Grey 50% / Grey 80% * (ms) | 22.9 ? | 0.68 ? 97% | 25.6 ? -12% | 18.4 ? 20% | 9.06 ? 60% | 0.4 ? 98% |
| Response Time Black / White * (ms) | 16.1 ? | 13.2 ? 18% | 17.6 ? -9% | 16.5 ? -2% | 6.7 ? 58% | 0.6 ? 96% |
| PWM Frequency (Hz) | 240 ? | 120 ? | ||||
| Screen | 26% | 45% | -7% | 36% | 7243% | |
| Brightness middle (cd/m²) | 313.3 | 353 13% | 314.7 0% | 321.2 3% | 403 29% | 407 30% |
| Brightness (cd/m²) | 298 | 354 19% | 291 -2% | 319 7% | 394 32% | 405 36% |
| Brightness Distribution (%) | 88 | 98 11% | 89 1% | 92 5% | 90 2% | 98 11% |
| Black Level * (cd/m²) | 0.5 | 0.28 44% | 0.37 26% | 0.34 32% | 0.001 100% | |
| Contrast (:1) | 627 | 1124 79% | 868 38% | 1185 89% | 407000 64812% | |
| Colorchecker dE 2000 * | 6.09 | 4.23 31% | 1.62 73% | 8.7 -43% | 3.13 49% | 2.27 63% |
| Colorchecker dE 2000 max. * | 19.31 | 7.13 63% | 2.94 85% | 19.85 -3% | 6.14 68% | 4.46 77% |
| Colorchecker dE 2000 calibrated * | 2.63 | 2.42 8% | 1.08 59% | 1.82 31% | 1.65 37% | 2.17 17% |
| Greyscale dE 2000 * | 4.1 | 2.5 39% | 1.3 68% | 9.2 -124% | 4.5 -10% | 2.3 44% |
| Gamma | 2.18 101% | 2.4 92% | 2.26 97% | 2.83 78% | 2.18 101% | 2.231 99% |
| CCT | 6031 108% | 6642 98% | 6385 102% | 6200 105% | 6261 104% | 6443 101% |
| Teljes átlag (program / beállítások) | 65% /
53% | 37% /
44% | 1% /
-3% | 57% /
48% | 2485% /
4695% |
* ... a kisebb jobb
Az átlagos szürkeárnyalatos és színes deltaE értékek 4,1, illetve 6,09 értéket mutatnak. Az X-Rite színmérővel végzett saját kalibrációs erőfeszítéseink ezeket az értékeket mindössze 0,8-ra és 2,63-ra javítanák.

Megjelenítési válaszidők
| ↔ Válaszidő Fekete-fehér | ||
|---|---|---|
| 16.1 ms ... emelkedés és süllyedés ↘ kombinálva | ↗ 8.2 ms emelkedés | 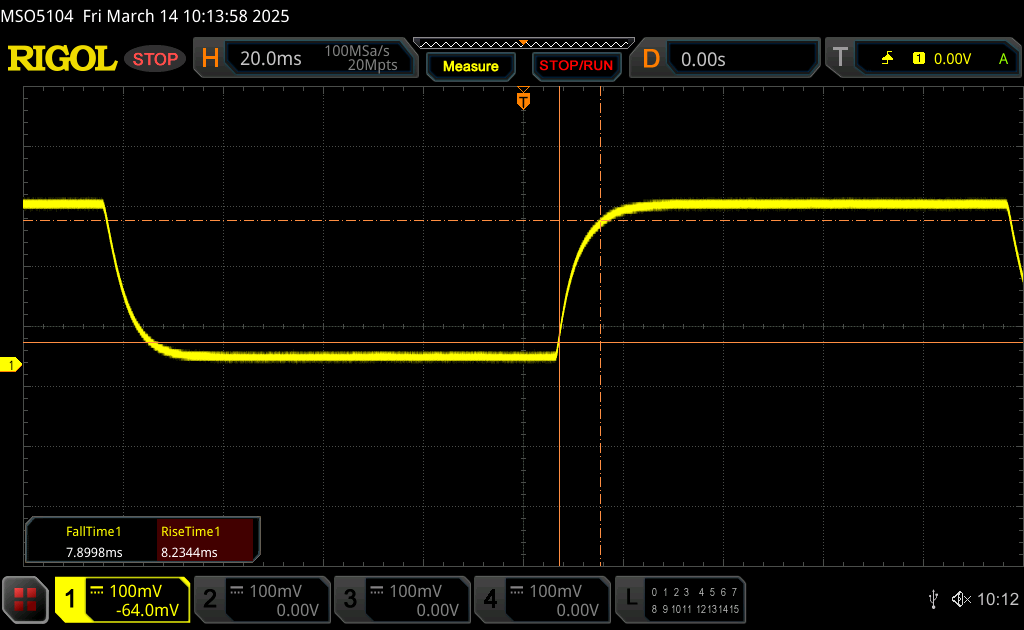 |
| ↘ 7.9 ms ősz | ||
| A képernyő jó reakciósebességet mutat tesztjeinkben, de túl lassú lehet a versenyképes játékosok számára. Összehasonlításképpen, az összes tesztelt eszköz 0.1 (minimum) és 240 (maximum) ms között mozog. » 37 % of all devices are better. Ez azt jelenti, hogy a mért válaszidő jobb, mint az összes vizsgált eszköz átlaga (20.1 ms). | ||
| ↔ Válaszidő 50% szürke és 80% szürke között | ||
| 22.9 ms ... emelkedés és süllyedés ↘ kombinálva | ↗ 11.2 ms emelkedés | 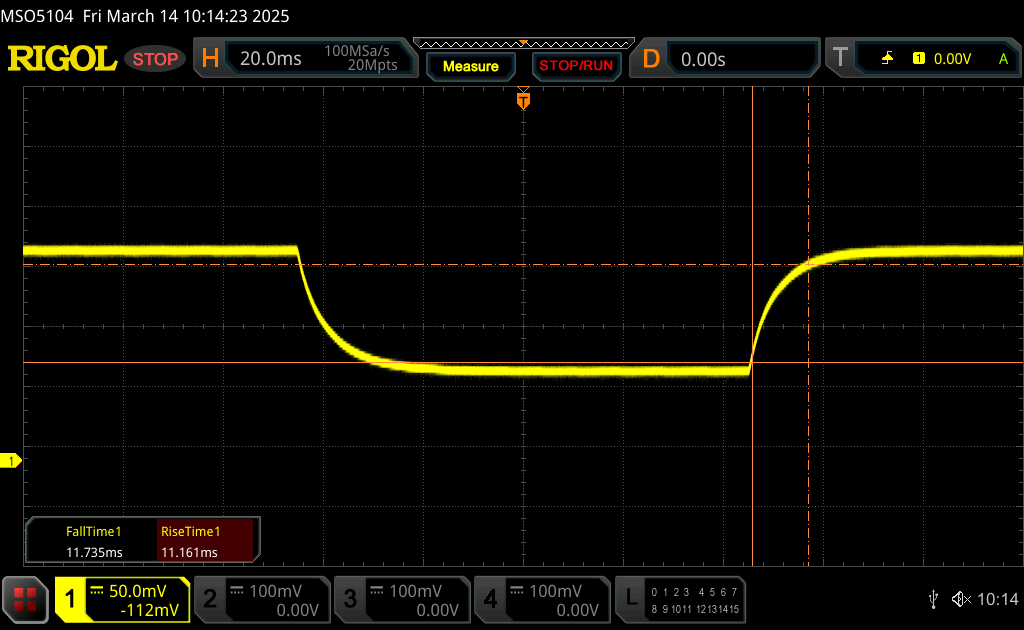 |
| ↘ 11.7 ms ősz | ||
| A képernyő jó reakciósebességet mutat tesztjeinkben, de túl lassú lehet a versenyképes játékosok számára. Összehasonlításképpen, az összes tesztelt eszköz 0.165 (minimum) és 636 (maximum) ms között mozog. » 33 % of all devices are better. Ez azt jelenti, hogy a mért válaszidő jobb, mint az összes vizsgált eszköz átlaga (31.4 ms). | ||
Képernyő villogása / PWM (impulzusszélesség-moduláció)
| Képernyő villogása / PWM nem érzékelhető | 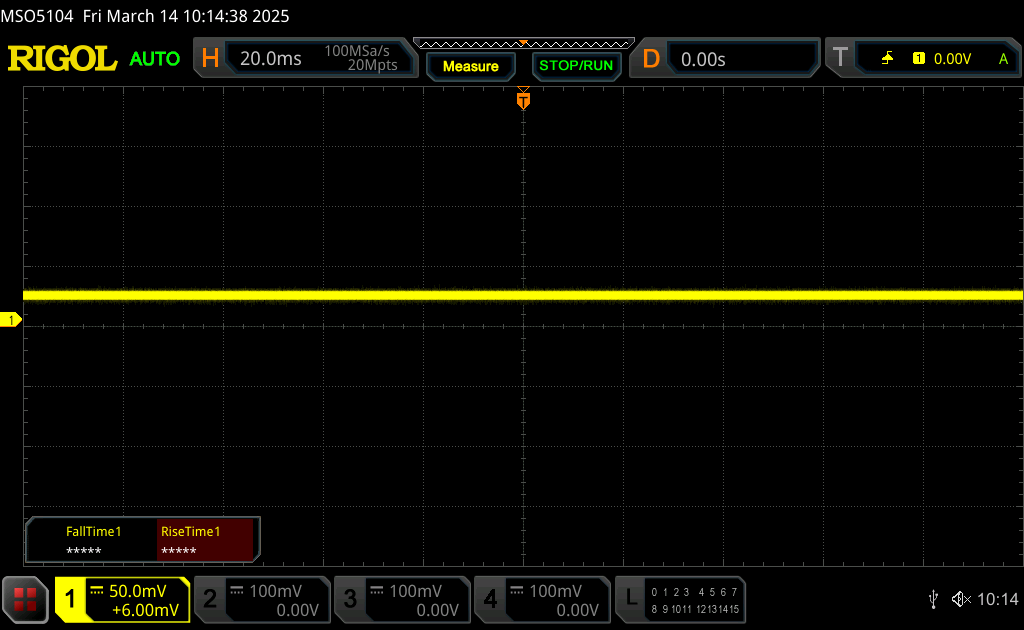 | ||
Összehasonlításképpen: az összes tesztelt eszköz 53 %-a nem használja a PWM-et a kijelző elsötétítésére. Ha PWM-et észleltek, akkor átlagosan 7986 (minimum: 5 - maximum: 343500) Hz-t mértek. | |||


Teljesítmény - Nincs említésre méltó javulás
Vizsgálati feltételek
Az alábbi benchmarkok futtatása előtt a Windows-t teljesítmény üzemmódra, a MyAsus-t pedig teljesítmény és optimalizált üzemmódra állítottuk. A diszkrét GPU teljesen kikapcsolható anélkül, hogy újra kellene indítani.
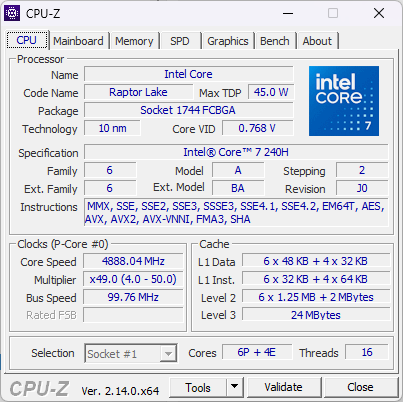
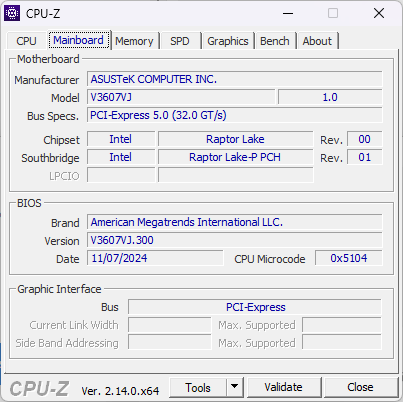
Processzor
A Core 7 240H hasonlóan teljesít, mint a Core Ultra 155H, bár a költségek csökkentése érdekében nem rendelkezik integrált NPU-val. A célközönségnek, a költségvetési játékosoknak vagy a szerkesztőknek valószínűleg nincs is szükségük az NPU-ra, illetve nem is használják azt.
Cinebench R15 Multi Loop
Cinebench R23: Multi Core | Single Core
Cinebench R20: CPU (Multi Core) | CPU (Single Core)
Cinebench R15: CPU Multi 64Bit | CPU Single 64Bit
Blender: v2.79 BMW27 CPU
7-Zip 18.03: 7z b 4 | 7z b 4 -mmt1
Geekbench 6.5: Multi-Core | Single-Core
Geekbench 5.5: Multi-Core | Single-Core
HWBOT x265 Benchmark v2.2: 4k Preset
LibreOffice : 20 Documents To PDF
R Benchmark 2.5: Overall mean
| CPU Performance rating | |
| Lenovo ThinkBook 16p G5 IRX 21N50011GE | |
| Asus TUF Gaming A16 FA608WV | |
| MSI Prestige 16 AI Evo B2HMG | |
| Lenovo ThinkPad Z16 Gen 2 | |
| Asus V16 V3607V | |
| HP Spectre x360 16 RTX 4050 -1! | |
| Átlagos Intel Core 7 240H | |
| Acer Aspire 16 A16-51GM-77G2 | |
| Cinebench R23 / Multi Core | |
| Lenovo ThinkBook 16p G5 IRX 21N50011GE | |
| Asus TUF Gaming A16 FA608WV | |
| MSI Prestige 16 AI Evo B2HMG | |
| Lenovo ThinkPad Z16 Gen 2 | |
| HP Spectre x360 16 RTX 4050 | |
| Asus V16 V3607V | |
| Átlagos Intel Core 7 240H (10488 - 16588, n=4) | |
| Acer Aspire 16 A16-51GM-77G2 | |
| Cinebench R23 / Single Core | |
| Lenovo ThinkBook 16p G5 IRX 21N50011GE | |
| MSI Prestige 16 AI Evo B2HMG | |
| Asus TUF Gaming A16 FA608WV | |
| Acer Aspire 16 A16-51GM-77G2 | |
| Asus V16 V3607V | |
| Lenovo ThinkPad Z16 Gen 2 | |
| Átlagos Intel Core 7 240H (1711 - 1905, n=4) | |
| HP Spectre x360 16 RTX 4050 | |
| Cinebench R20 / CPU (Multi Core) | |
| Lenovo ThinkBook 16p G5 IRX 21N50011GE | |
| Asus TUF Gaming A16 FA608WV | |
| MSI Prestige 16 AI Evo B2HMG | |
| Lenovo ThinkPad Z16 Gen 2 | |
| Asus V16 V3607V | |
| Átlagos Intel Core 7 240H (4535 - 6386, n=4) | |
| HP Spectre x360 16 RTX 4050 | |
| Acer Aspire 16 A16-51GM-77G2 | |
| Cinebench R20 / CPU (Single Core) | |
| Lenovo ThinkBook 16p G5 IRX 21N50011GE | |
| MSI Prestige 16 AI Evo B2HMG | |
| Asus TUF Gaming A16 FA608WV | |
| Acer Aspire 16 A16-51GM-77G2 | |
| Asus V16 V3607V | |
| Lenovo ThinkPad Z16 Gen 2 | |
| Átlagos Intel Core 7 240H (660 - 730, n=4) | |
| HP Spectre x360 16 RTX 4050 | |
| Cinebench R15 / CPU Multi 64Bit | |
| Lenovo ThinkBook 16p G5 IRX 21N50011GE | |
| Asus TUF Gaming A16 FA608WV | |
| MSI Prestige 16 AI Evo B2HMG | |
| Lenovo ThinkPad Z16 Gen 2 | |
| Asus V16 V3607V | |
| HP Spectre x360 16 RTX 4050 | |
| Átlagos Intel Core 7 240H (1800 - 2582, n=4) | |
| Acer Aspire 16 A16-51GM-77G2 | |
| Cinebench R15 / CPU Single 64Bit | |
| Lenovo ThinkBook 16p G5 IRX 21N50011GE | |
| MSI Prestige 16 AI Evo B2HMG | |
| Asus TUF Gaming A16 FA608WV | |
| Acer Aspire 16 A16-51GM-77G2 | |
| Lenovo ThinkPad Z16 Gen 2 | |
| Asus V16 V3607V | |
| Átlagos Intel Core 7 240H (246 - 276, n=4) | |
| HP Spectre x360 16 RTX 4050 | |
| Blender / v2.79 BMW27 CPU | |
| Acer Aspire 16 A16-51GM-77G2 | |
| Átlagos Intel Core 7 240H (195 - 281, n=4) | |
| Asus V16 V3607V | |
| MSI Prestige 16 AI Evo B2HMG | |
| Lenovo ThinkPad Z16 Gen 2 | |
| Asus TUF Gaming A16 FA608WV | |
| Lenovo ThinkBook 16p G5 IRX 21N50011GE | |
| 7-Zip 18.03 / 7z b 4 -mmt1 | |
| Lenovo ThinkBook 16p G5 IRX 21N50011GE | |
| Acer Aspire 16 A16-51GM-77G2 | |
| Lenovo ThinkPad Z16 Gen 2 | |
| Asus V16 V3607V | |
| Asus TUF Gaming A16 FA608WV | |
| MSI Prestige 16 AI Evo B2HMG | |
| Átlagos Intel Core 7 240H (5061 - 6172, n=4) | |
| HP Spectre x360 16 RTX 4050 | |
| Geekbench 6.5 / Multi-Core | |
| Lenovo ThinkBook 16p G5 IRX 21N50011GE | |
| MSI Prestige 16 AI Evo B2HMG | |
| Asus TUF Gaming A16 FA608WV | |
| Lenovo ThinkPad Z16 Gen 2 | |
| Átlagos Intel Core 7 240H (9713 - 13681, n=5) | |
| HP Spectre x360 16 RTX 4050 | |
| Asus V16 V3607V | |
| Acer Aspire 16 A16-51GM-77G2 | |
| Geekbench 6.5 / Single-Core | |
| Lenovo ThinkBook 16p G5 IRX 21N50011GE | |
| MSI Prestige 16 AI Evo B2HMG | |
| Asus TUF Gaming A16 FA608WV | |
| Acer Aspire 16 A16-51GM-77G2 | |
| Asus V16 V3607V | |
| Lenovo ThinkPad Z16 Gen 2 | |
| Átlagos Intel Core 7 240H (2348 - 2648, n=5) | |
| HP Spectre x360 16 RTX 4050 | |
| Geekbench 5.5 / Multi-Core | |
| Lenovo ThinkBook 16p G5 IRX 21N50011GE | |
| MSI Prestige 16 AI Evo B2HMG | |
| Asus TUF Gaming A16 FA608WV | |
| HP Spectre x360 16 RTX 4050 | |
| Lenovo ThinkPad Z16 Gen 2 | |
| Átlagos Intel Core 7 240H (8072 - 12276, n=4) | |
| Asus V16 V3607V | |
| Acer Aspire 16 A16-51GM-77G2 | |
| Geekbench 5.5 / Single-Core | |
| Lenovo ThinkBook 16p G5 IRX 21N50011GE | |
| Asus TUF Gaming A16 FA608WV | |
| MSI Prestige 16 AI Evo B2HMG | |
| Acer Aspire 16 A16-51GM-77G2 | |
| Lenovo ThinkPad Z16 Gen 2 | |
| Asus V16 V3607V | |
| Átlagos Intel Core 7 240H (1677 - 1862, n=4) | |
| HP Spectre x360 16 RTX 4050 | |
| HWBOT x265 Benchmark v2.2 / 4k Preset | |
| Lenovo ThinkBook 16p G5 IRX 21N50011GE | |
| Asus TUF Gaming A16 FA608WV | |
| MSI Prestige 16 AI Evo B2HMG | |
| Lenovo ThinkPad Z16 Gen 2 | |
| Asus V16 V3607V | |
| HP Spectre x360 16 RTX 4050 | |
| Átlagos Intel Core 7 240H (12.7 - 19, n=4) | |
| Acer Aspire 16 A16-51GM-77G2 | |
| LibreOffice / 20 Documents To PDF | |
| Átlagos Intel Core 7 240H (51.2 - 72.4, n=4) | |
| Asus V16 V3607V | |
| Asus TUF Gaming A16 FA608WV | |
| Lenovo ThinkPad Z16 Gen 2 | |
| Lenovo ThinkBook 16p G5 IRX 21N50011GE | |
| HP Spectre x360 16 RTX 4050 | |
| MSI Prestige 16 AI Evo B2HMG | |
| Acer Aspire 16 A16-51GM-77G2 | |
| R Benchmark 2.5 / Overall mean | |
| HP Spectre x360 16 RTX 4050 | |
| Átlagos Intel Core 7 240H (0.4329 - 0.4992, n=4) | |
| Lenovo ThinkPad Z16 Gen 2 | |
| Acer Aspire 16 A16-51GM-77G2 | |
| MSI Prestige 16 AI Evo B2HMG | |
| Asus V16 V3607V | |
| Asus TUF Gaming A16 FA608WV | |
| Lenovo ThinkBook 16p G5 IRX 21N50011GE | |
* ... a kisebb jobb
AIDA64: FP32 Ray-Trace | FPU Julia | CPU SHA3 | CPU Queen | FPU SinJulia | FPU Mandel | CPU AES | CPU ZLib | FP64 Ray-Trace | CPU PhotoWorxx
| Performance rating | |
| Asus VivoBook Pro 16 K6602VU | |
| HP Pavilion Plus 16-ab0456tx | |
| Dell Inspiron 16 Plus 7640 | |
| Acer Swift Edge 16 SFE16-44-R0XV | |
| Átlagos Intel Core 7 240H | |
| Asus V16 V3607V | |
| Lenovo ThinkBook 16 G7 IML | |
| AIDA64 / FP32 Ray-Trace | |
| Acer Swift Edge 16 SFE16-44-R0XV | |
| HP Pavilion Plus 16-ab0456tx | |
| Dell Inspiron 16 Plus 7640 | |
| Átlagos Intel Core 7 240H (11867 - 15629, n=4) | |
| Asus V16 V3607V | |
| Asus VivoBook Pro 16 K6602VU | |
| Lenovo ThinkBook 16 G7 IML | |
| AIDA64 / FPU Julia | |
| HP Pavilion Plus 16-ab0456tx | |
| Asus VivoBook Pro 16 K6602VU | |
| Dell Inspiron 16 Plus 7640 | |
| Átlagos Intel Core 7 240H (59260 - 78982, n=4) | |
| Acer Swift Edge 16 SFE16-44-R0XV | |
| Asus V16 V3607V | |
| Lenovo ThinkBook 16 G7 IML | |
| AIDA64 / CPU SHA3 | |
| HP Pavilion Plus 16-ab0456tx | |
| Dell Inspiron 16 Plus 7640 | |
| Asus VivoBook Pro 16 K6602VU | |
| Acer Swift Edge 16 SFE16-44-R0XV | |
| Átlagos Intel Core 7 240H (2455 - 3267, n=4) | |
| Asus V16 V3607V | |
| Lenovo ThinkBook 16 G7 IML | |
| AIDA64 / CPU Queen | |
| HP Pavilion Plus 16-ab0456tx | |
| Asus VivoBook Pro 16 K6602VU | |
| Dell Inspiron 16 Plus 7640 | |
| Acer Swift Edge 16 SFE16-44-R0XV | |
| Asus V16 V3607V | |
| Átlagos Intel Core 7 240H (75356 - 86602, n=3) | |
| Lenovo ThinkBook 16 G7 IML | |
| AIDA64 / FPU SinJulia | |
| Acer Swift Edge 16 SFE16-44-R0XV | |
| Dell Inspiron 16 Plus 7640 | |
| HP Pavilion Plus 16-ab0456tx | |
| Asus VivoBook Pro 16 K6602VU | |
| Átlagos Intel Core 7 240H (7777 - 9366, n=4) | |
| Asus V16 V3607V | |
| Lenovo ThinkBook 16 G7 IML | |
| AIDA64 / FPU Mandel | |
| Acer Swift Edge 16 SFE16-44-R0XV | |
| HP Pavilion Plus 16-ab0456tx | |
| Dell Inspiron 16 Plus 7640 | |
| Átlagos Intel Core 7 240H (29381 - 38566, n=4) | |
| Asus VivoBook Pro 16 K6602VU | |
| Asus V16 V3607V | |
| Lenovo ThinkBook 16 G7 IML | |
| AIDA64 / CPU AES | |
| Asus VivoBook Pro 16 K6602VU | |
| Dell Inspiron 16 Plus 7640 | |
| HP Pavilion Plus 16-ab0456tx | |
| Átlagos Intel Core 7 240H (50528 - 66608, n=4) | |
| Acer Swift Edge 16 SFE16-44-R0XV | |
| Asus V16 V3607V | |
| Lenovo ThinkBook 16 G7 IML | |
| AIDA64 / CPU ZLib | |
| Dell Inspiron 16 Plus 7640 | |
| HP Pavilion Plus 16-ab0456tx | |
| Asus VivoBook Pro 16 K6602VU | |
| Átlagos Intel Core 7 240H (725 - 951, n=4) | |
| Asus V16 V3607V | |
| Lenovo ThinkBook 16 G7 IML | |
| Acer Swift Edge 16 SFE16-44-R0XV | |
| AIDA64 / FP64 Ray-Trace | |
| Acer Swift Edge 16 SFE16-44-R0XV | |
| HP Pavilion Plus 16-ab0456tx | |
| Asus VivoBook Pro 16 K6602VU | |
| Átlagos Intel Core 7 240H (6389 - 8393, n=4) | |
| Dell Inspiron 16 Plus 7640 | |
| Asus V16 V3607V | |
| Lenovo ThinkBook 16 G7 IML | |
| AIDA64 / CPU PhotoWorxx | |
| HP Pavilion Plus 16-ab0456tx | |
| Dell Inspiron 16 Plus 7640 | |
| Asus VivoBook Pro 16 K6602VU | |
| Acer Swift Edge 16 SFE16-44-R0XV | |
| Átlagos Intel Core 7 240H (21710 - 44874, n=4) | |
| Lenovo ThinkBook 16 G7 IML | |
| Asus V16 V3607V | |
Stressz teszt
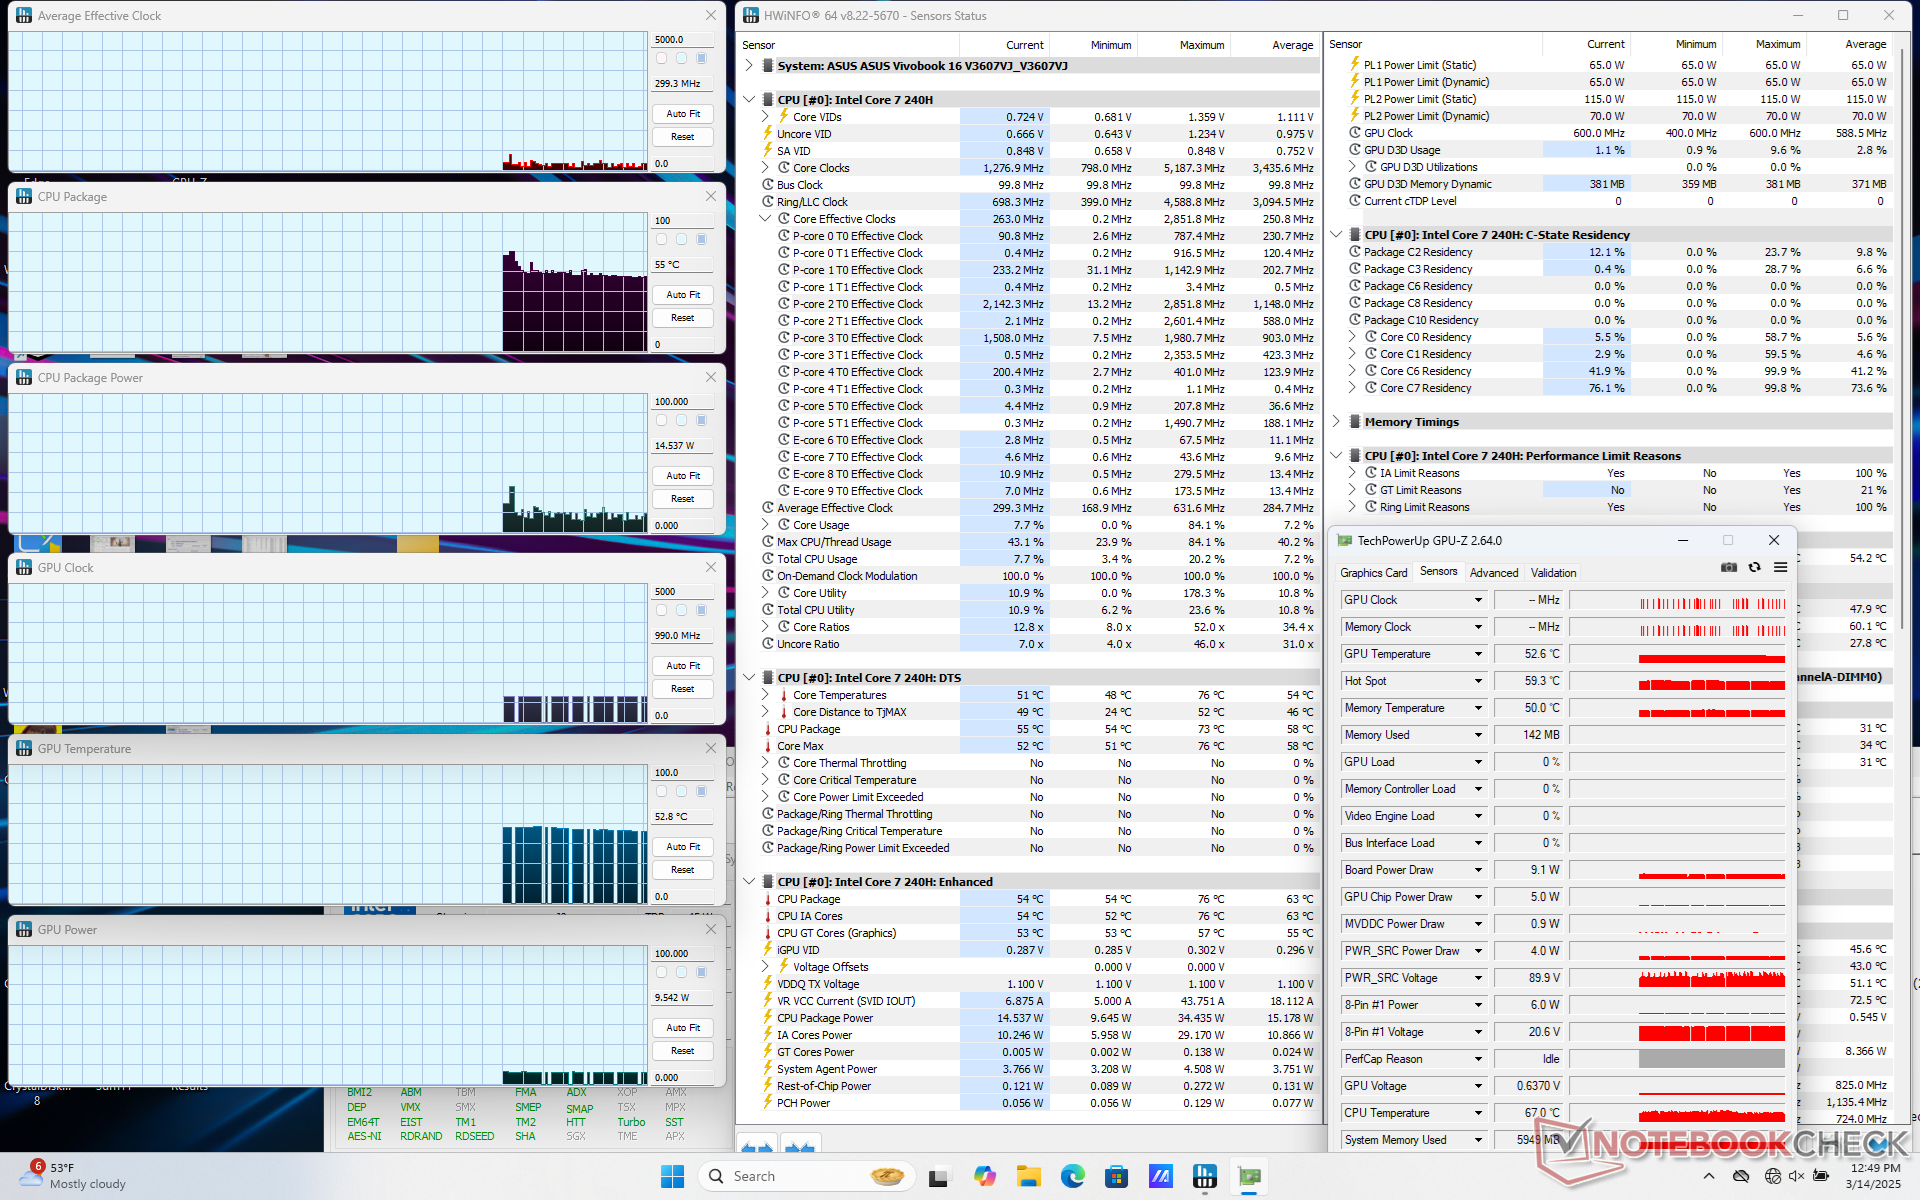
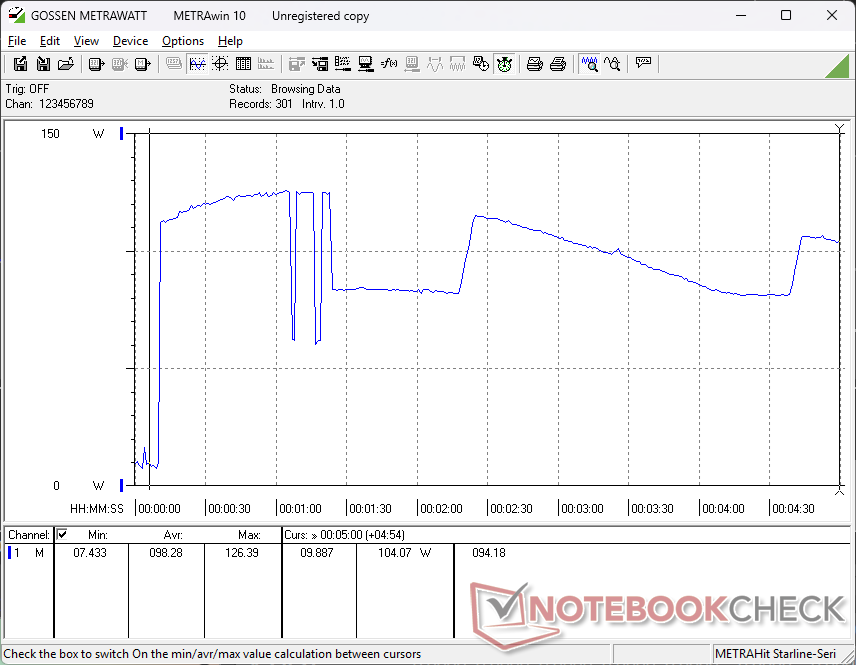
A CPU 3,9 GHz-re és 71 W-ra ugrott, és csak egy percig tartott, amíg elérte a 94 C-os maghőmérsékletet. Ezután 2,4 GHz-re és 33 W-ra csökkentette a teljesítményét, mielőtt visszapattant volna ~3,1 GHz-re és 50 W-ra.
A játékteljesítmény is enyhén csökken, ha a teljesítmény üzemmód helyett kiegyensúlyozott/szabványos üzemmódban fut. A MyAsuson elérhető egy "Full-speed" üzemmód is, de tesztjeinkben ez nem nyújt teljesítménybeli előnyöket a Performance móddal szemben.
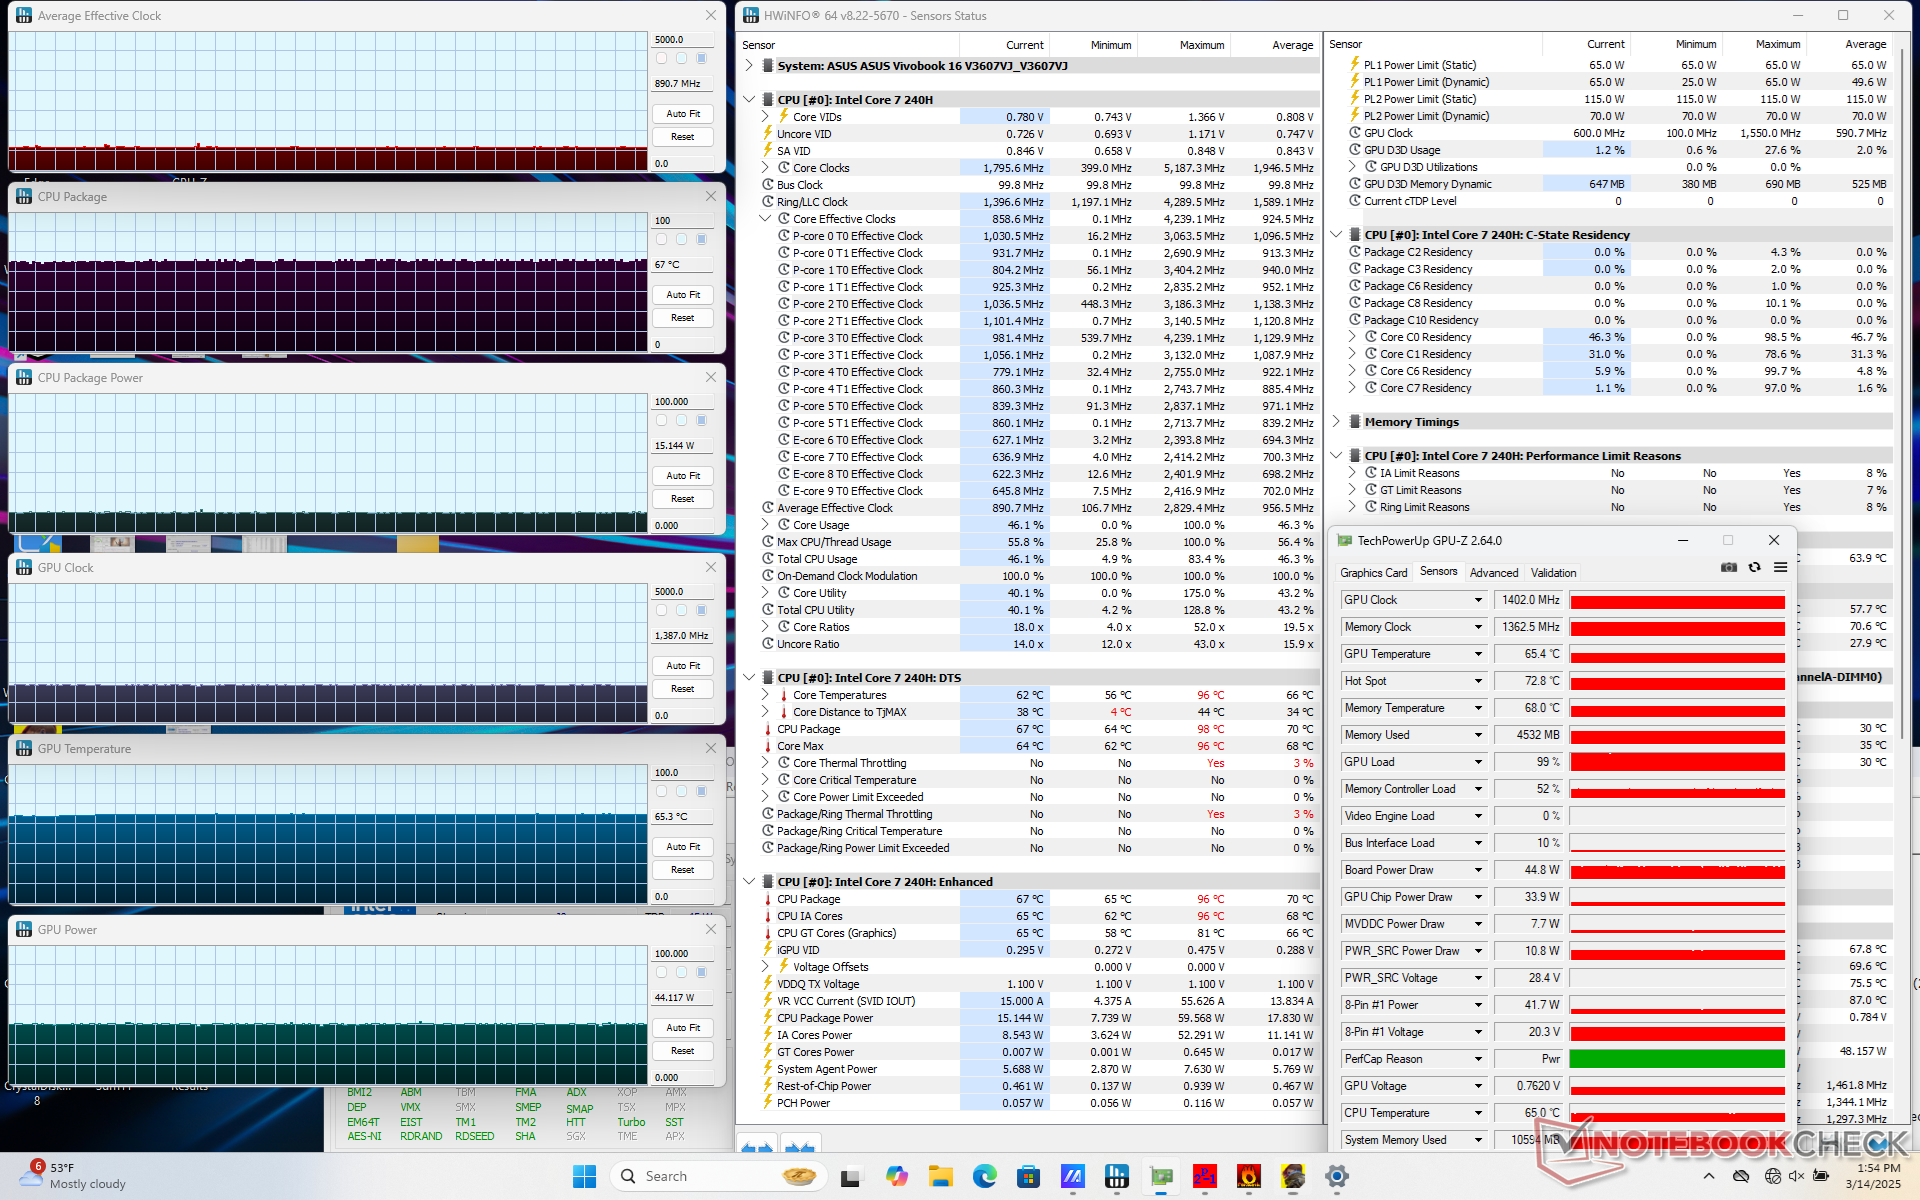
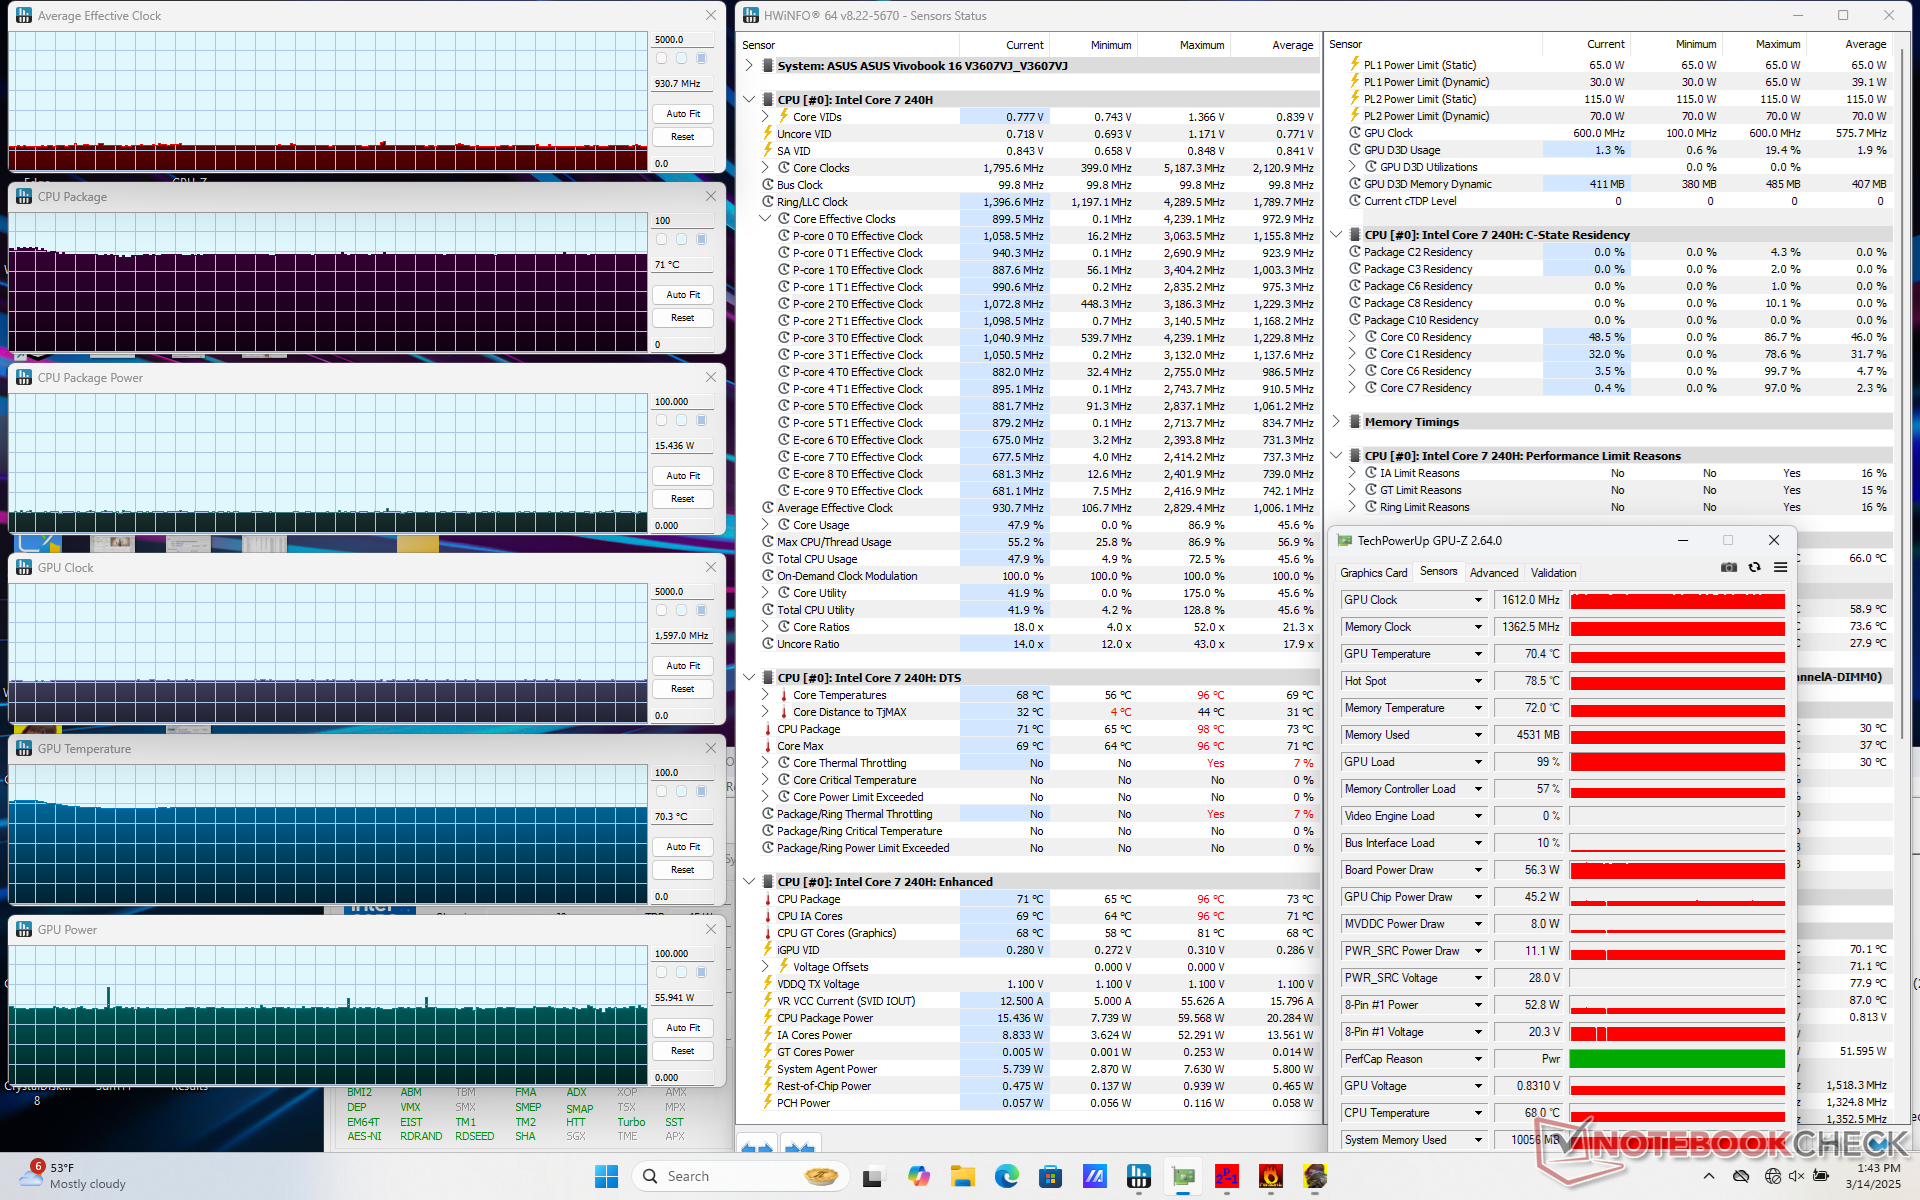
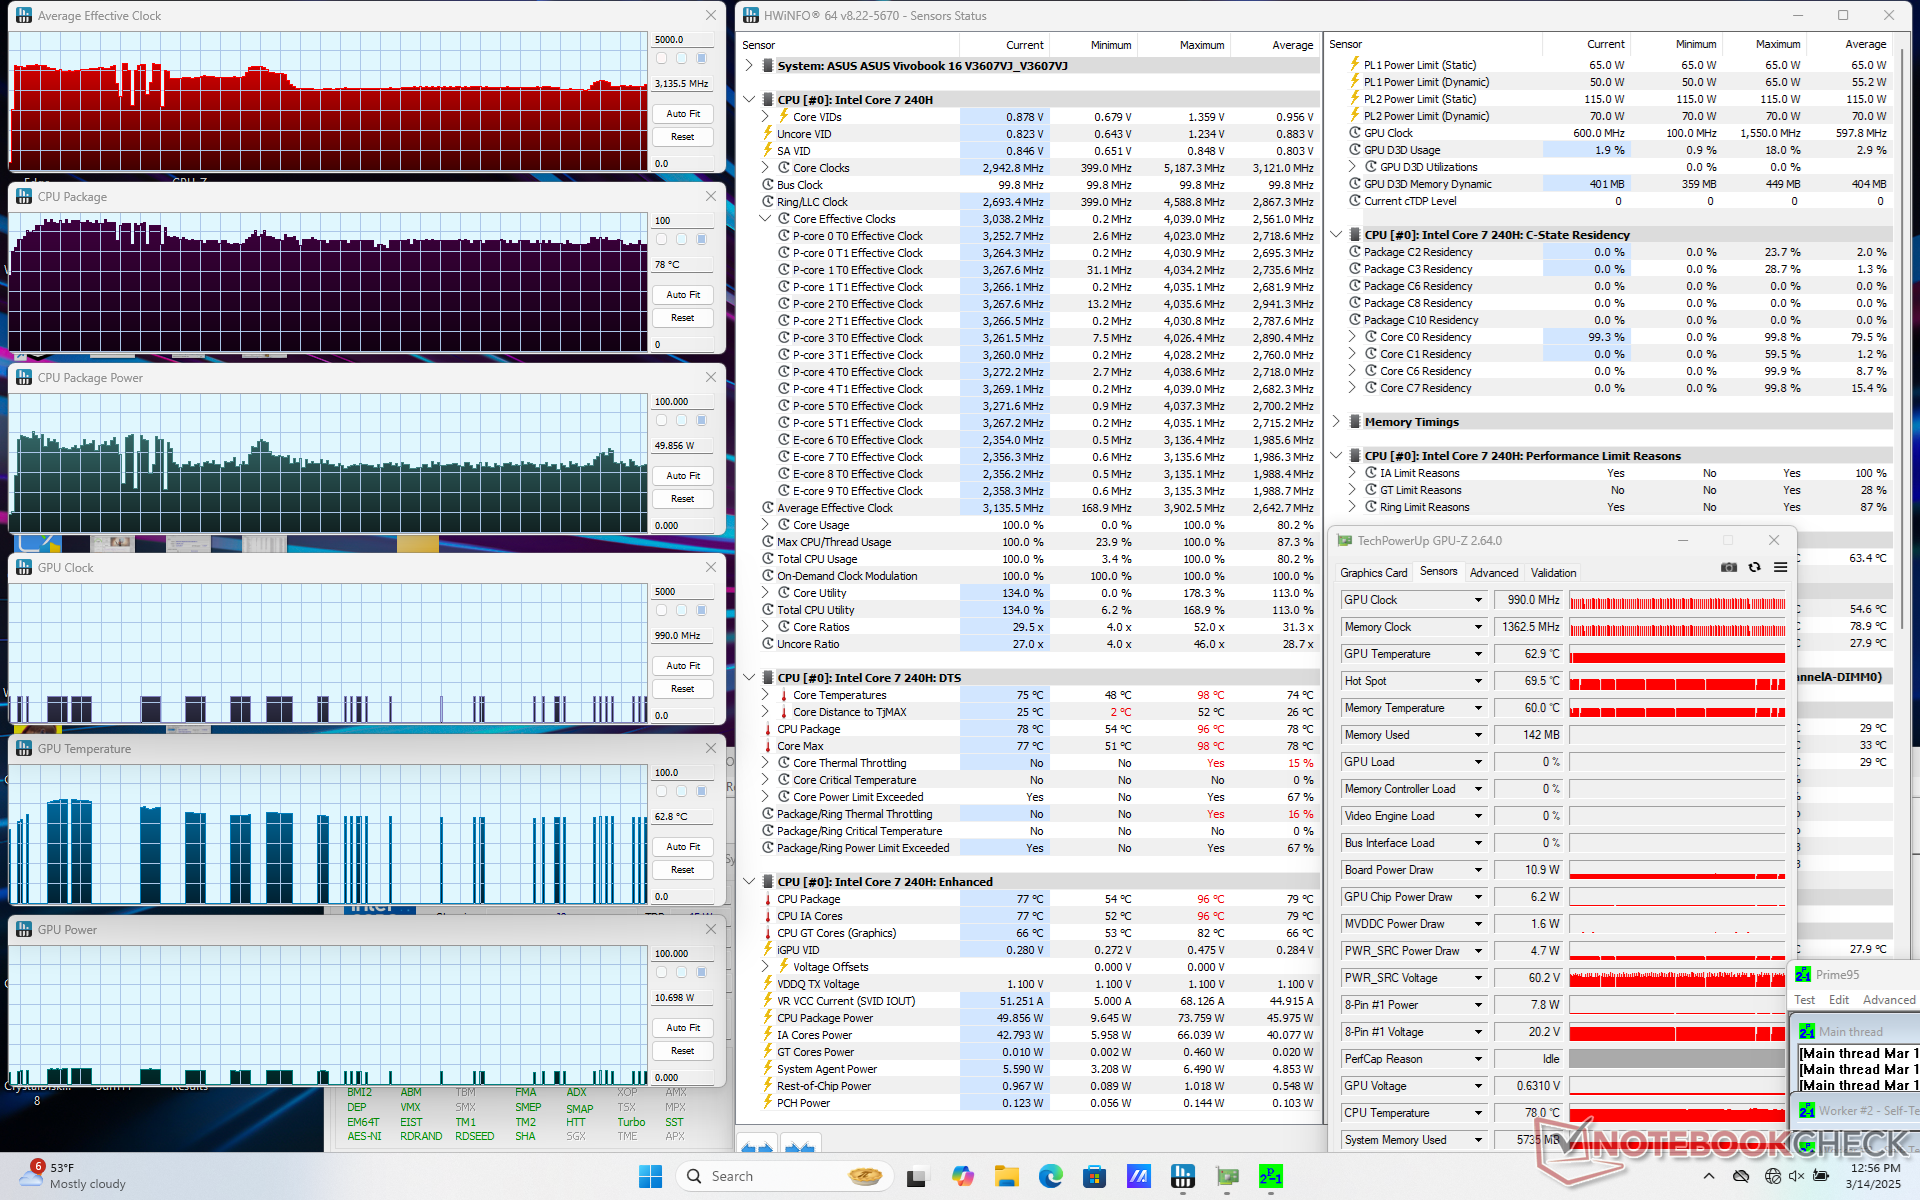
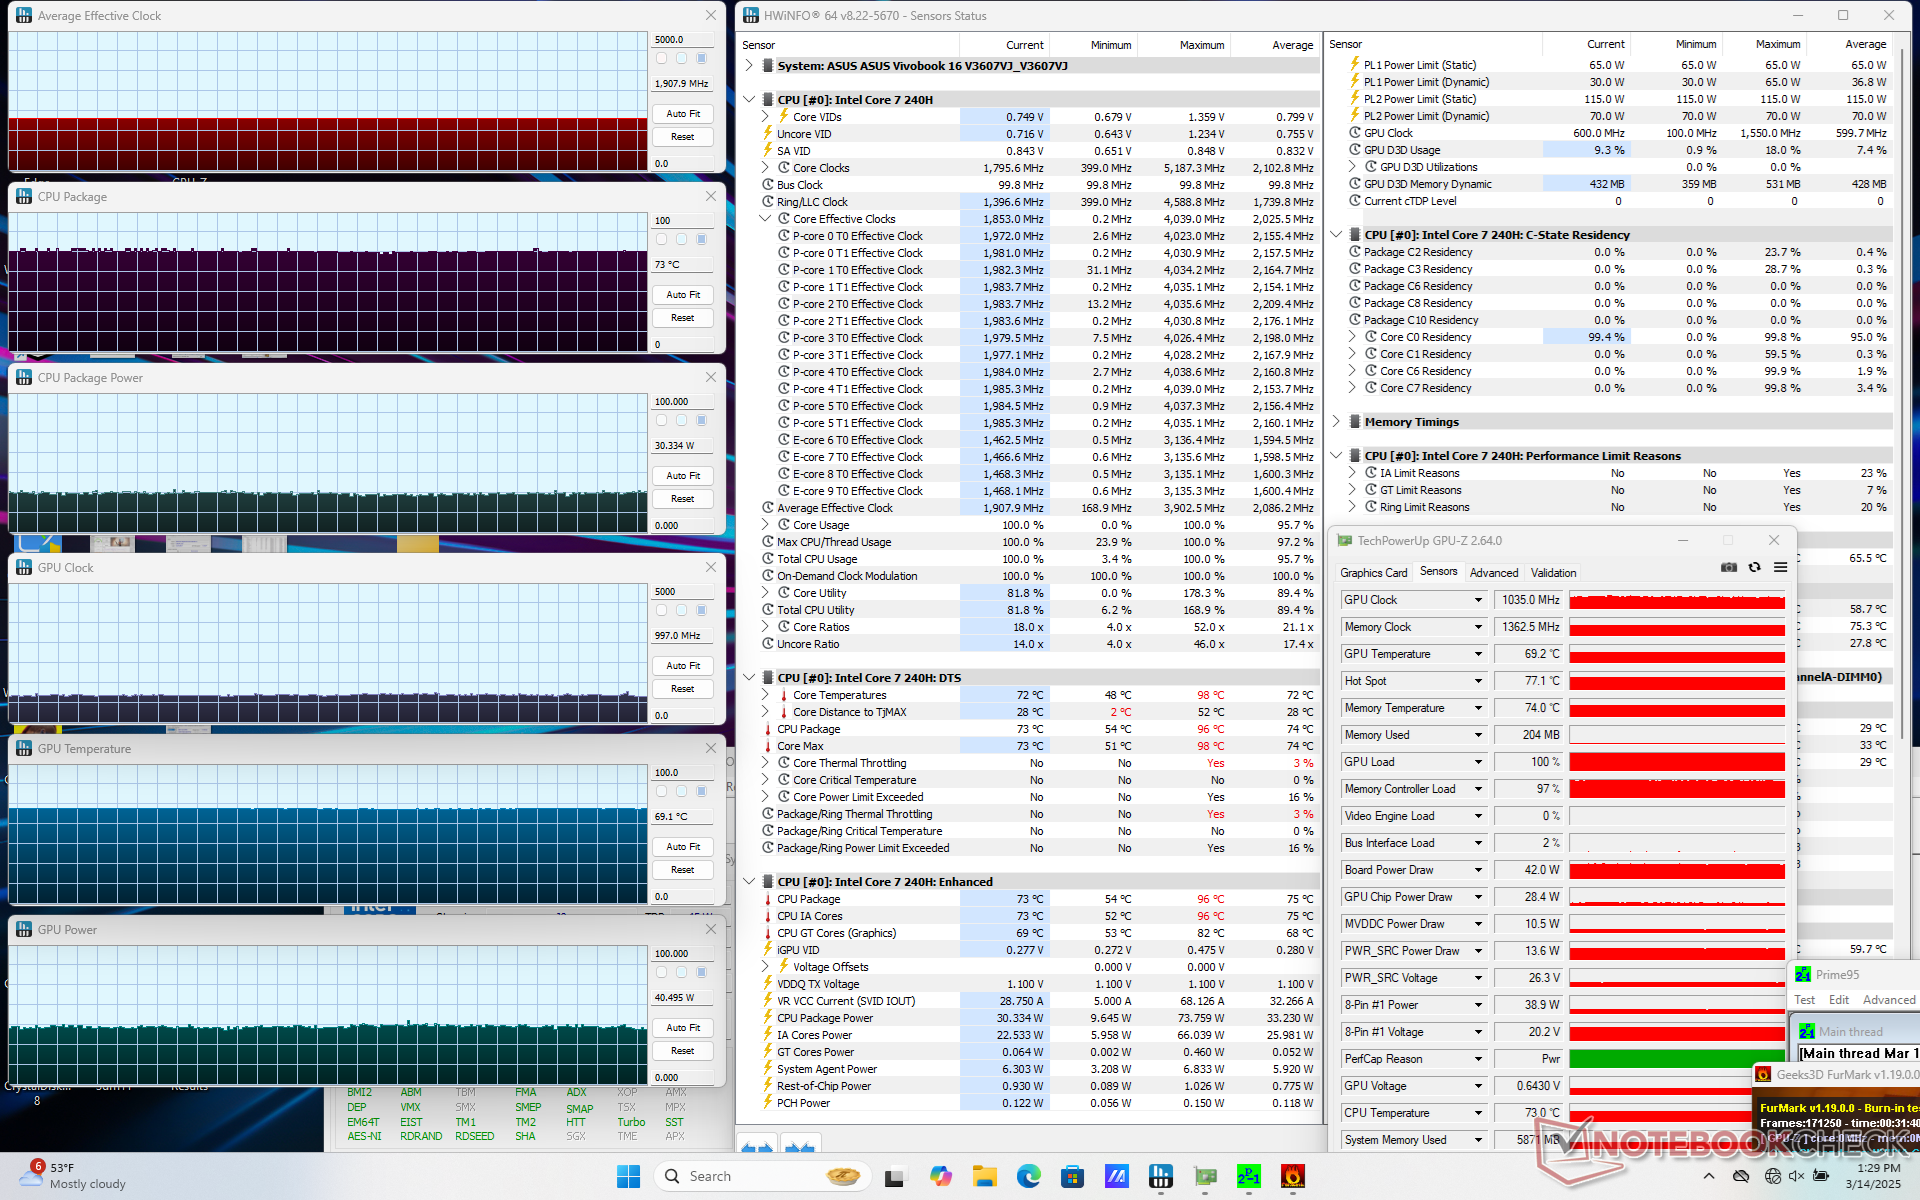
| Átlagos CPU órajel (GHz) | GPU órajel (MHz) | Átlagos CPU hőmérséklet (°C) | Átlagos GPU hőmérséklet (°C) | |
| Rendszer üresjárat | -- | -- | 55 | 53 |
| Prime95 Stressz | 3,1 | -- | 78 | 63 |
| Prime95 + FurMark Stressz | 1,9 | 1035 | 73 | 69 |
| Cyberpunk 2077 Stressz (teljesítmény mód) | 0.9 | 1612 | 71 | 70 |
| Cyberpunk 2077 Stressz (kiegyensúlyozott mód) | 0.9 | 1402 | 67 | 65 |
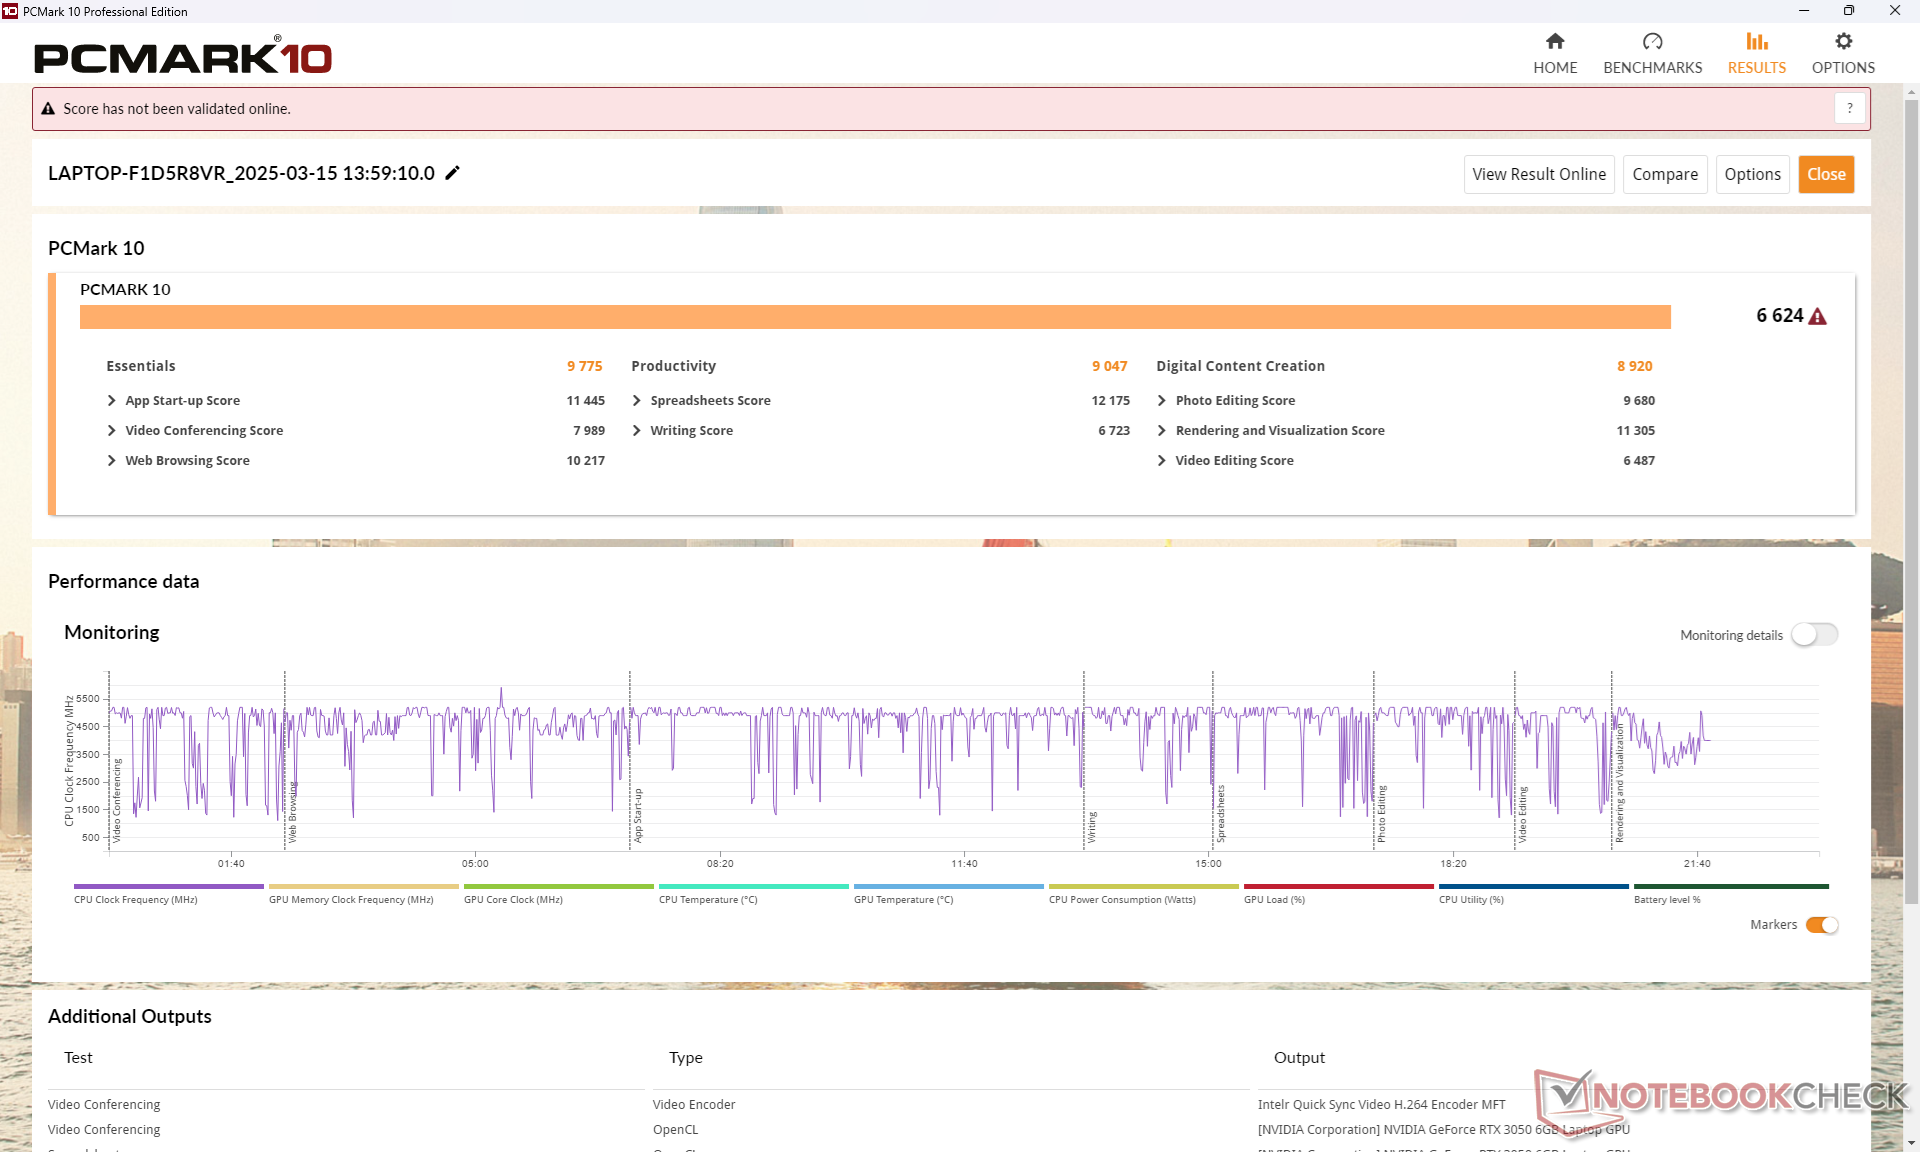
Rendszer teljesítménye
CrossMark: Overall | Productivity | Creativity | Responsiveness
WebXPRT 3: Overall
WebXPRT 4: Overall
Mozilla Kraken 1.1: Total
| PCMark 10 / Score | |
| Asus VivoBook Pro 16 K6602VU | |
| Dell Inspiron 16 Plus 7640 | |
| Asus V16 V3607V | |
| Átlagos Intel Core 7 240H, NVIDIA GeForce RTX 3050 6GB Laptop GPU (n=1) | |
| HP Pavilion Plus 16-ab0456tx | |
| Acer Swift Edge 16 SFE16-44-R0XV | |
| Lenovo ThinkBook 16 G7 IML | |
| PCMark 10 / Essentials | |
| Dell Inspiron 16 Plus 7640 | |
| Asus VivoBook Pro 16 K6602VU | |
| Acer Swift Edge 16 SFE16-44-R0XV | |
| HP Pavilion Plus 16-ab0456tx | |
| Lenovo ThinkBook 16 G7 IML | |
| Asus V16 V3607V | |
| Átlagos Intel Core 7 240H, NVIDIA GeForce RTX 3050 6GB Laptop GPU (n=1) | |
| PCMark 10 / Productivity | |
| Acer Swift Edge 16 SFE16-44-R0XV | |
| Asus V16 V3607V | |
| Átlagos Intel Core 7 240H, NVIDIA GeForce RTX 3050 6GB Laptop GPU (n=1) | |
| HP Pavilion Plus 16-ab0456tx | |
| Asus VivoBook Pro 16 K6602VU | |
| Dell Inspiron 16 Plus 7640 | |
| Lenovo ThinkBook 16 G7 IML | |
| PCMark 10 / Digital Content Creation | |
| Dell Inspiron 16 Plus 7640 | |
| Asus VivoBook Pro 16 K6602VU | |
| Asus V16 V3607V | |
| Átlagos Intel Core 7 240H, NVIDIA GeForce RTX 3050 6GB Laptop GPU (n=1) | |
| HP Pavilion Plus 16-ab0456tx | |
| Acer Swift Edge 16 SFE16-44-R0XV | |
| Lenovo ThinkBook 16 G7 IML | |
| CrossMark / Overall | |
| Asus V16 V3607V | |
| Átlagos Intel Core 7 240H, NVIDIA GeForce RTX 3050 6GB Laptop GPU (n=1) | |
| HP Pavilion Plus 16-ab0456tx | |
| Asus VivoBook Pro 16 K6602VU | |
| Dell Inspiron 16 Plus 7640 | |
| Lenovo ThinkBook 16 G7 IML | |
| CrossMark / Productivity | |
| Asus V16 V3607V | |
| Átlagos Intel Core 7 240H, NVIDIA GeForce RTX 3050 6GB Laptop GPU (n=1) | |
| Asus VivoBook Pro 16 K6602VU | |
| HP Pavilion Plus 16-ab0456tx | |
| Dell Inspiron 16 Plus 7640 | |
| Lenovo ThinkBook 16 G7 IML | |
| CrossMark / Creativity | |
| HP Pavilion Plus 16-ab0456tx | |
| Asus V16 V3607V | |
| Átlagos Intel Core 7 240H, NVIDIA GeForce RTX 3050 6GB Laptop GPU (n=1) | |
| Dell Inspiron 16 Plus 7640 | |
| Asus VivoBook Pro 16 K6602VU | |
| Lenovo ThinkBook 16 G7 IML | |
| CrossMark / Responsiveness | |
| Asus V16 V3607V | |
| Átlagos Intel Core 7 240H, NVIDIA GeForce RTX 3050 6GB Laptop GPU (n=1) | |
| Asus VivoBook Pro 16 K6602VU | |
| HP Pavilion Plus 16-ab0456tx | |
| Dell Inspiron 16 Plus 7640 | |
| Lenovo ThinkBook 16 G7 IML | |
| WebXPRT 3 / Overall | |
| Dell Inspiron 16 Plus 7640 | |
| HP Pavilion Plus 16-ab0456tx | |
| Acer Swift Edge 16 SFE16-44-R0XV | |
| Acer Swift Edge 16 SFE16-44-R0XV | |
| Lenovo ThinkBook 16 G7 IML | |
| WebXPRT 4 / Overall | |
| Asus V16 V3607V | |
| Átlagos Intel Core 7 240H, NVIDIA GeForce RTX 3050 6GB Laptop GPU (n=1) | |
| HP Pavilion Plus 16-ab0456tx | |
| Dell Inspiron 16 Plus 7640 | |
| Acer Swift Edge 16 SFE16-44-R0XV | |
| Asus VivoBook Pro 16 K6602VU | |
| Lenovo ThinkBook 16 G7 IML | |
| Mozilla Kraken 1.1 / Total | |
| Lenovo ThinkBook 16 G7 IML | |
| Acer Swift Edge 16 SFE16-44-R0XV | |
| Acer Swift Edge 16 SFE16-44-R0XV | |
| Asus VivoBook Pro 16 K6602VU | |
| Dell Inspiron 16 Plus 7640 | |
| Asus V16 V3607V | |
| Átlagos Intel Core 7 240H, NVIDIA GeForce RTX 3050 6GB Laptop GPU (n=1) | |
| HP Pavilion Plus 16-ab0456tx | |
* ... a kisebb jobb
| PCMark 10 Score | 6624 pontok | |
Segítség | ||
| AIDA64 / Memory Copy | |
| Acer Swift Edge 16 SFE16-44-R0XV | |
| HP Pavilion Plus 16-ab0456tx | |
| Dell Inspiron 16 Plus 7640 | |
| Asus VivoBook Pro 16 K6602VU | |
| Átlagos Intel Core 7 240H (34965 - 69215, n=4) | |
| Lenovo ThinkBook 16 G7 IML | |
| Asus V16 V3607V | |
| AIDA64 / Memory Read | |
| Dell Inspiron 16 Plus 7640 | |
| Asus VivoBook Pro 16 K6602VU | |
| HP Pavilion Plus 16-ab0456tx | |
| Átlagos Intel Core 7 240H (39706 - 71870, n=4) | |
| Acer Swift Edge 16 SFE16-44-R0XV | |
| Asus V16 V3607V | |
| Lenovo ThinkBook 16 G7 IML | |
| AIDA64 / Memory Write | |
| Acer Swift Edge 16 SFE16-44-R0XV | |
| HP Pavilion Plus 16-ab0456tx | |
| Dell Inspiron 16 Plus 7640 | |
| Asus VivoBook Pro 16 K6602VU | |
| Átlagos Intel Core 7 240H (33560 - 79823, n=4) | |
| Lenovo ThinkBook 16 G7 IML | |
| Asus V16 V3607V | |
| AIDA64 / Memory Latency | |
| Lenovo ThinkBook 16 G7 IML | |
| Dell Inspiron 16 Plus 7640 | |
| Acer Swift Edge 16 SFE16-44-R0XV | |
| Átlagos Intel Core 7 240H (97.1 - 106.5, n=4) | |
| Asus V16 V3607V | |
| Asus VivoBook Pro 16 K6602VU | |
| HP Pavilion Plus 16-ab0456tx | |
* ... a kisebb jobb
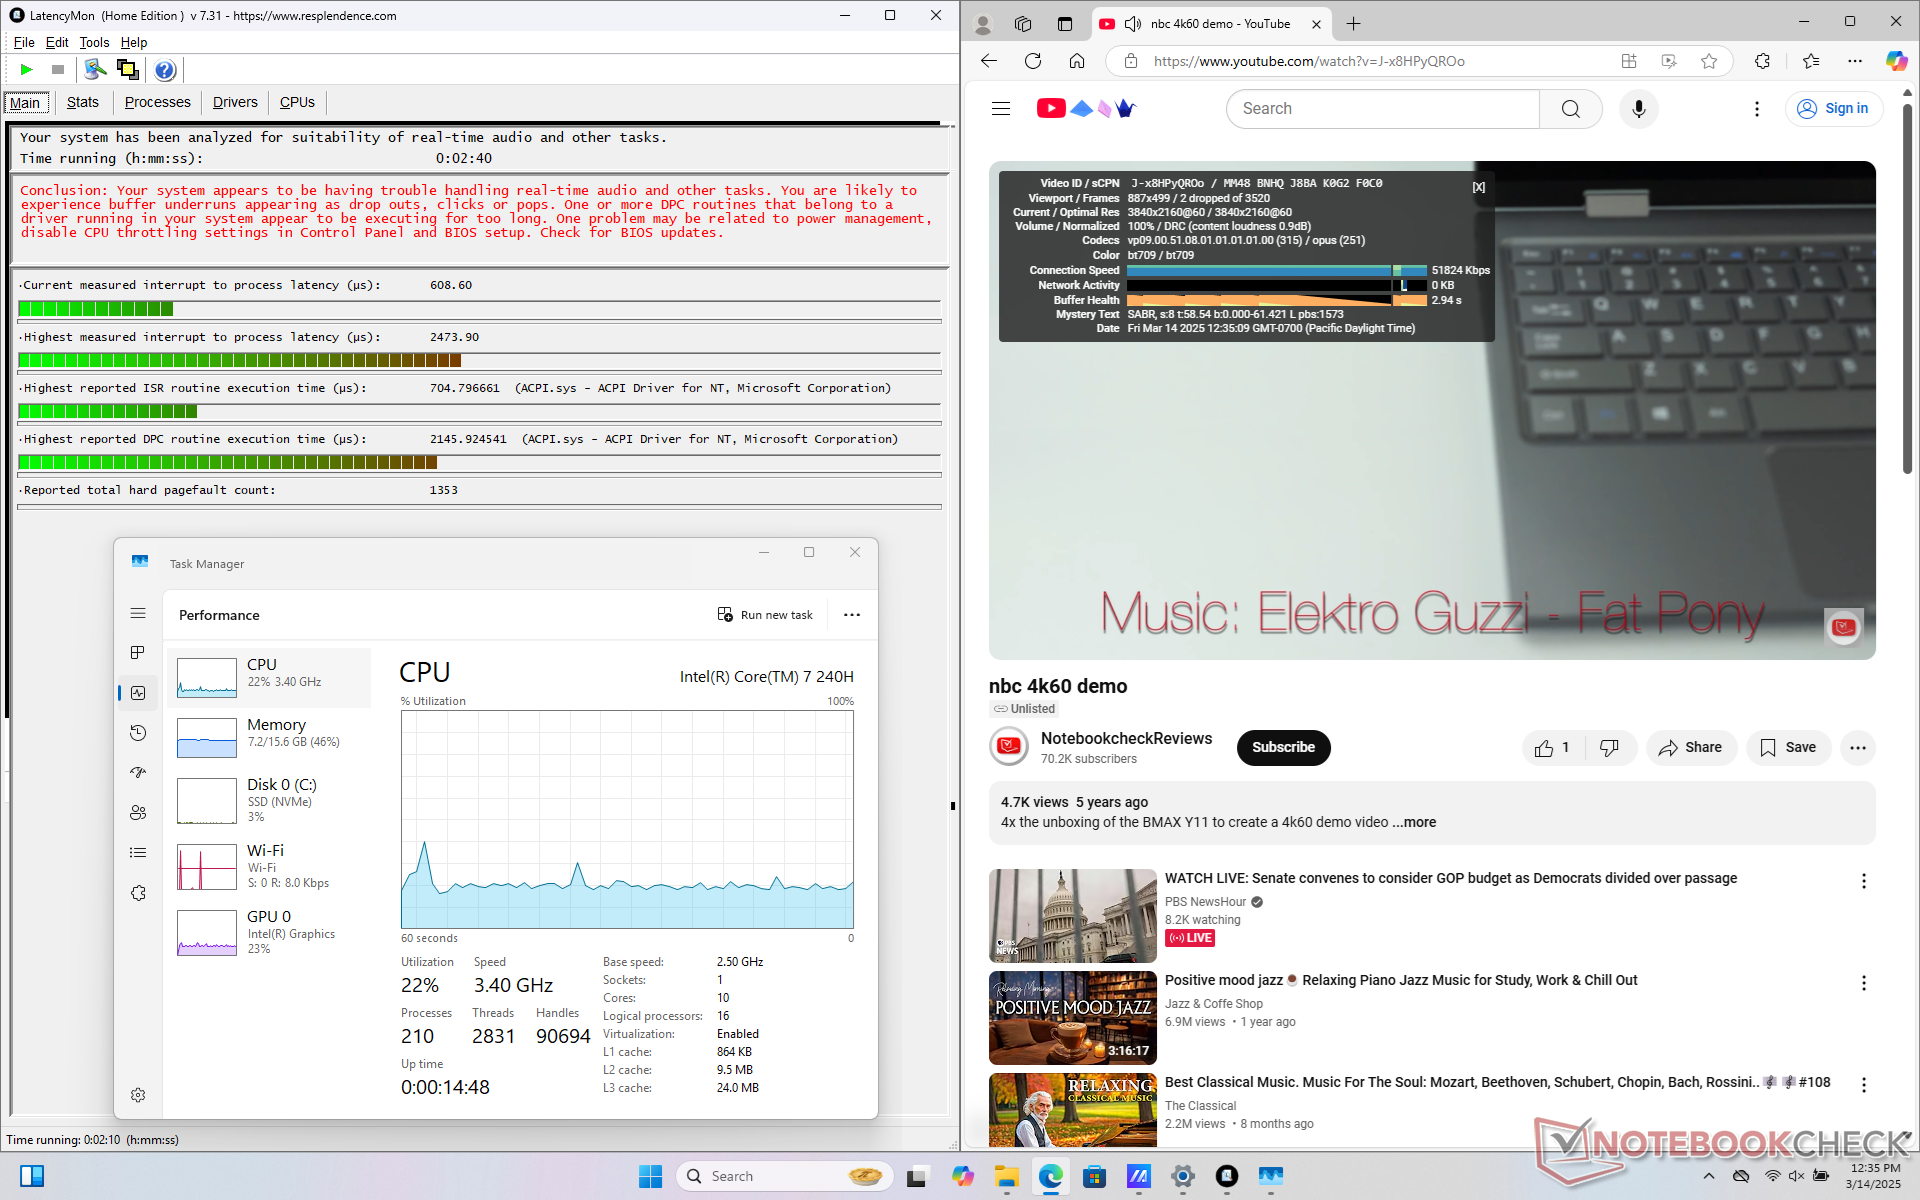
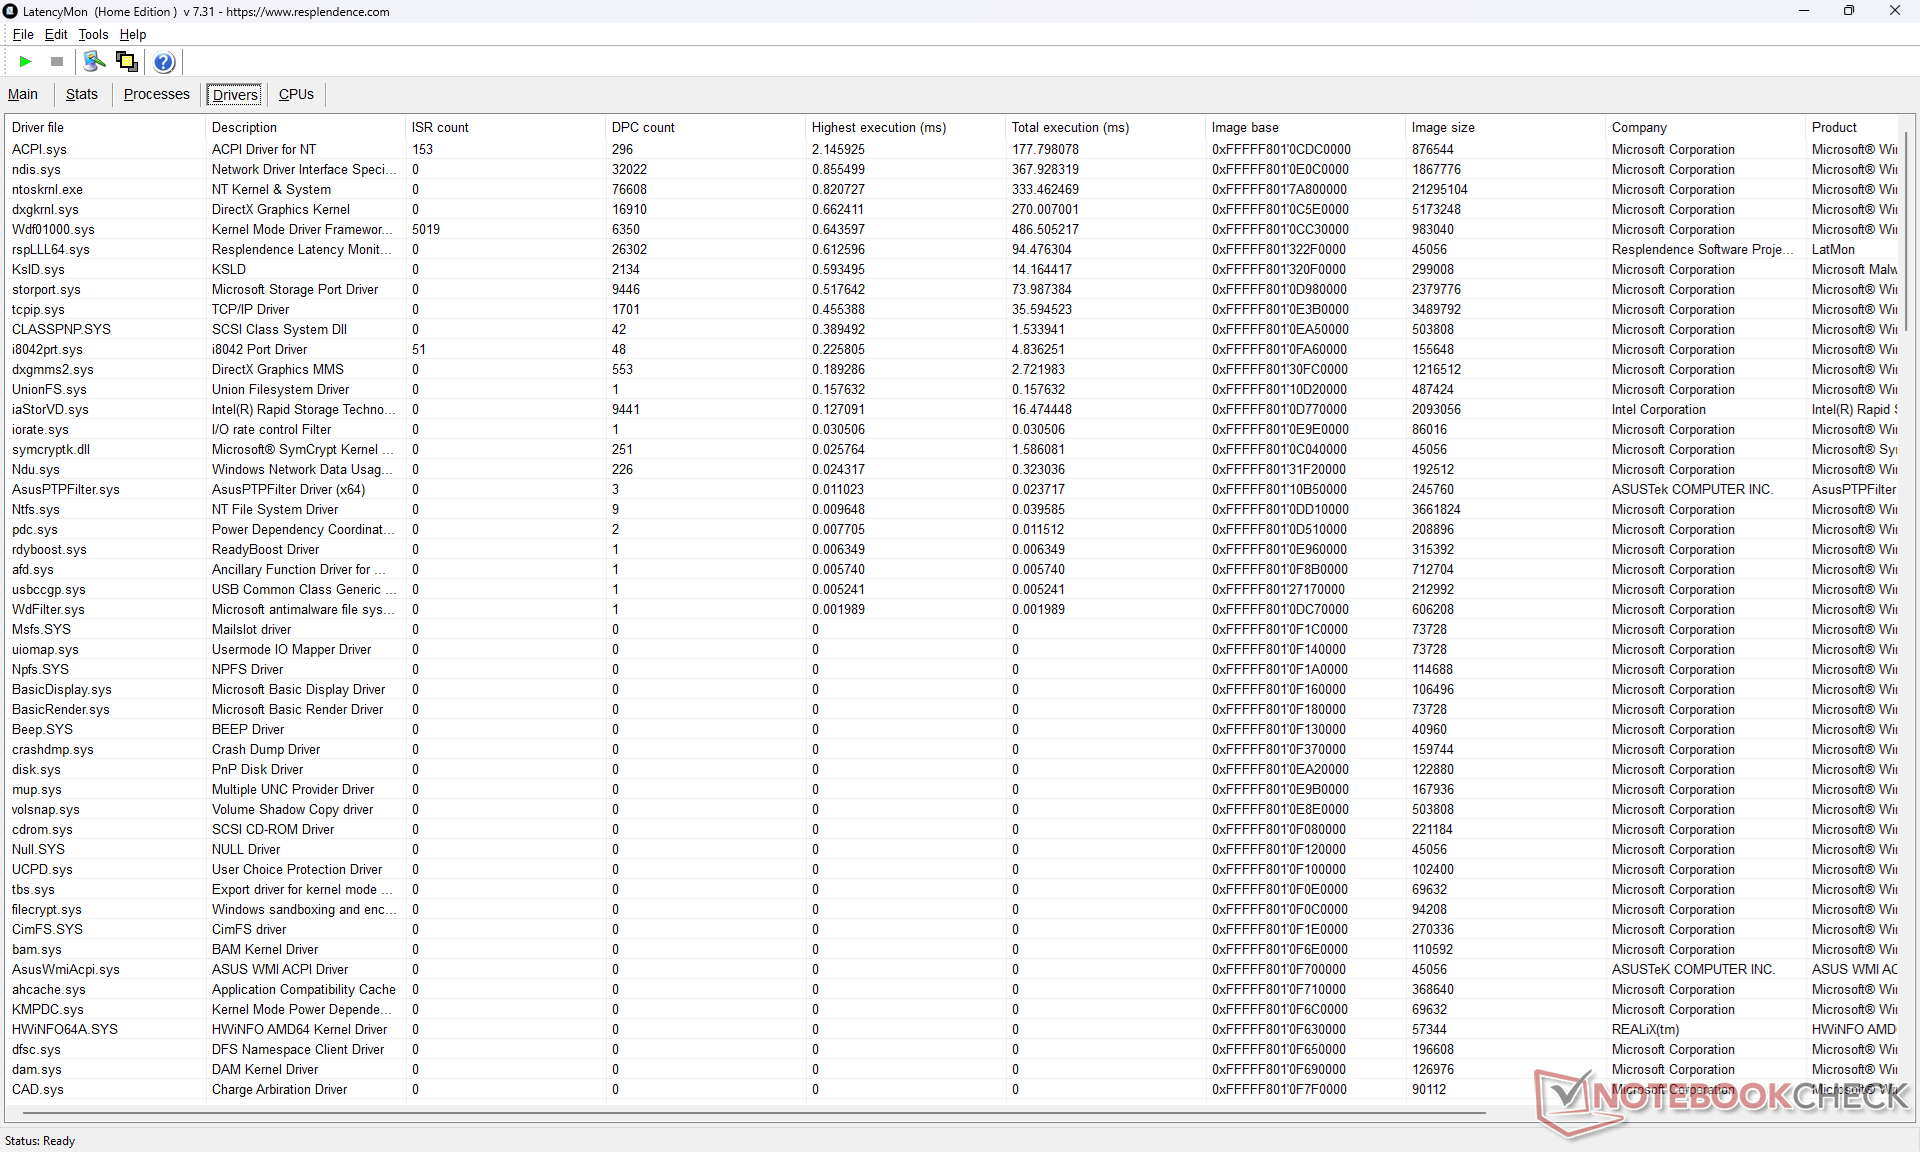
DPC késleltetés
A LatencyMon a honlapunk több lapjának megnyitásakor DPC-problémákat mutat, és csak néhány kiesett képkockát a 4K60-as videolejátszási tesztünk során.
| DPC Latencies / LatencyMon - interrupt to process latency (max), Web, Youtube, Prime95 | |
| Acer Swift Edge 16 SFE16-44-R0XV | |
| HP Pavilion Plus 16-ab0456tx | |
| Asus V16 V3607V | |
| Asus VivoBook Pro 16 K6602VU | |
| Lenovo ThinkBook 16 G7 IML | |
| Dell Inspiron 16 Plus 7640 | |
* ... a kisebb jobb
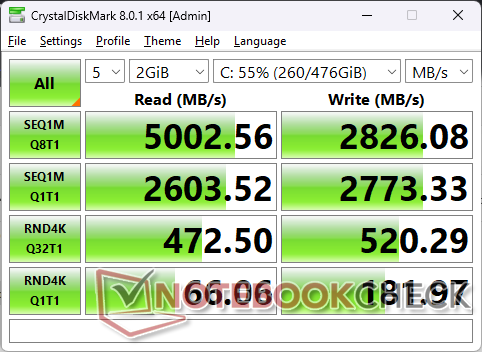
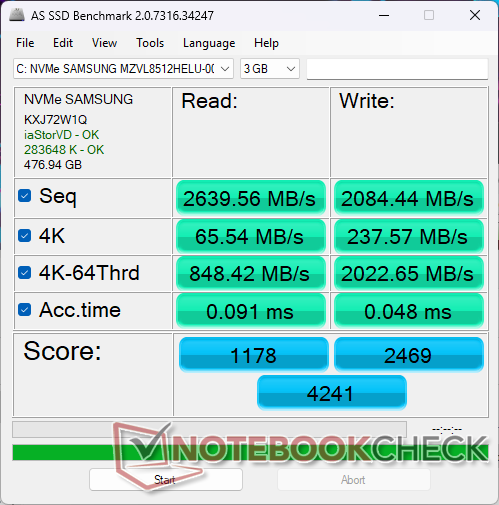
Tárolóeszközök
Az 512 GB-os Samsung MZVL851212HELU PCIe4 SSD maximális sebessége alig 5000 MB/s alatt van. A teljesítmény azonban néhány perc használat után lecsökken, ahogy az alábbi grafikonunk is mutatja.

| Drive Performance rating - Percent | |
| Acer Swift Edge 16 SFE16-44-R0XV | |
| HP Pavilion Plus 16-ab0456tx | |
| Asus V16 V3607V | |
| Asus VivoBook Pro 16 K6602VU | |
| Dell Inspiron 16 Plus 7640 | |
| Lenovo ThinkBook 16 G7 IML | |
* ... a kisebb jobb
Disk Throttling: DiskSpd Read Loop, Queue Depth 8
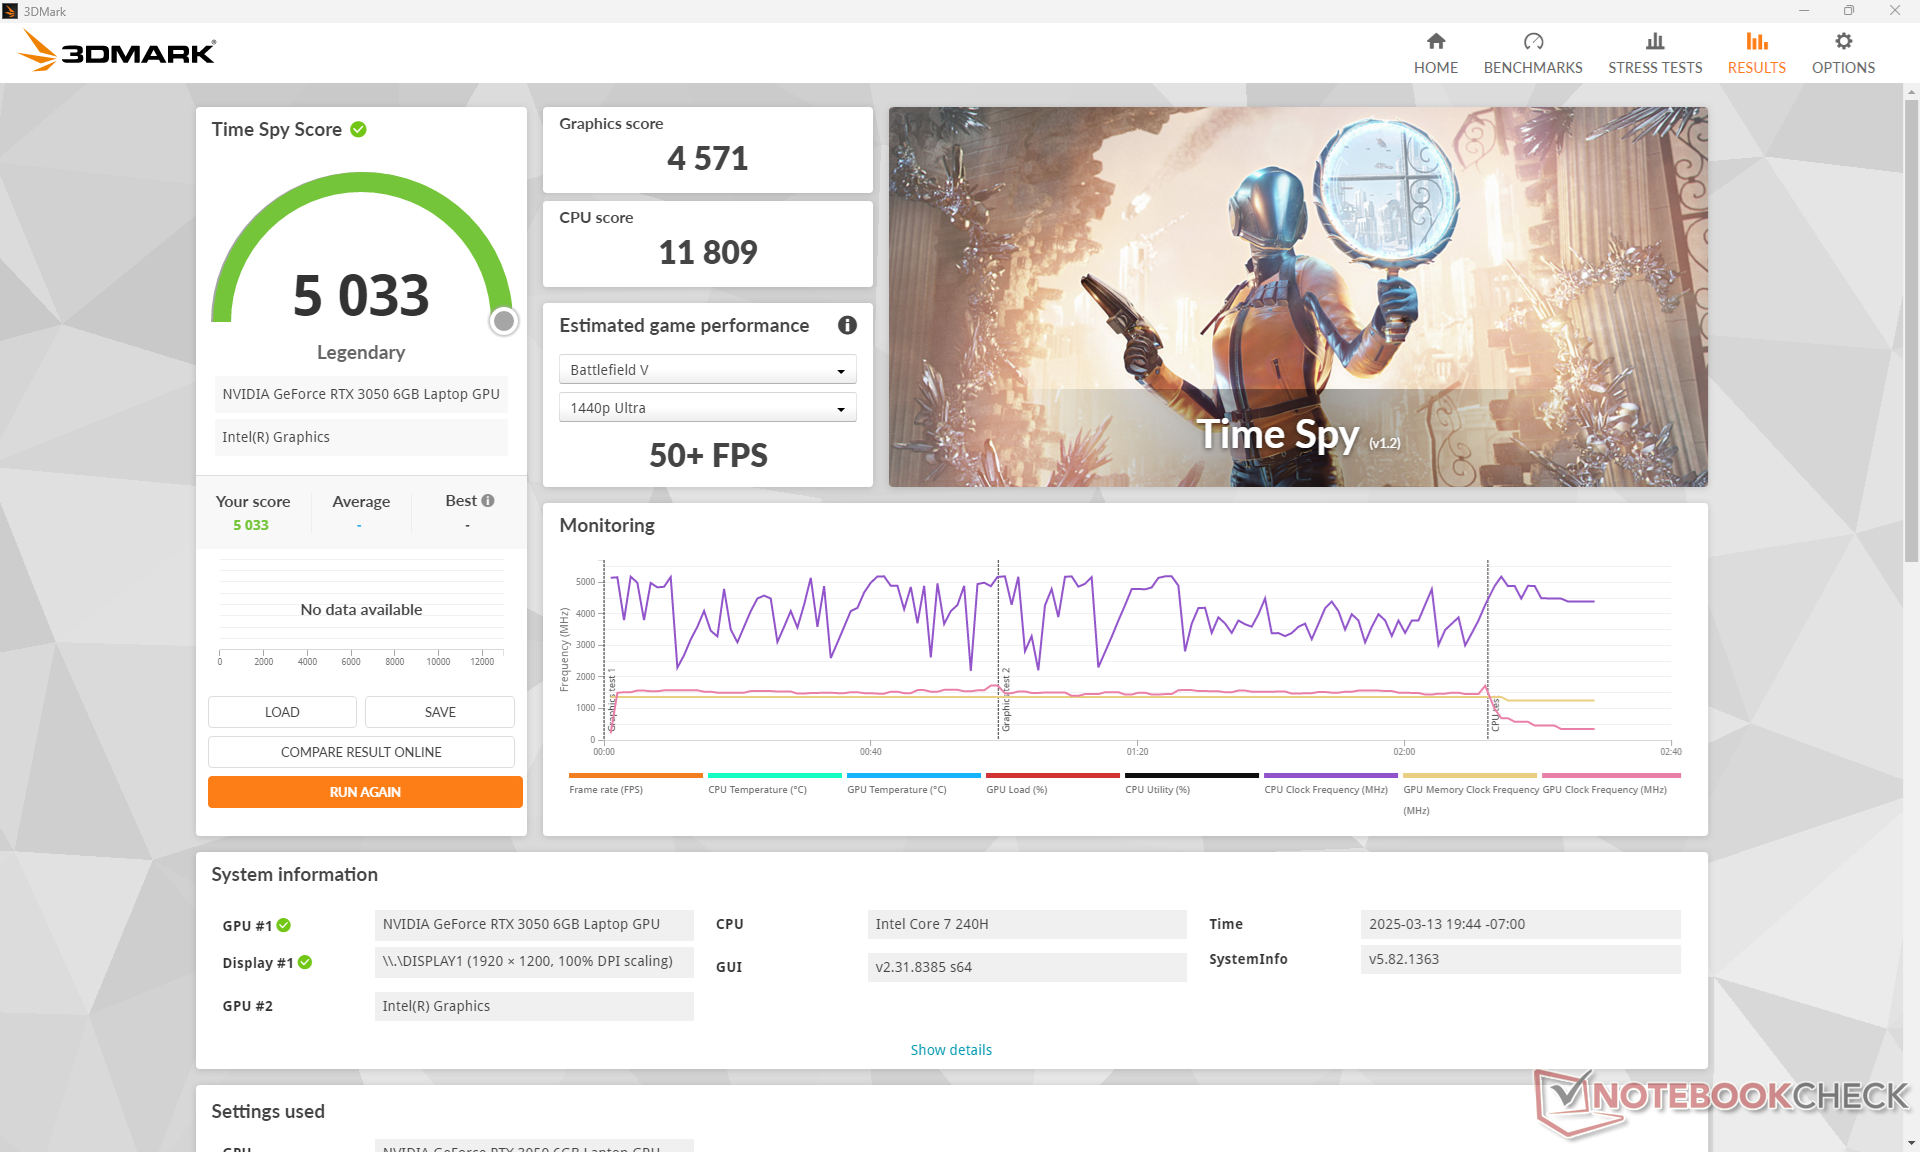
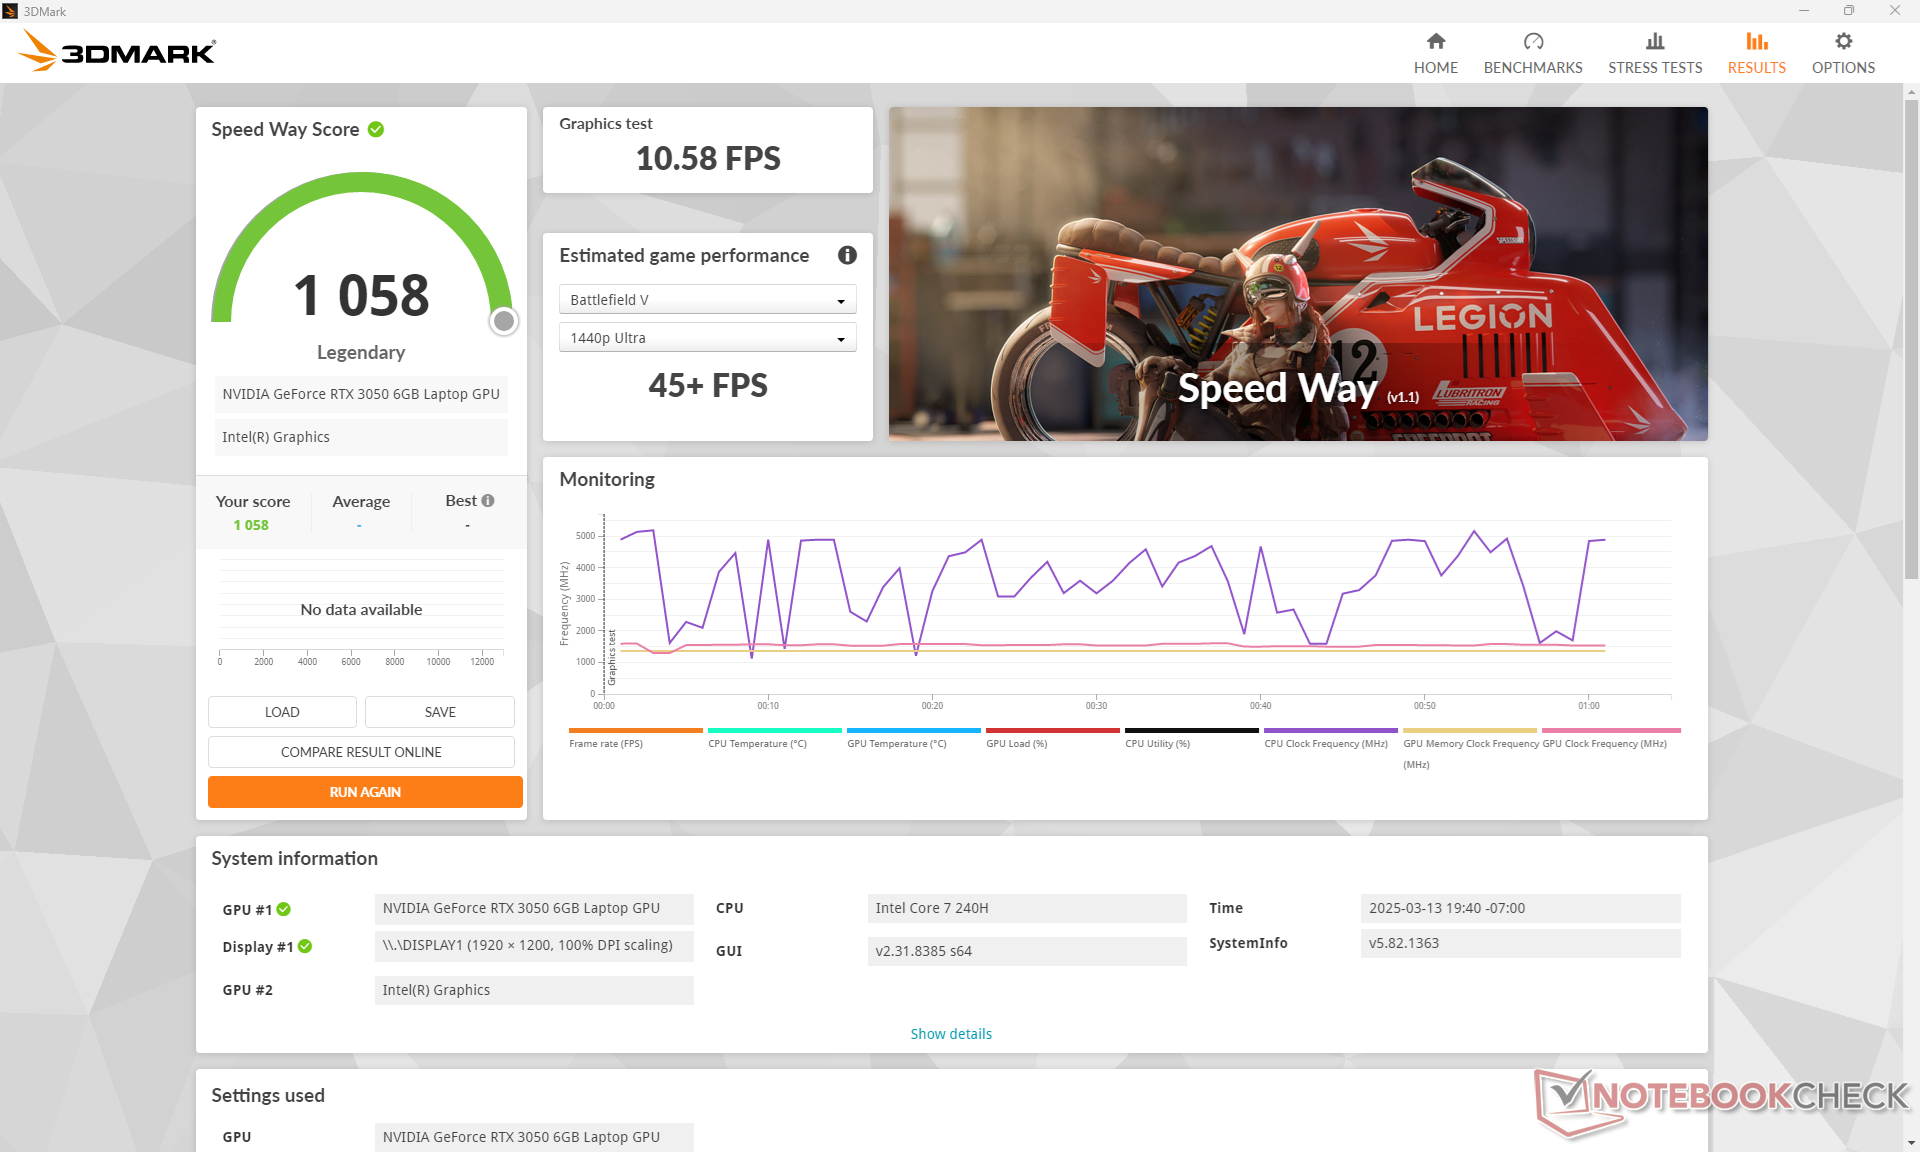
GPU teljesítmény
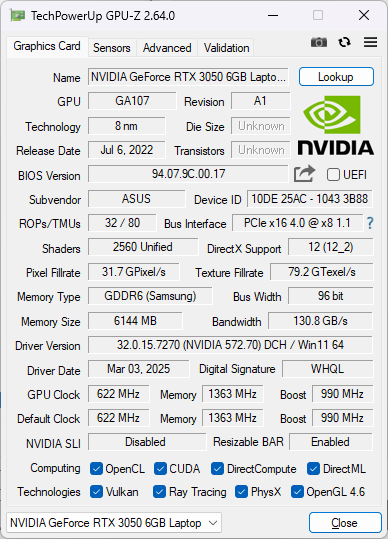
A GeForce RTX 3050 körülbelül 20-25 százalékkal gyorsabb, mint a RTX 2050 vagy 30-35 százalékkal lassabb, mint a RTX 4050. Megjegyzendő, hogy az Asus az RTX 3050 jobb, 6 GB-os változatát szállítja az RTX 3050 helyett 4 GB-os verzió helyett.
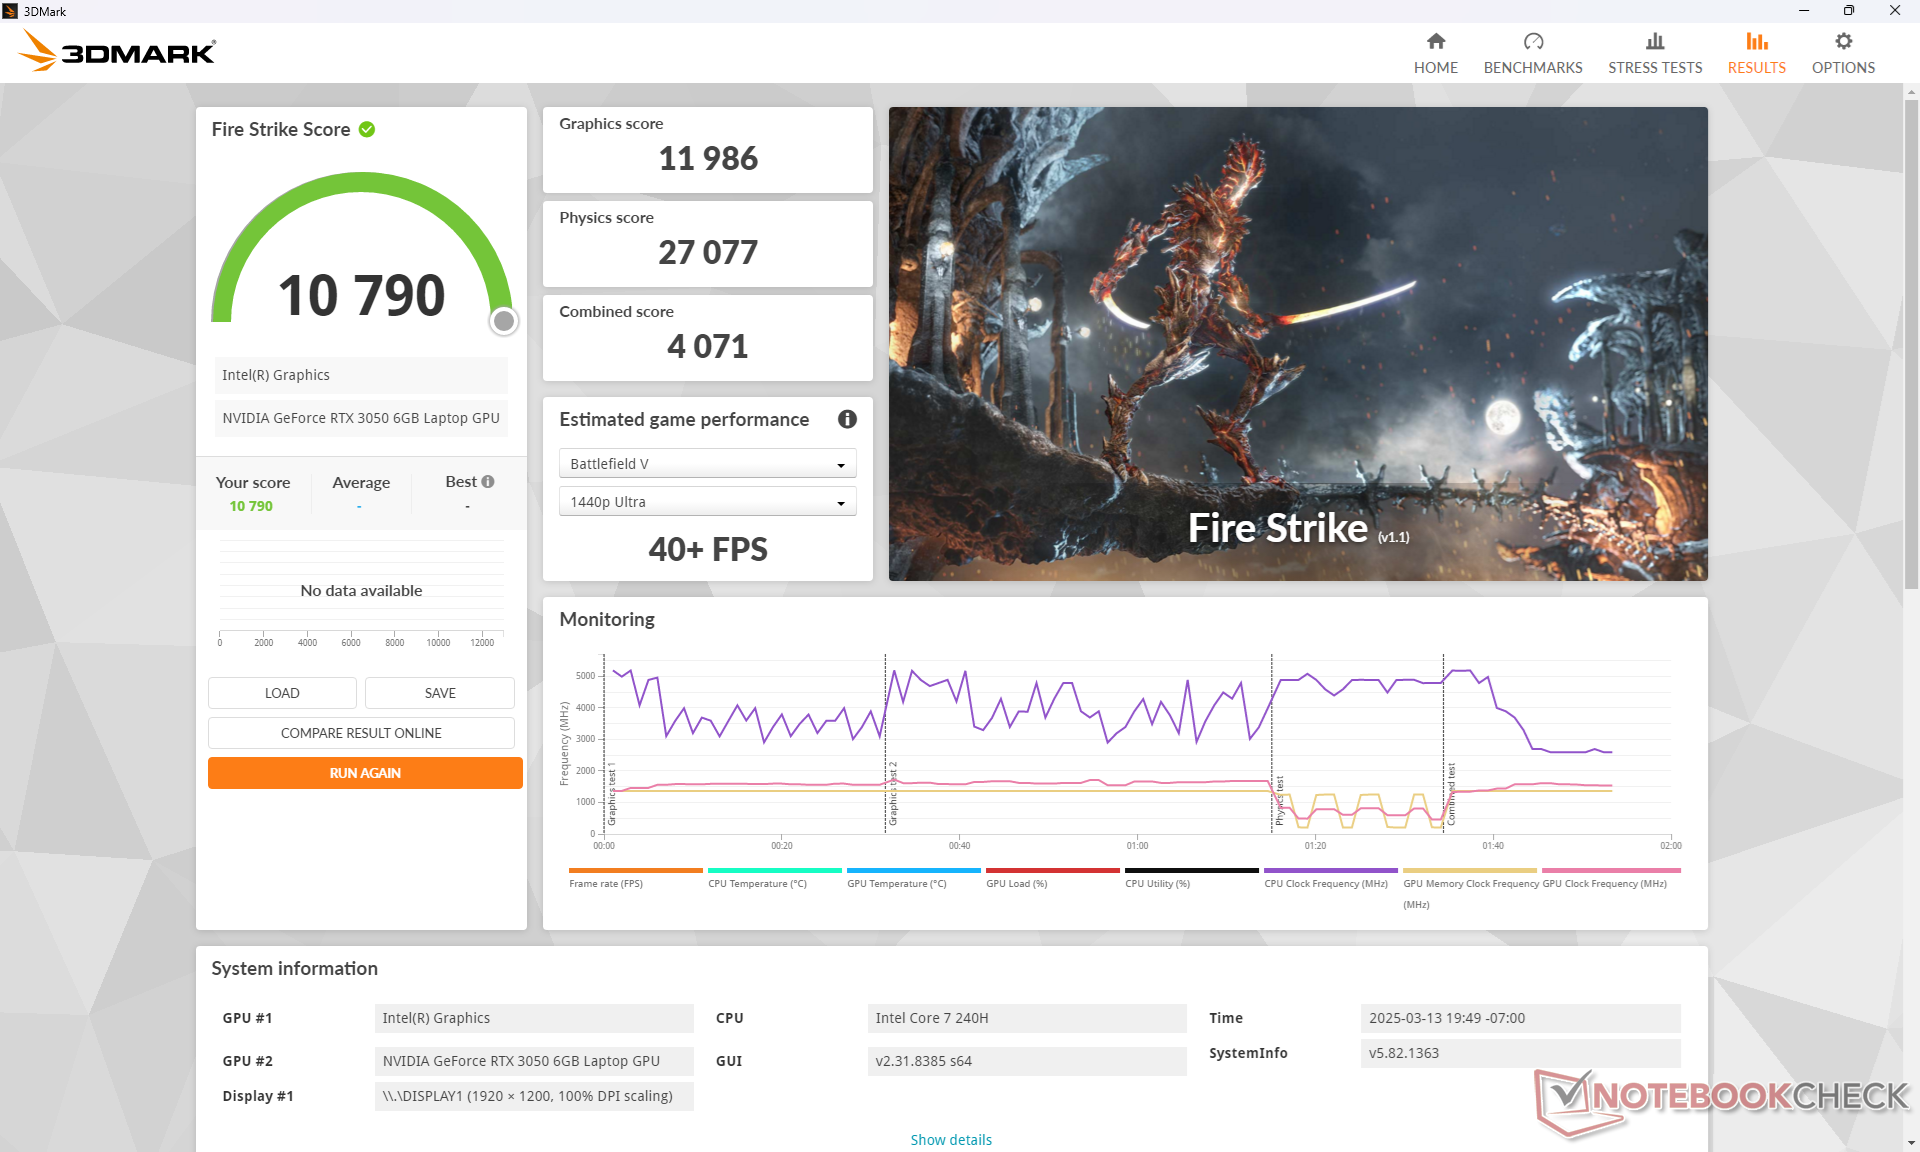
| Teljesítmény profil | Grafikus pontszám | Fizika pontszám | Kombinált pontszám |
| Teljesítmény mód | 11986 | 27077 | 4071 |
| Kiegyensúlyozott mód | 11317 (-6%) | 28246 (-0%) | 3842 (-6%) |
| Akkumulátor teljesítmény | 9900 (-17%) | 20557 (-24%) | 3573 (-12%) |
A Kiegyensúlyozott üzemmódban való futtatás kissé befolyásolja a grafikus teljesítményt, míg az akkumulátoros üzemmód még tovább csökkentené a teljesítményt, amint azt a fenti Fire Strike eredménytáblázatunk is mutatja.
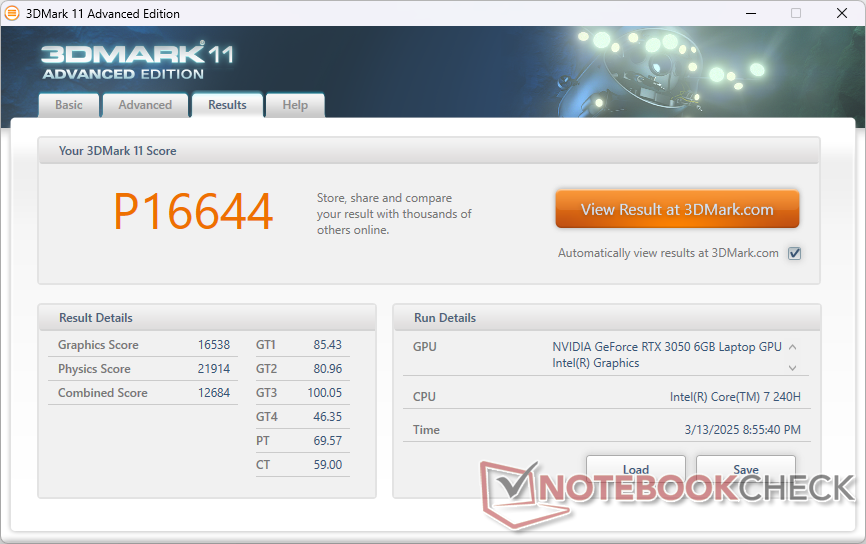
| 3DMark 11 Performance | 16644 pontok | |
| 3DMark Fire Strike Score | 10790 pontok | |
| 3DMark Time Spy Score | 5033 pontok | |
Segítség | ||
* ... a kisebb jobb
Játékteljesítmény
Lehet, hogy az RTX 3050 lassan kiöregszik, de még mindig elég erős ahhoz, hogy olyan igényes címeket futtasson, mint a Cyberpunk 2077 natív 1080p vagy 1200p felbontásban, a legtöbb beállítás High-on.
| F1 22 | |
| 1280x720 Ultra Low Preset AA:T AF:16x | |
| Lenovo ThinkPad Z16 Gen 2 | |
| Asus V16 V3607V | |
| Átlagos NVIDIA GeForce RTX 3050 6GB Laptop GPU (198 - 236, n=3) | |
| HP Spectre x360 16 RTX 4050 | |
| 1920x1080 Low Preset AA:T AF:16x | |
| HP Spectre x360 16 RTX 4050 | |
| Asus V16 V3607V | |
| Átlagos NVIDIA GeForce RTX 3050 6GB Laptop GPU (110.9 - 163.5, n=4) | |
| Lenovo ThinkPad Z16 Gen 2 | |
| 1920x1080 Medium Preset AA:T AF:16x | |
| HP Spectre x360 16 RTX 4050 | |
| Asus V16 V3607V | |
| Átlagos NVIDIA GeForce RTX 3050 6GB Laptop GPU (106.1 - 151.5, n=4) | |
| Lenovo ThinkPad Z16 Gen 2 | |
| 1920x1080 High Preset AA:T AF:16x | |
| HP Spectre x360 16 RTX 4050 | |
| Asus V16 V3607V | |
| Átlagos NVIDIA GeForce RTX 3050 6GB Laptop GPU (85.5 - 109.7, n=4) | |
| Lenovo ThinkPad Z16 Gen 2 | |
| 1920x1080 Ultra High Preset AA:T AF:16x | |
| HP Spectre x360 16 RTX 4050 | |
| Átlagos NVIDIA GeForce RTX 3050 6GB Laptop GPU (30.7 - 34, n=4) | |
| Asus V16 V3607V | |
| Lenovo ThinkPad Z16 Gen 2 | |
| Tiny Tina's Wonderlands | |
| 1280x720 Lowest Preset (DX12) | |
| Lenovo ThinkPad Z16 Gen 2 | |
| Asus V16 V3607V | |
| Átlagos NVIDIA GeForce RTX 3050 6GB Laptop GPU (n=1) | |
| 1920x1080 Low Preset (DX12) | |
| HP Spectre x360 16 RTX 4050 | |
| Lenovo ThinkPad Z16 Gen 2 | |
| Átlagos NVIDIA GeForce RTX 3050 6GB Laptop GPU (105.6 - 113.3, n=2) | |
| Asus V16 V3607V | |
| 1920x1080 Medium Preset (DX12) | |
| HP Spectre x360 16 RTX 4050 | |
| Lenovo ThinkPad Z16 Gen 2 | |
| Átlagos NVIDIA GeForce RTX 3050 6GB Laptop GPU (84.7 - 89.7, n=2) | |
| Asus V16 V3607V | |
| 1920x1080 High Preset (DX12) | |
| HP Spectre x360 16 RTX 4050 | |
| Lenovo ThinkPad Z16 Gen 2 | |
| Átlagos NVIDIA GeForce RTX 3050 6GB Laptop GPU (55.9 - 59.2, n=2) | |
| Asus V16 V3607V | |
| 1920x1080 Badass Preset (DX12) | |
| HP Spectre x360 16 RTX 4050 | |
| Átlagos NVIDIA GeForce RTX 3050 6GB Laptop GPU (44.3 - 46.4, n=2) | |
| Asus V16 V3607V | |
| Lenovo ThinkPad Z16 Gen 2 | |
Cyberpunk 2077 ultra FPS Chart
| alacsony | közepes | magas | ultra | |
|---|---|---|---|---|
| GTA V (2015) | 184.2 | 178.4 | 127.3 | 63.2 |
| Dota 2 Reborn (2015) | 181.4 | 161.2 | 146.8 | 135.1 |
| Final Fantasy XV Benchmark (2018) | 126.5 | 67.6 | 49.1 | |
| X-Plane 11.11 (2018) | 96.3 | 89.3 | 78.6 | |
| Far Cry 5 (2018) | 149 | 85 | 78 | 74 |
| Strange Brigade (2018) | 246 | 106.9 | 88.4 | 77 |
| Tiny Tina's Wonderlands (2022) | 105.6 | 84.7 | 55.9 | 44.3 |
| F1 22 (2022) | 149.9 | 138.9 | 102 | 31.6 |
| Baldur's Gate 3 (2023) | 59.7 | 50.3 | 45.4 | 44.3 |
| Cyberpunk 2077 (2023) | 66.7 | 51.4 | 42.7 | 36.1 |
Kibocsátás
Rendszerzaj
A ventilátor zaja alacsony terhelés mellett általában csendes, de sajnos elég gyorsan felerősödik, amikor nagyobb igénybevételre kerül sor, például alkalmazások indításakor. Kiegyensúlyozott üzemmódban a játék valamivel halkabb, mint teljesítmény üzemmódban (38,3 dB(A) vs. 40,5 dB(A)), a fent említett, kissé lassabb grafikus teljesítmény árán.
Zajszint
| Üresjárat |
| 23.5 / 23.7 / 23.7 dB(A) |
| Terhelés |
| 48 / 51 dB(A) |
 | ||
30 dB csendes 40 dB(A) hallható 50 dB(A) hangos |
||
min: | ||
| Asus V16 V3607V GeForce RTX 3050 6GB Laptop GPU, Core 7 240H, Samsung PM9C1 MZVL8512HELU | Asus VivoBook Pro 16 K6602VU GeForce RTX 4050 Laptop GPU, i9-13900H, Micron 2400 MTFDKBA1T0QFM | Dell Inspiron 16 Plus 7640 GeForce RTX 4060 Laptop GPU, Ultra 7 155H, SK hynix BC901 HFS001TEJ4X164N | Lenovo ThinkBook 16 G7 IML Graphics 4-Core iGPU (Arrow Lake), Ultra 5 125U, SK hynix HFS512GEJ4X112N | HP Pavilion Plus 16-ab0456tx GeForce RTX 3050 6GB Laptop GPU, i7-13700H, WDC PC SN810 1TB | Acer Swift Edge 16 SFE16-44-R0XV Radeon 760M, R5 8640U, Micron 3400 MTFDKBA512TFH 512GB | |
|---|---|---|---|---|---|---|
| Noise | -4% | 5% | 18% | 9% | -13% | |
| off / környezet * (dB) | 23.3 | 20.96 10% | 23.8 -2% | 23.1 1% | 22.22 5% | 25 -7% |
| Idle Minimum * (dB) | 23.5 | 25.28 -8% | 24.2 -3% | 23.1 2% | 22.22 5% | 26 -11% |
| Idle Average * (dB) | 23.7 | 25.28 -7% | 24.2 -2% | 23.1 3% | 22.22 6% | 29 -22% |
| Idle Maximum * (dB) | 23.7 | 25.28 -7% | 24.2 -2% | 23.1 3% | 22.22 6% | 39 -65% |
| Load Average * (dB) | 48 | 51.88 -8% | 28.9 40% | 23.2 52% | 42.03 12% | 45 6% |
| Cyberpunk 2077 ultra * (dB) | 40.5 | 29.2 28% | 43 -6% | |||
| Load Maximum * (dB) | 51 | 51.8 -2% | 51 -0% | 32.6 36% | 42.1 17% | 45 12% |
| Witcher 3 ultra * (dB) | 49 | 51 | 42.1 |
* ... a kisebb jobb
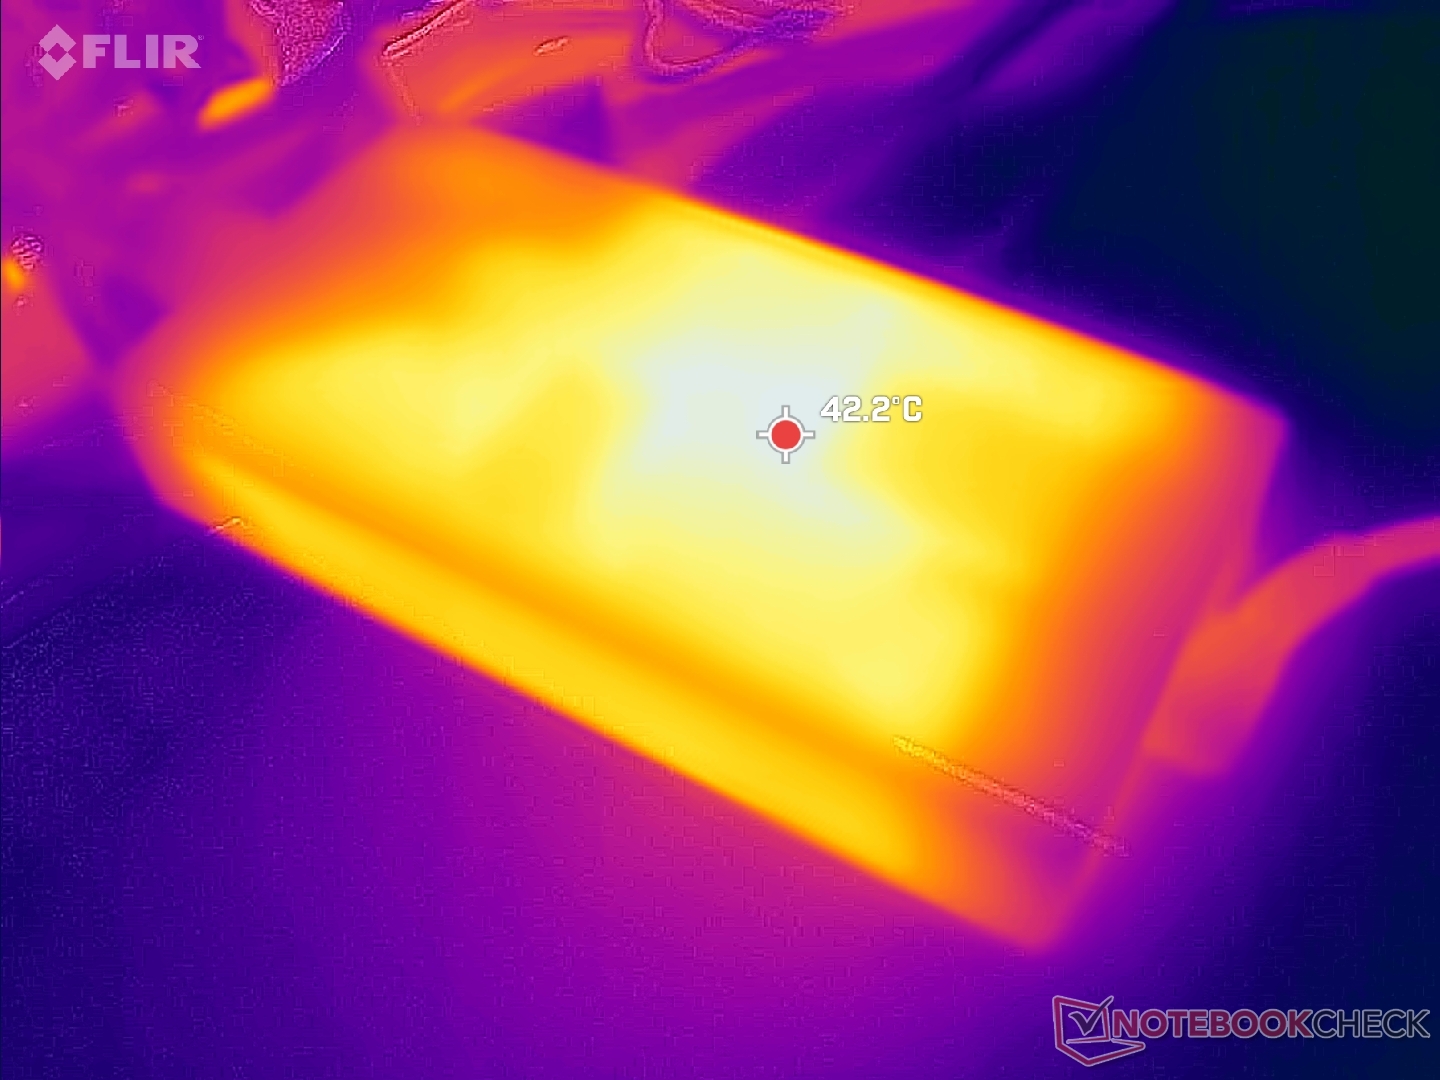
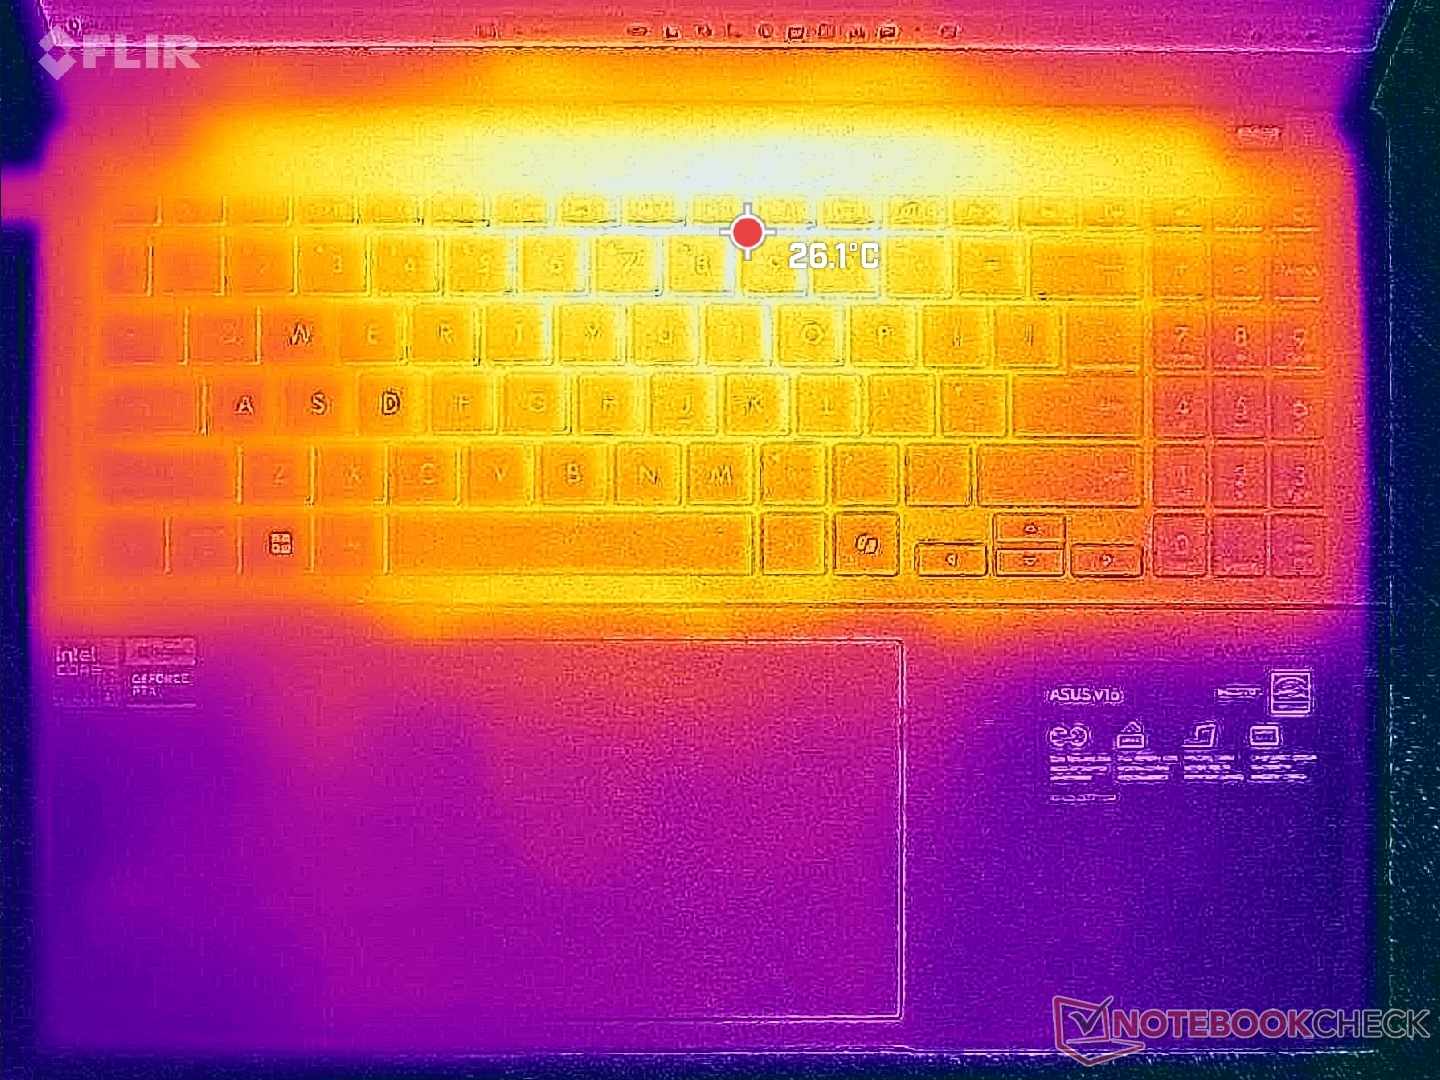
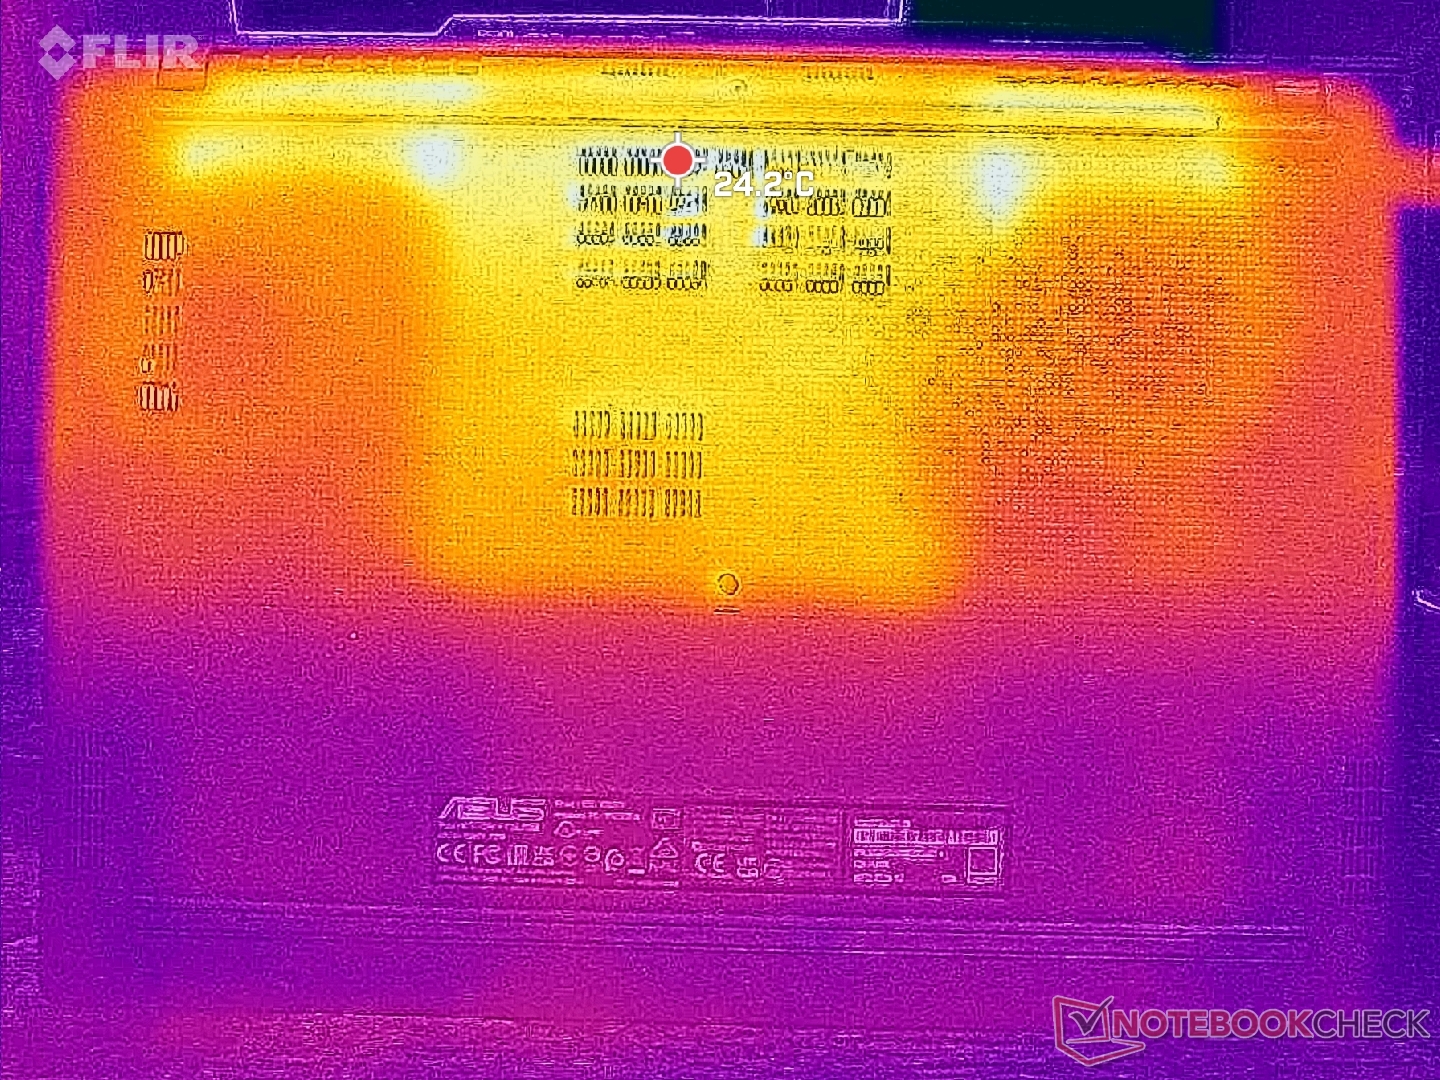
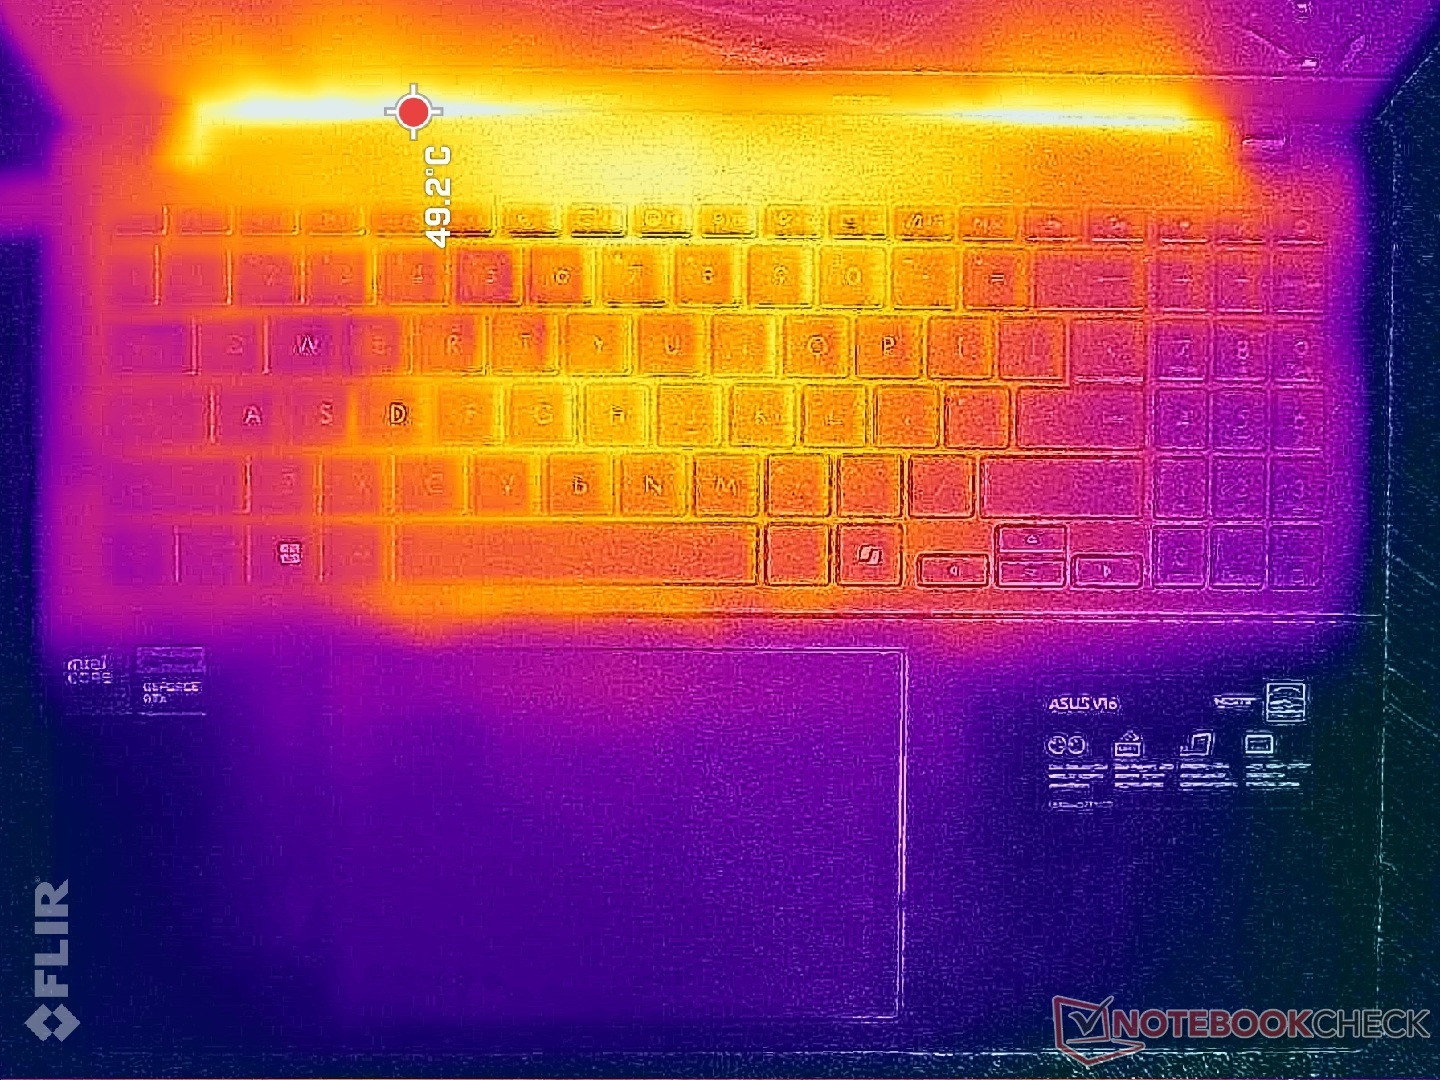
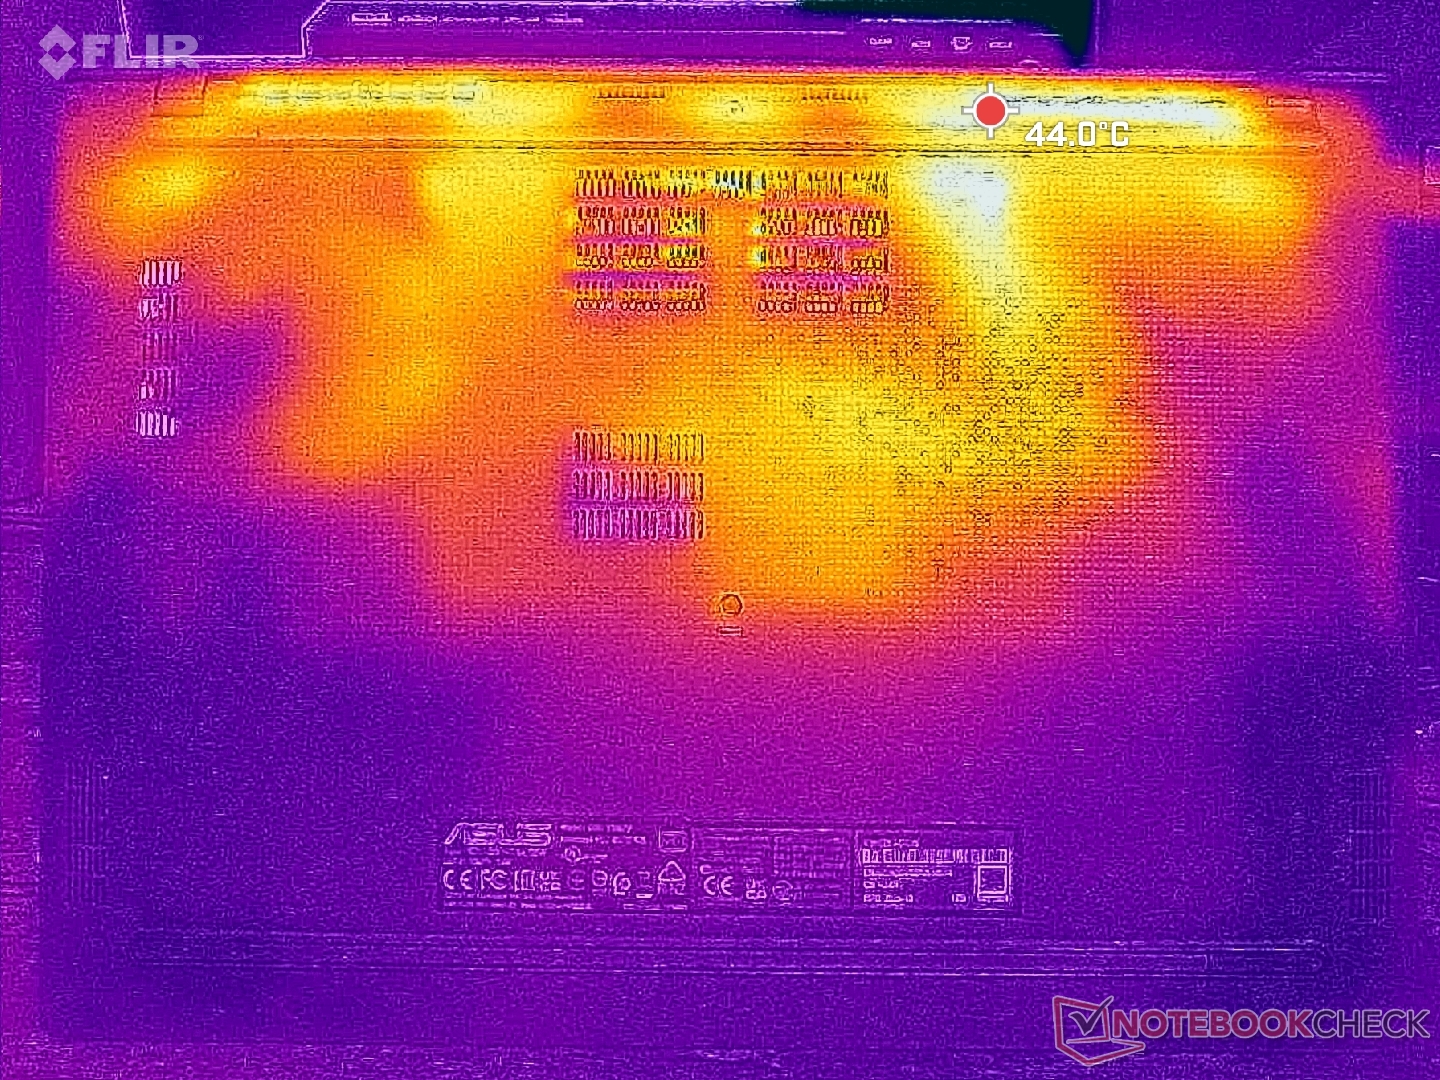
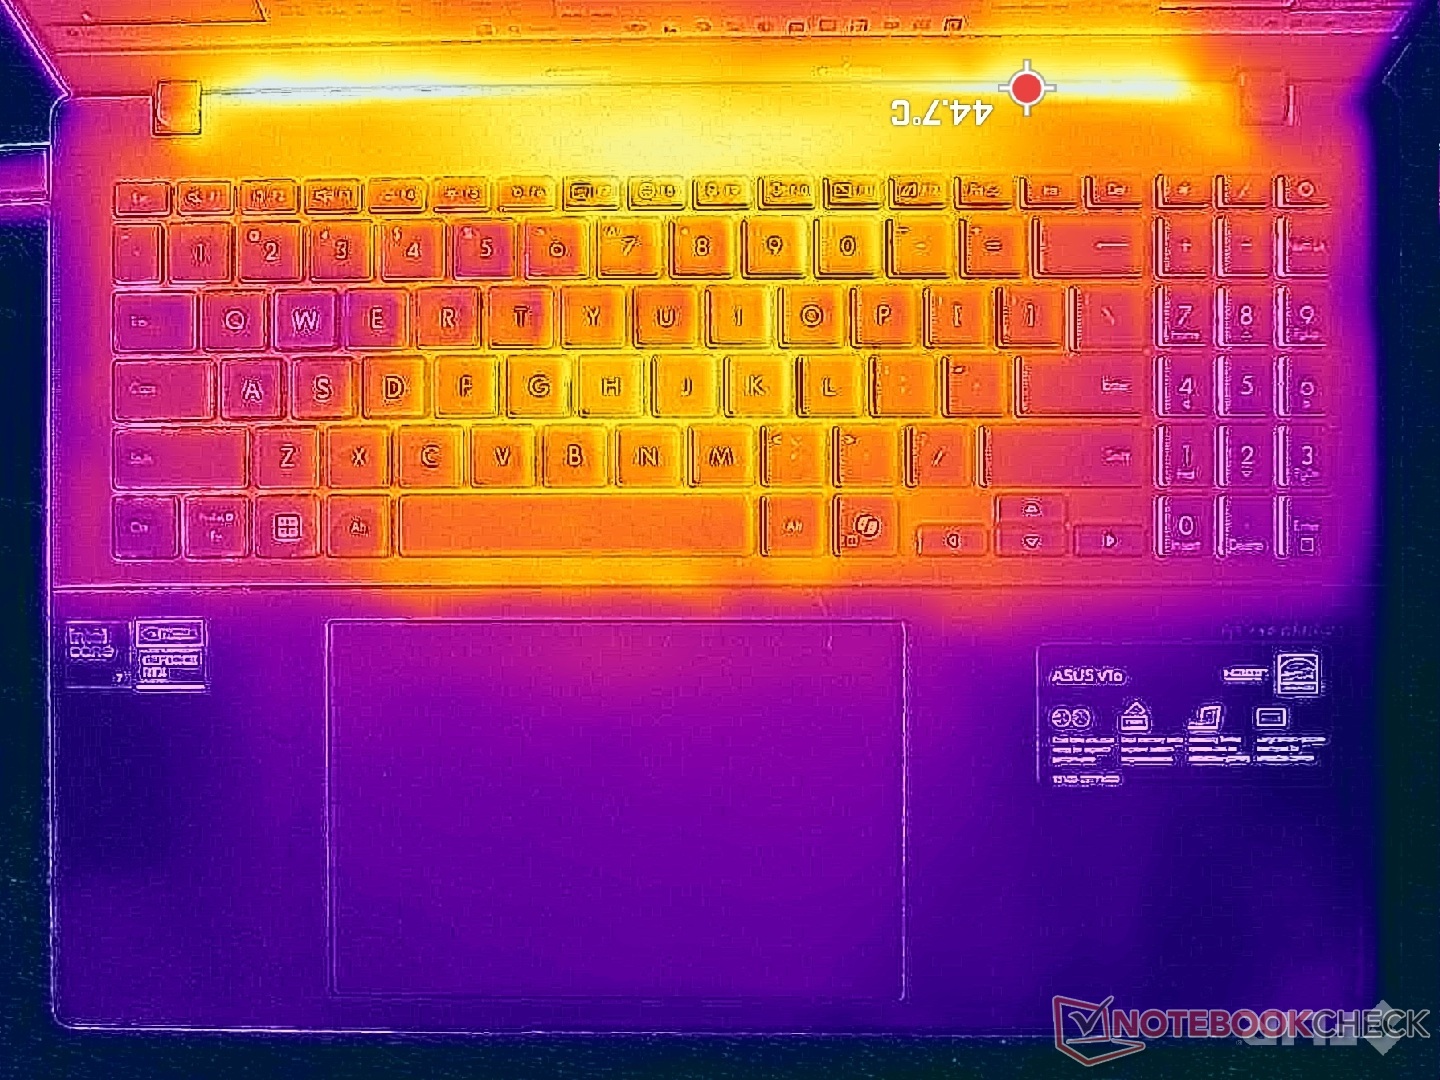
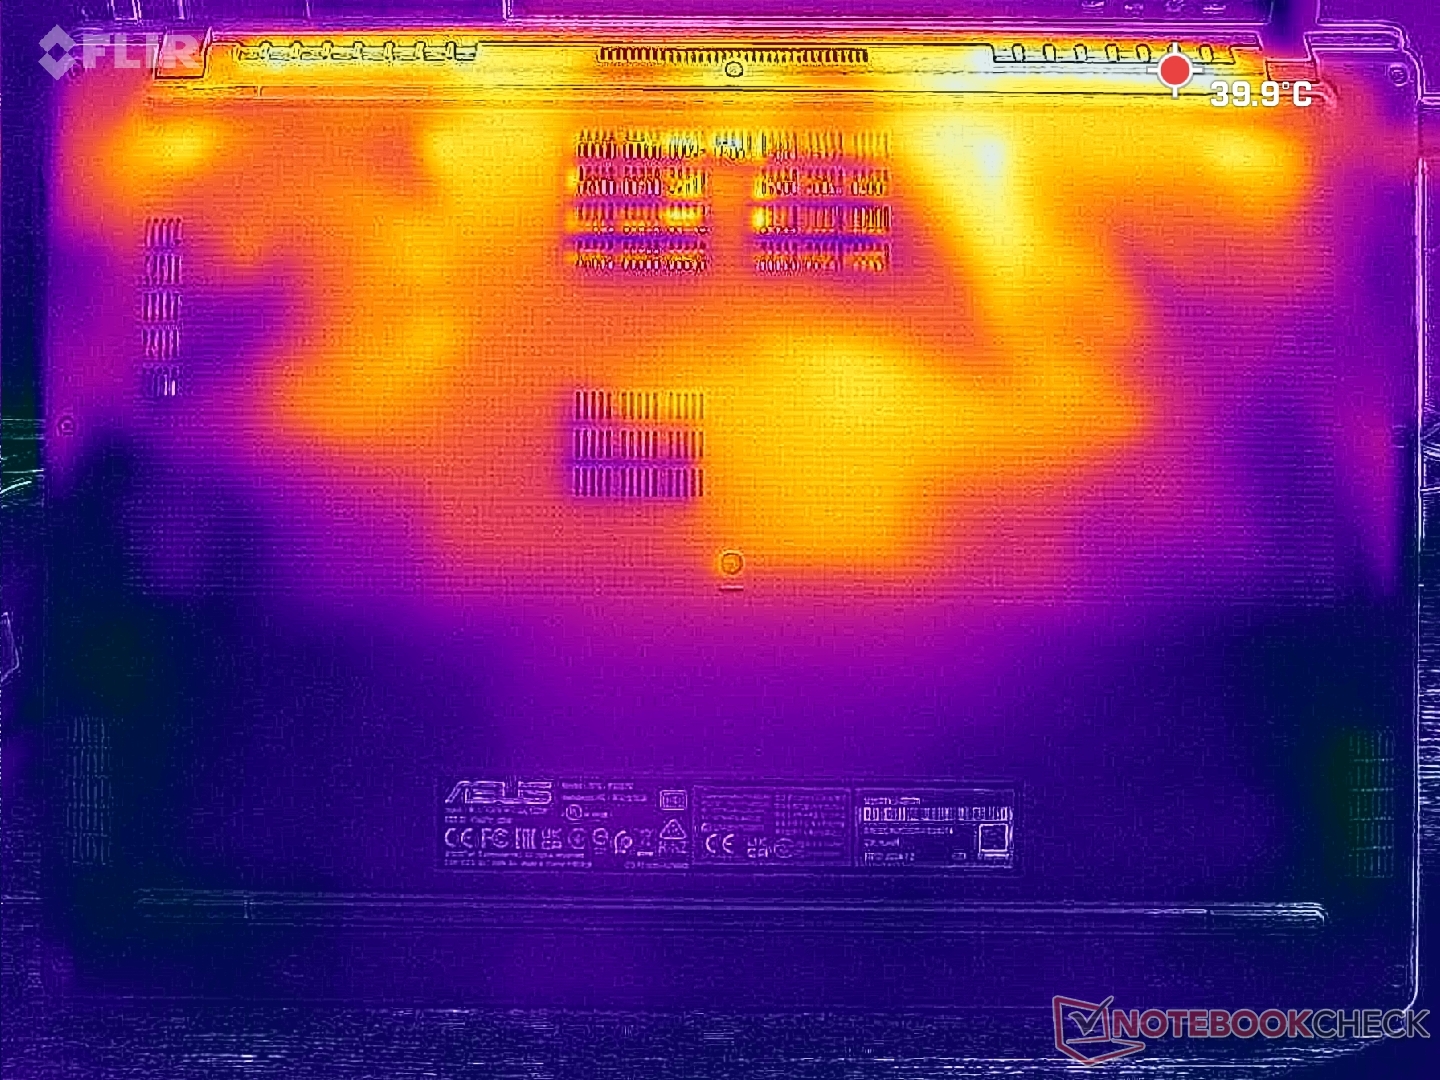
Hőmérséklet
A forró pontok a hátsó részen vannak, ahol a hőmérséklet elérheti a 40 C-ot is, amint azt az alábbi hőmérsékleti térképek is mutatják. A tenyértámasz, a numpad és a WASD billentyűk hűvösebbek maradnának gépelési vagy játék célokra.
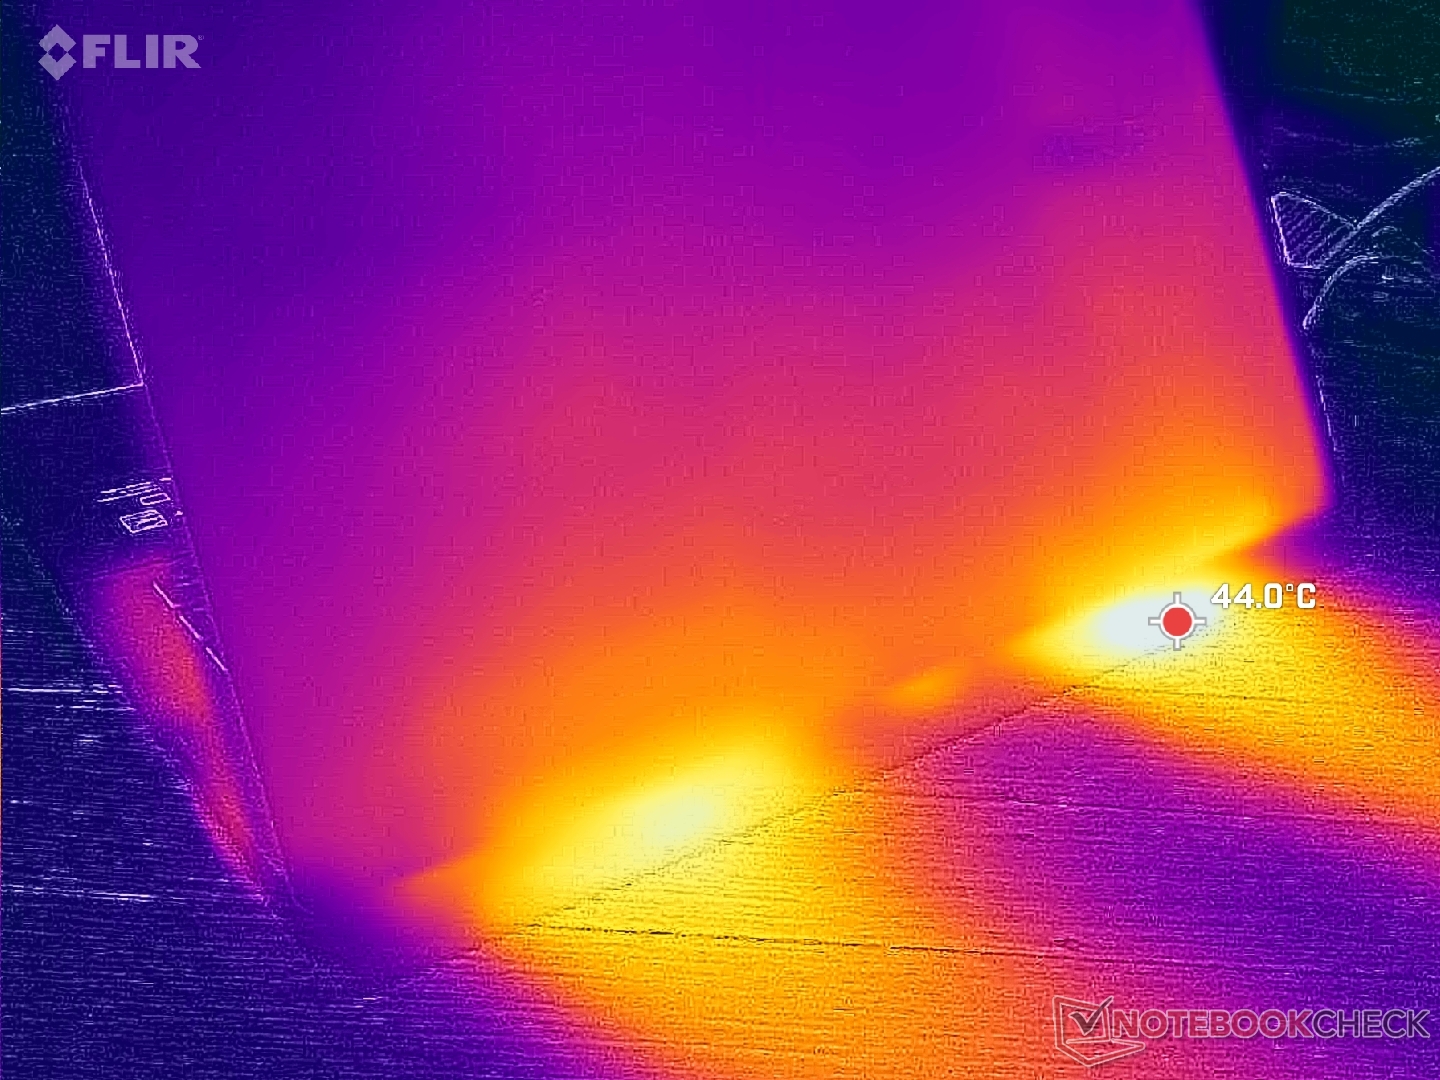
(±) A felső oldalon a maximális hőmérséklet 41.2 °C / 106 F, összehasonlítva a 36.9 °C / 98 F átlagával , 21 és 71 °C között a Multimedia osztálynál.
(+) Az alsó maximum 34.4 °C / 94 F-ig melegszik fel, összehasonlítva a 39.1 °C / 102 F átlagával
(+) Üresjáratban a felső oldal átlagos hőmérséklete 24.6 °C / 76 F, összehasonlítva a 31.3 °C / ### eszközátlaggal class_avg_f### F.
(+) 3: The average temperature for the upper side is 31.2 °C / 88 F, compared to the average of 31.3 °C / 88 F for the class Multimedia.
(+) A csuklótámasz és az érintőpad hűvösebb, mint a bőr hőmérséklete, maximum 21.8 °C / 71.2 F, ezért hűvös tapintású.
(+) A hasonló eszközök csuklótámasz területének átlagos hőmérséklete 28.7 °C / 83.7 F volt (+6.9 °C / 12.5 F).
| Asus V16 V3607V Intel Core 7 240H, NVIDIA GeForce RTX 3050 6GB Laptop GPU | Asus VivoBook Pro 16 K6602VU Intel Core i9-13900H, NVIDIA GeForce RTX 4050 Laptop GPU | Dell Inspiron 16 Plus 7640 Intel Core Ultra 7 155H, NVIDIA GeForce RTX 4060 Laptop GPU | Lenovo ThinkBook 16 G7 IML Intel Core Ultra 5 125U, Intel Graphics 4-Core iGPU (Meteor / Arrow Lake) | HP Pavilion Plus 16-ab0456tx Intel Core i7-13700H, NVIDIA GeForce RTX 3050 6GB Laptop GPU | Acer Swift Edge 16 SFE16-44-R0XV AMD Ryzen 5 8640U, AMD Radeon 760M | |
|---|---|---|---|---|---|---|
| Heat | -30% | -13% | 7% | -28% | -24% | |
| Maximum Upper Side * (°C) | 41.2 | 42.6 -3% | 43.4 -5% | 33.2 19% | 49.6 -20% | 48 -17% |
| Maximum Bottom * (°C) | 34.4 | 48.4 -41% | 41.6 -21% | 41.2 -20% | 45.8 -33% | 60 -74% |
| Idle Upper Side * (°C) | 28.8 | 39.4 -37% | 32.8 -14% | 23.4 19% | 39.2 -36% | 28 3% |
| Idle Bottom * (°C) | 29 | 39.8 -37% | 32.4 -12% | 26.6 8% | 35.4 -22% | 31 -7% |
* ... a kisebb jobb
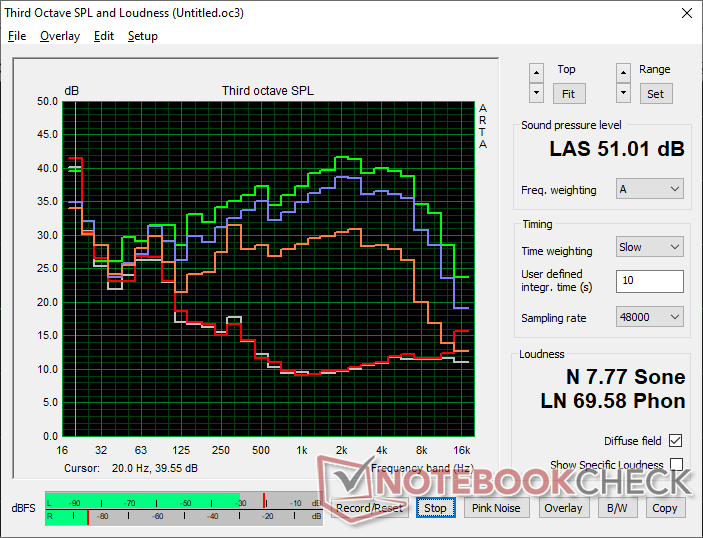
Hangszórók
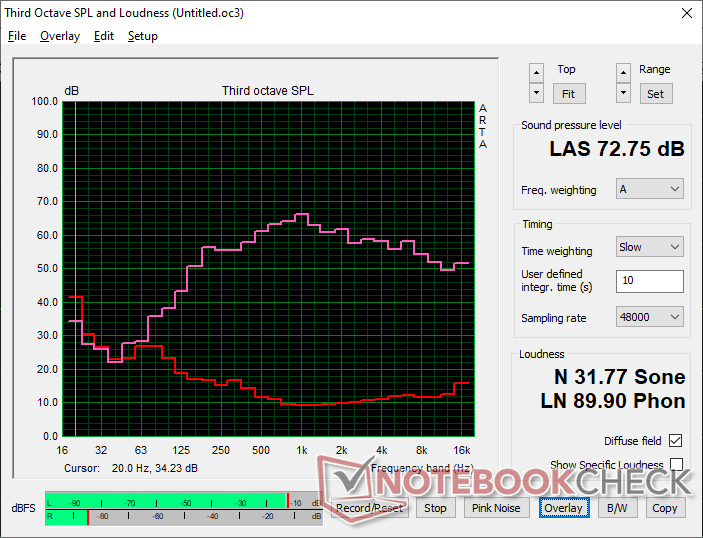
Asus V16 V3607V hangelemzés
(±) | a hangszóró hangereje átlagos, de jó (72.8 dB)
Basszus 100 - 315 Hz
(±) | csökkentett basszus – átlagosan 7.7%-kal alacsonyabb, mint a medián
(±) | a basszus linearitása átlagos (7.8% delta az előző frekvenciához)
Közepes 400-2000 Hz
(+) | kiegyensúlyozott középpontok – csak 4.7% választja el a mediántól
(+) | a középpontok lineárisak (4.8% delta az előző frekvenciához)
Maximum 2-16 kHz
(+) | kiegyensúlyozott csúcsok – csak 1.9% választja el a mediántól
(+) | a csúcsok lineárisak (5.3% delta az előző frekvenciához képest)
Összességében 100 - 16.000 Hz
(+) | általános hangzás lineáris (13.2% eltérés a mediánhoz képest)
Ugyanazon osztályhoz képest
» 26%Ebben az osztályban az összes tesztelt eszköz %-a jobb volt, 5% hasonló, 69%-kal rosszabb
» A legjobb delta értéke 5%, az átlag 17%, a legrosszabb 45% volt
Az összes tesztelt eszközzel összehasonlítva
» 13% az összes tesztelt eszköz jobb volt, 3% hasonló, 84%-kal rosszabb
» A legjobb delta értéke 4%, az átlag 24%, a legrosszabb 134% volt
Apple MacBook Pro 16 2021 M1 Pro hangelemzés
(+) | a hangszórók viszonylag hangosan tudnak játszani (84.7 dB)
Basszus 100 - 315 Hz
(+) | jó basszus – csak 3.8% választja el a mediántól
(+) | a basszus lineáris (5.2% delta az előző frekvenciához)
Közepes 400-2000 Hz
(+) | kiegyensúlyozott középpontok – csak 1.3% választja el a mediántól
(+) | a középpontok lineárisak (2.1% delta az előző frekvenciához)
Maximum 2-16 kHz
(+) | kiegyensúlyozott csúcsok – csak 1.9% választja el a mediántól
(+) | a csúcsok lineárisak (2.7% delta az előző frekvenciához képest)
Összességében 100 - 16.000 Hz
(+) | általános hangzás lineáris (4.6% eltérés a mediánhoz képest)
Ugyanazon osztályhoz képest
» 0%Ebben az osztályban az összes tesztelt eszköz %-a jobb volt, 0% hasonló, 100%-kal rosszabb
» A legjobb delta értéke 5%, az átlag 17%, a legrosszabb 45% volt
Az összes tesztelt eszközzel összehasonlítva
» 0% az összes tesztelt eszköz jobb volt, 0% hasonló, 100%-kal rosszabb
» A legjobb delta értéke 4%, az átlag 24%, a legrosszabb 134% volt
Energiagazdálkodás
Energiafogyasztás
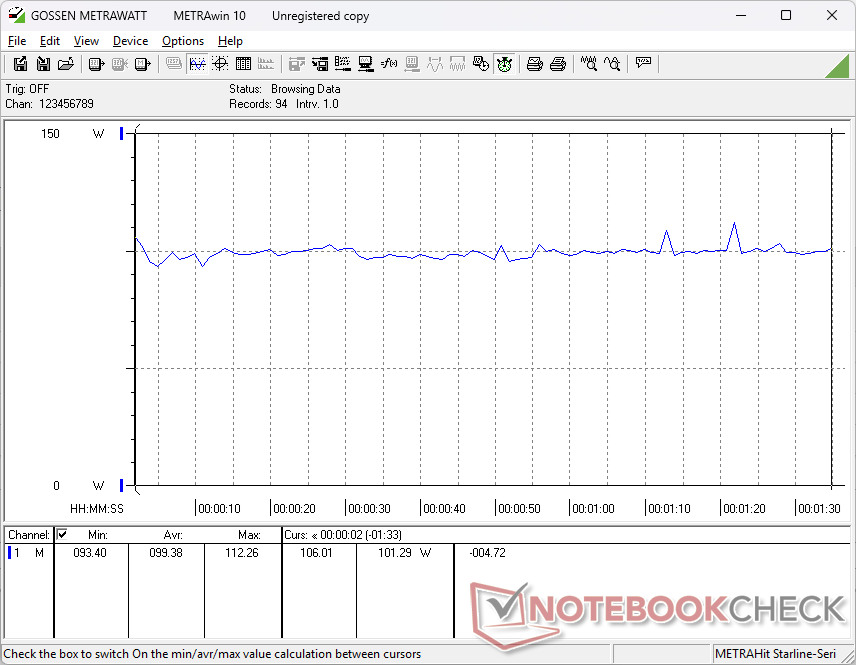
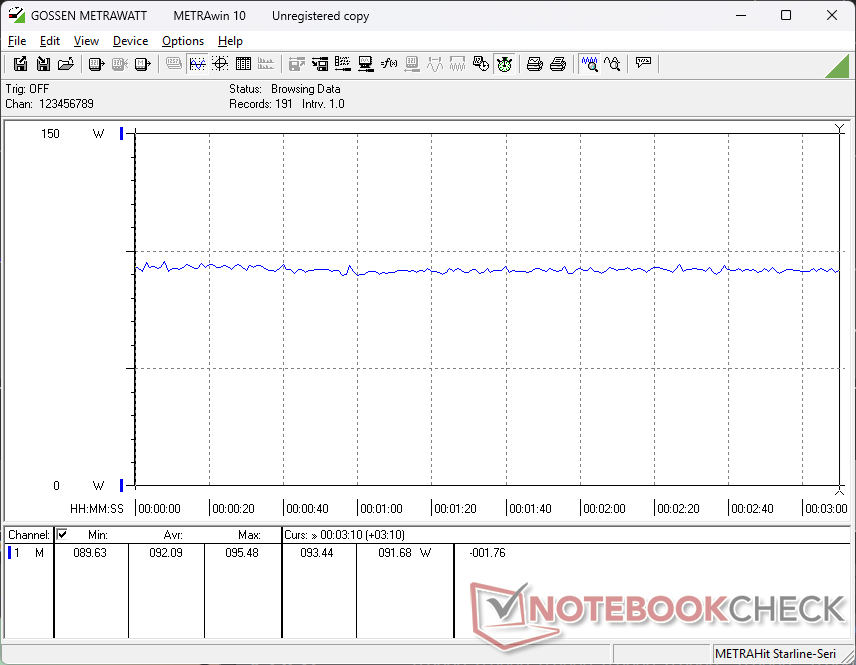
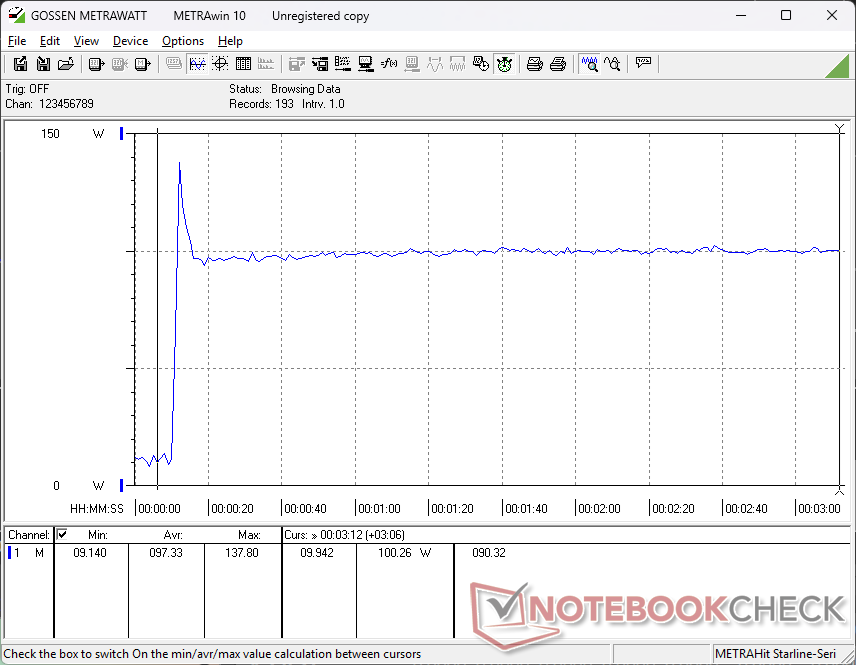
Az üresjárat mindössze 2 W-tól a dGPU kikapcsolt állapotában, illetve 11 W-ig terjedhet a dGPU bekapcsolt állapotában és maximális fényerőn. A fogyasztás a Prime95 stressz futtatásakor a fent említett teljesítményt korlátozó viselkedés miatt vadul ingadozik.
| Kikapcsolt állapot / Készenlét | |
| Üresjárat | |
| Terhelés |
|
Kulcs:
min: | |
| Asus V16 V3607V Core 7 240H, GeForce RTX 3050 6GB Laptop GPU, Samsung PM9C1 MZVL8512HELU, IPS, 1920x1200, 16" | Asus VivoBook Pro 16 K6602VU i9-13900H, GeForce RTX 4050 Laptop GPU, Micron 2400 MTFDKBA1T0QFM, OLED, 3200x2000, 16" | Dell Inspiron 16 Plus 7640 Ultra 7 155H, GeForce RTX 4060 Laptop GPU, SK hynix BC901 HFS001TEJ4X164N, IPS, 2560x1600, 16" | Lenovo ThinkBook 16 G7 IML Ultra 5 125U, Graphics 4-Core iGPU (Arrow Lake), SK hynix HFS512GEJ4X112N, IPS, 1920x1200, 16" | HP Pavilion Plus 16-ab0456tx i7-13700H, GeForce RTX 3050 6GB Laptop GPU, WDC PC SN810 1TB, IPS, 2560x1600, 16" | Acer Swift Edge 16 SFE16-44-R0XV R5 8640U, Radeon 760M, Micron 3400 MTFDKBA512TFH 512GB, OLED, 3200x2000, 16" | |
|---|---|---|---|---|---|---|
| Power Consumption | -247% | -22% | 18% | -13% | -19% | |
| Idle Minimum * (Watt) | 2.1 | 21.06 -903% | 4.2 -100% | 4.3 -105% | 3.3 -57% | 8 -281% |
| Idle Average * (Watt) | 7.2 | 24.27 -237% | 6.9 4% | 8.9 -24% | 7.3 -1% | 10 -39% |
| Idle Maximum * (Watt) | 10.7 | 25.12 -135% | 15.2 -42% | 9.1 15% | 14.24 -33% | 15 -40% |
| Load Average * (Watt) | 99.4 | 52.4 47% | 70.4 29% | 31.7 68% | 91.7 8% | 42 58% |
| Cyberpunk 2077 ultra external monitor * (Watt) | 88.7 | 35.2 60% | 42.8 52% | |||
| Cyberpunk 2077 ultra * (Watt) | 92.1 | 39.4 57% | 44.4 52% | |||
| Load Maximum * (Watt) | 137.8 | 146 -6% | 137.4 -0% | 66.7 52% | 115.8 16% | 49 64% |
| Witcher 3 ultra * (Watt) | 110.2 | 115.9 | 96.2 |
* ... a kisebb jobb
Power Consumption Cyberpunk / Stress Test
Power Consumption external Monitor
Az akkumulátor élettartama
A WLAN-üzemidő a 63 Wh-s átlagos méretű akkumulátor ellenére is tiszteletreméltó, közel 9 óra valós böngészést tesz lehetővé. A tesztet a dGPU inaktív és Eco/Balanced üzemmódban végeztük.
| Asus V16 V3607V Core 7 240H, GeForce RTX 3050 6GB Laptop GPU, 63 Wh | Asus VivoBook Pro 16 K6602VU i9-13900H, GeForce RTX 4050 Laptop GPU, 96 Wh | Dell Inspiron 16 Plus 7640 Ultra 7 155H, GeForce RTX 4060 Laptop GPU, 90 Wh | Lenovo ThinkBook 16 G7 IML Ultra 5 125U, Graphics 4-Core iGPU (Arrow Lake), 45 Wh | HP Pavilion Plus 16-ab0456tx i7-13700H, GeForce RTX 3050 6GB Laptop GPU, 68 Wh | Acer Swift Edge 16 SFE16-44-R0XV R5 8640U, Radeon 760M, 54 Wh | |
|---|---|---|---|---|---|---|
| Akkumulátor üzemidő | 12% | 48% | -2% | 16% | -47% | |
| WiFi v1.3 (h) | 9 | 10.1 12% | 13.3 48% | 8.8 -2% | 10.4 16% | 4.8 -47% |
| H.264 (h) | 9.8 | 12 | ||||
| Reader / Idle (h) | 19.2 | |||||
| Load (h) | 1.3 |
Notebookcheck Értékelés
Asus V16 V3607V
- 03/19/2025 v8
Allen Ngo
 Total Sustainability Score:
 Potential Competitors in Comparison
Kép | Modell / Review | Legjobb ár | Súly | Magasság | Kijelző |
|---|---|---|---|---|---|
1. 78.5%  | Asus V16 V3607V Intel Core 7 240H ⎘ NVIDIA GeForce RTX 3050 6GB Laptop GPU ⎘ 16 GB Memória, 512 GB SSD | List Price: 900 USD | 2 kg | 22 mm | 16.00" 1920x1200 142 PPI IPS |
2. 87.6% v7 (old)  | Asus VivoBook Pro 16 K6602VU Intel Core i9-13900H ⎘ NVIDIA GeForce RTX 4050 Laptop GPU ⎘ 16 GB Memória, 1024 GB SSD | List Price: 2199 EUR | 1.9 kg | 19 mm | 16.00" 3200x2000 236 PPI OLED |
3. 83.4%  | Dell Inspiron 16 Plus 7640 Intel Core Ultra 7 155H ⎘ NVIDIA GeForce RTX 4060 Laptop GPU ⎘ 16 GB Memória, 1024 GB SSD | List Price: 1300 USD | 2.2 kg | 19.9 mm | 16.00" 2560x1600 189 PPI IPS |
4. 83%  | Lenovo ThinkBook 16 G7 IML Intel Core Ultra 5 125U ⎘ Intel Graphics 4-Core iGPU (Meteor / Arrow Lake) ⎘ 16 GB Memória, 512 GB SSD | List Price: 750 USD | 1.8 kg | 17.5 mm | 16.00" 1920x1200 142 PPI IPS |
5. 88.7% v7 (old)  | HP Pavilion Plus 16-ab0456tx Intel Core i7-13700H ⎘ NVIDIA GeForce RTX 3050 6GB Laptop GPU ⎘ 16 GB Memória, 1024 GB SSD | List Price: 1350 USD | 1.9 kg | 19.9 mm | 16.00" 2560x1600 189 PPI IPS |
6. 81.3%  | Acer Swift Edge 16 SFE16-44-R0XV AMD Ryzen 5 8640U ⎘ AMD Radeon 760M ⎘ 16 GB Memória, 512 GB SSD | List Price: 1000 EUR | 1.2 kg | 13 mm | 16.00" 3200x2000 236 PPI OLED |
Átláthatóság
A felülvizsgálandó készülékek kiválasztását szerkesztőségünk végzi. A tesztmintát a gyártó vagy a kiskereskedő kölcsönként bocsátotta a szerző rendelkezésére a felülvizsgálat céljából. A hitelezőnek nem volt befolyása erre a felülvizsgálatra, és a gyártó sem kapott másolatot erről a felülvizsgálatról a közzététel előtt. Nem volt kötelesség ezt az ismertetőt közzétenni. Független médiavállalatként a Notebookcheck nincs alávetve a gyártók, kiskereskedők vagy kiadók felhatalmazásának.
Így tesztel a Notebookcheck
A Notebookcheck minden évben független, laptopok és okostelefonok százait vizsgálja meg szabványosított eljárások alkalmazásával annak érdekében, hogy minden eredmény összehasonlítható legyen. Körülbelül 20 éve folyamatosan fejlesztjük vizsgálati módszereinket, és ennek során iparági szabványokat állítottunk fel. Tesztlaboratóriumainkban kiváló minőségű mérőberendezéseket használnak tapasztalt technikusok és szerkesztők. Ezek a tesztek többlépcsős validációs folyamatot foglalnak magukban. Komplex minősítési rendszerünk több száz megalapozott mérésen és benchmarkon alapul, ami megőrzi az objektivitást.
