Nvidia RTX 3500 Ada teljesítmény debütálása: HP ZBook Fury 16 G11 munkaállomás felülvizsgálata
A 2024 ZBook Fury 16 G11 a ZBook Fury 16 G11 utódja 2023-as Fury 16 G10 a Raptor Lake-HX CPU-kat újabb Raptor Lake-HX Refresh opciókkal cseréli ki. Egyébként az alváz megegyezik a Fury 16 G10 vagy a Fury 16 G9 modellel, ahogyan számos konfigurálható opció is. Javasoljuk, hogy tekintse meg a felülvizsgálatunkat a Fury 16 G9 a modell fizikai jellemzőinek megismeréséhez.
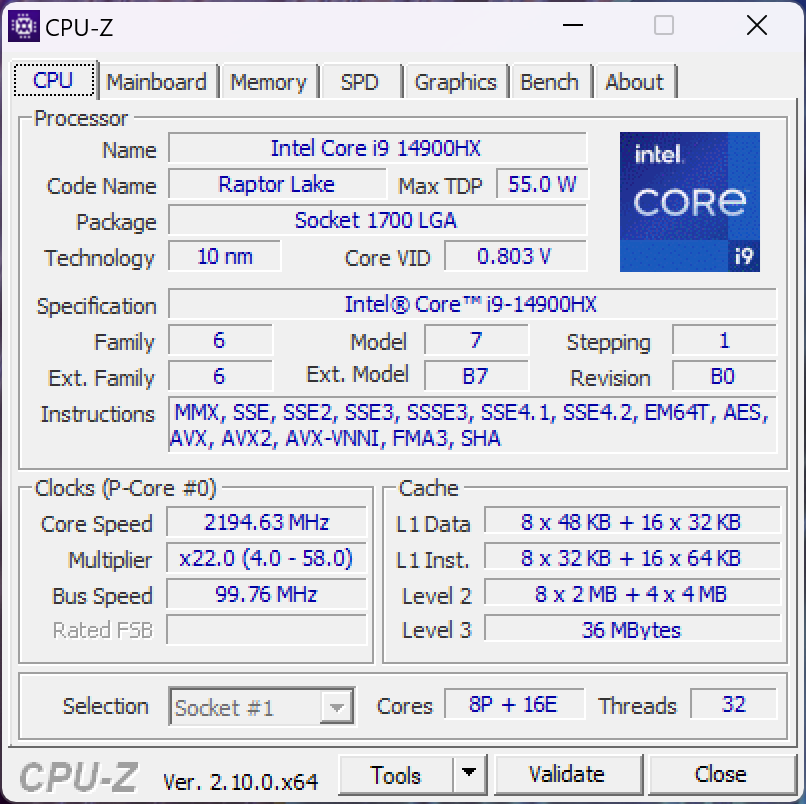
Tesztkészülékünk egy felső-középkategóriás konfiguráció Core i9-14900HX CPU-val, RTX 3500 Ada GPU-val és 120 Hz-es 3840 x 2400 IPS kijelzővel, körülbelül 3300 dollárért. A többi SKU a Core i5-13600HX-től kezdve egészen az RTX 5000 Ada és a 2400p OLED érintőképernyőig. Meteor Lake CPU opciók nincsenek.
A ZBook Fury 16 G11 versenytársai közé tartoznak más 16 hüvelykes munkaállomások, mint például a Dell Precision 5690, Lenovo ThinkPad P16 G2, vagy Asus ProArt Studiobook 16.
További HP értékelések:
Lehetséges versenytársak összehasonlítása
Értékelés | Változat | Dátum | Modell | Súly | Magasság | Méret | Felbontás | Legjobb ár |
|---|---|---|---|---|---|---|---|---|
| 85.9 % | v8 | 08/2024 | HP ZBook Fury 16 G11 i9-14900HX, RTX 3500 Ada Generation Laptop | 2.6 kg | 28.5 mm | 16.00" | 3840x2400 | |
| 92.3 % v7 (old) | v7 (old) | 03/2024 | HP ZBook Fury 16 G10 i9-13950HX, RTX 5000 Ada Generation Laptop | 2.6 kg | 28.5 mm | 16.00" | 3840x2400 | |
| 91 % v7 (old) | v7 (old) | HP ZBook Fury 16 G9 i9-12950HX, RTX A5500 Laptop GPU | 2.6 kg | 28.5 mm | 16.00" | 3840x2400 | ||
| 88.3 % v7 (old) | v7 (old) | 05/2024 | Dell Precision 5690 Ultra 9 185H, RTX 5000 Ada Generation Laptop | 2.3 kg | 22.17 mm | 16.00" | 3840x2400 | |
| 90.2 % v7 (old) | v7 (old) | Lenovo ThinkPad P16 G2 21FA000FGE i7-13700HX, RTX 2000 Ada Generation Laptop | 3 kg | 30.23 mm | 16.00" | 2560x1600 | ||
| 90.1 % v7 (old) | v7 (old) | Lenovo ThinkPad P1 G6 21FV001KUS i7-13800H, GeForce RTX 4080 Laptop GPU | 1.9 kg | 17.5 mm | 16.00" | 3480x2400 | ||
| 86.1 % v7 (old) | v7 (old) | 07/2023 | Asus ProArt Studiobook 16 OLED H7604 i9-13980HX, GeForce RTX 4070 Laptop GPU | 2.4 kg | 23.9 mm | 16.00" | 3200x2000 |
Figyelmeztetés: Wir haben unser Rating-System kürzlich aktualizált és die Ergebnisse von Version 8 sind nicht mit den Ergebnissen von Version 7 vergleichbar. További információk ehhez sind hier elérhető.
Megjegyzés: Nemrégiben frissítettük a minősítési rendszerünket, és a 8-as verzió eredményei nem hasonlíthatók össze a 7-es verzió eredményeivel. További információk elérhetők itt .
Ügy
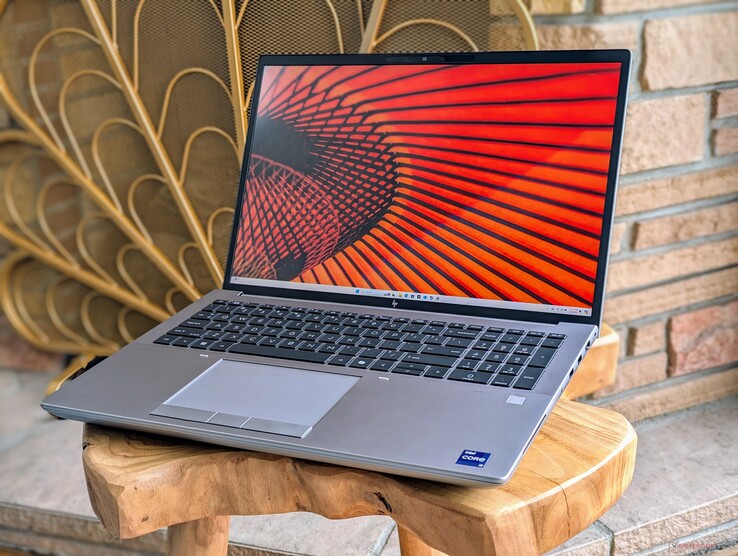
A ZBook Fury 16 G11-et könnyen megkülönböztethetjük a korábbi változatoktól, ha megkeressük a Co-Pilot billentyűt a billentyűzeten. Egyébként az alváz kialakítása ugyanaz marad, mint korábban.

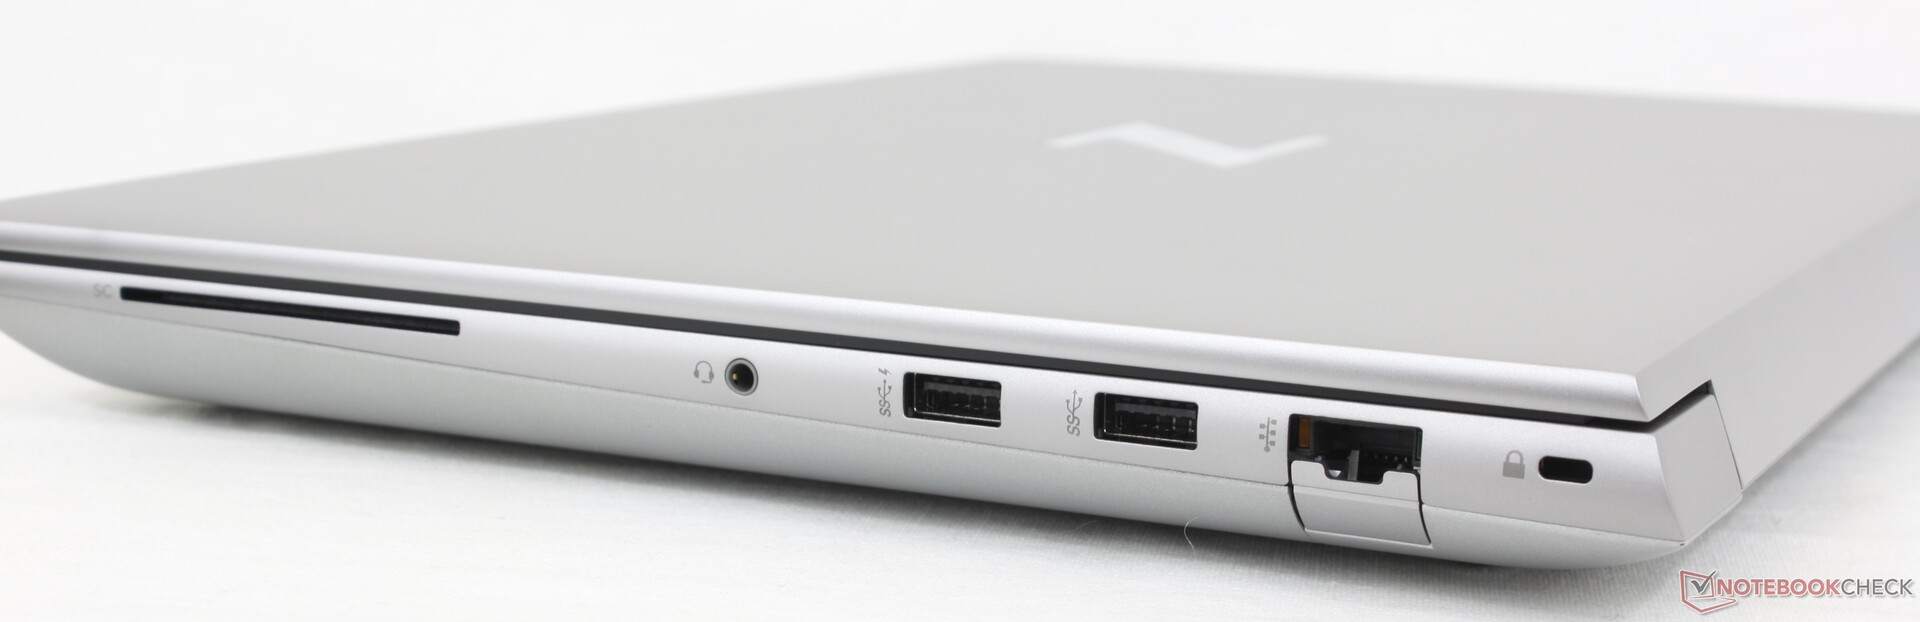
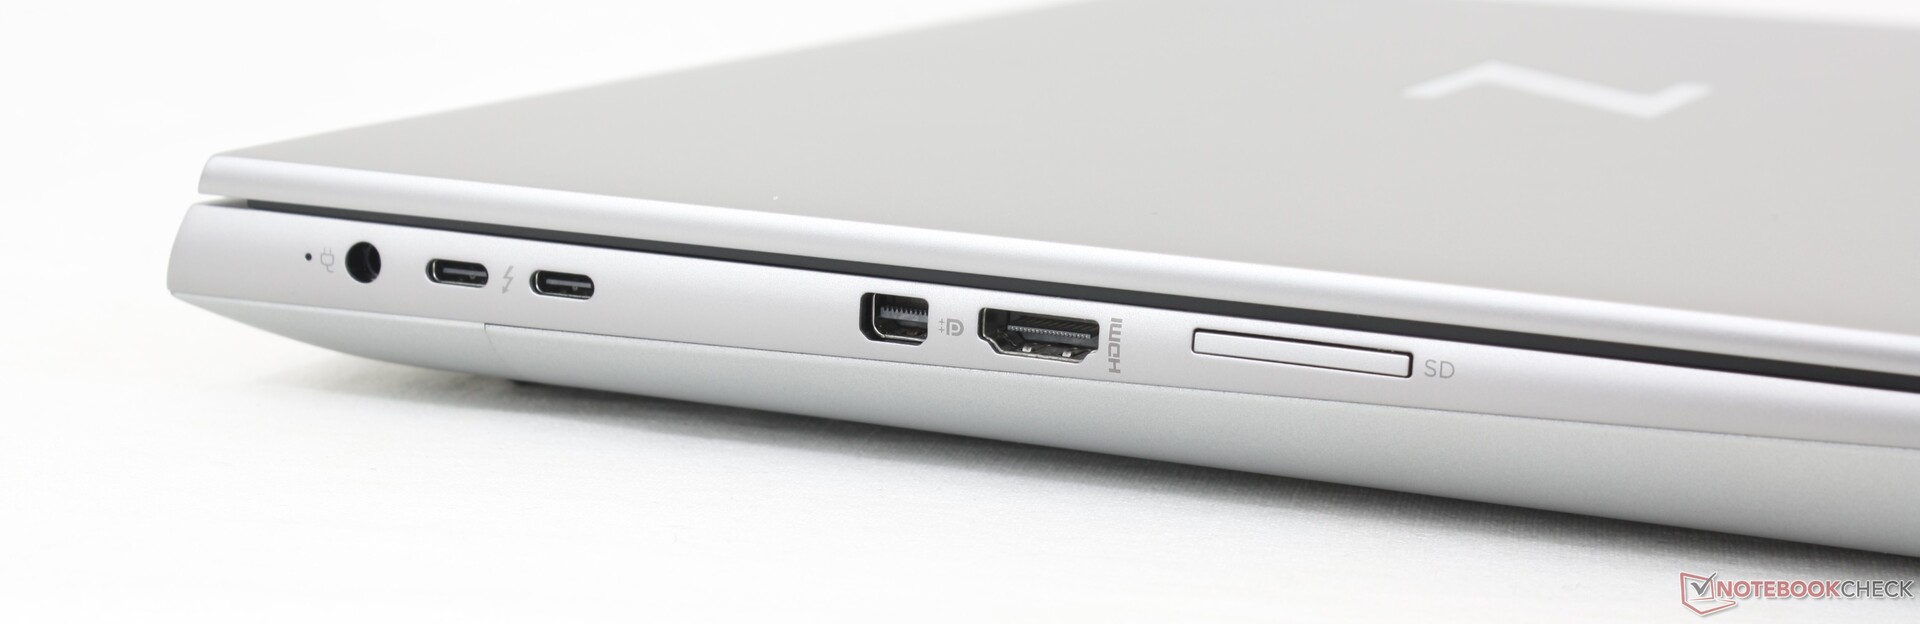
Csatlakoztathatóság
SD kártyaolvasó
| SD Card Reader | |
| average JPG Copy Test (av. of 3 runs) | |
| Lenovo ThinkPad P1 G6 21FV001KUS (Toshiba Exceria Pro SDXC 64 GB UHS-II) | |
| HP ZBook Fury 16 G11 (Toshiba Exceria Pro SDXC 64 GB UHS-II) | |
| HP ZBook Fury 16 G10 (Toshiba Exceria Pro SDXC 64 GB UHS-II) | |
| HP ZBook Fury 16 G9 (PNY EliteX-PRO60) | |
| Asus ProArt Studiobook 16 OLED H7604 (Angelibird AV Pro V60) | |
| Lenovo ThinkPad P16 G2 21FA000FGE | |
| maximum AS SSD Seq Read Test (1GB) | |
| HP ZBook Fury 16 G11 (Toshiba Exceria Pro SDXC 64 GB UHS-II) | |
| Lenovo ThinkPad P1 G6 21FV001KUS (Toshiba Exceria Pro SDXC 64 GB UHS-II) | |
| HP ZBook Fury 16 G10 (Toshiba Exceria Pro SDXC 64 GB UHS-II) | |
| HP ZBook Fury 16 G9 (PNY EliteX-PRO60) | |
| Lenovo ThinkPad P16 G2 21FA000FGE | |
| Asus ProArt Studiobook 16 OLED H7604 (Angelibird AV Pro V60) | |
Kommunikáció
A WLAN-t az Intel AX211-ről a BE200-ra frissítették a megfelelő Wi-Fi 7 támogatás érdekében. A gyakorlatban azonban a legtöbb felhasználó továbbra is Wi-Fi 6 vagy 6E hozzáférési pontokhoz csatlakozik.
| Networking | |
| iperf3 transmit AXE11000 | |
| Asus ProArt Studiobook 16 OLED H7604 | |
| HP ZBook Fury 16 G10 | |
| Dell Precision 5690 | |
| Lenovo ThinkPad P1 G6 21FV001KUS | |
| HP ZBook Fury 16 G11 | |
| HP ZBook Fury 16 G9 | |
| Lenovo ThinkPad P16 G2 21FA000FGE | |
| iperf3 receive AXE11000 | |
| Asus ProArt Studiobook 16 OLED H7604 | |
| Lenovo ThinkPad P16 G2 21FA000FGE | |
| Dell Precision 5690 | |
| HP ZBook Fury 16 G9 | |
| HP ZBook Fury 16 G10 | |
| Lenovo ThinkPad P1 G6 21FV001KUS | |
| HP ZBook Fury 16 G11 | |
| iperf3 transmit AXE11000 6GHz | |
| HP ZBook Fury 16 G11 | |
| HP ZBook Fury 16 G10 | |
| Dell Precision 5690 | |
| Lenovo ThinkPad P1 G6 21FV001KUS | |
| Lenovo ThinkPad P16 G2 21FA000FGE | |
| iperf3 receive AXE11000 6GHz | |
| Lenovo ThinkPad P16 G2 21FA000FGE | |
| HP ZBook Fury 16 G11 | |
| Dell Precision 5690 | |
| HP ZBook Fury 16 G10 | |
| Lenovo ThinkPad P1 G6 21FV001KUS | |
Webkamera


Karbantartás
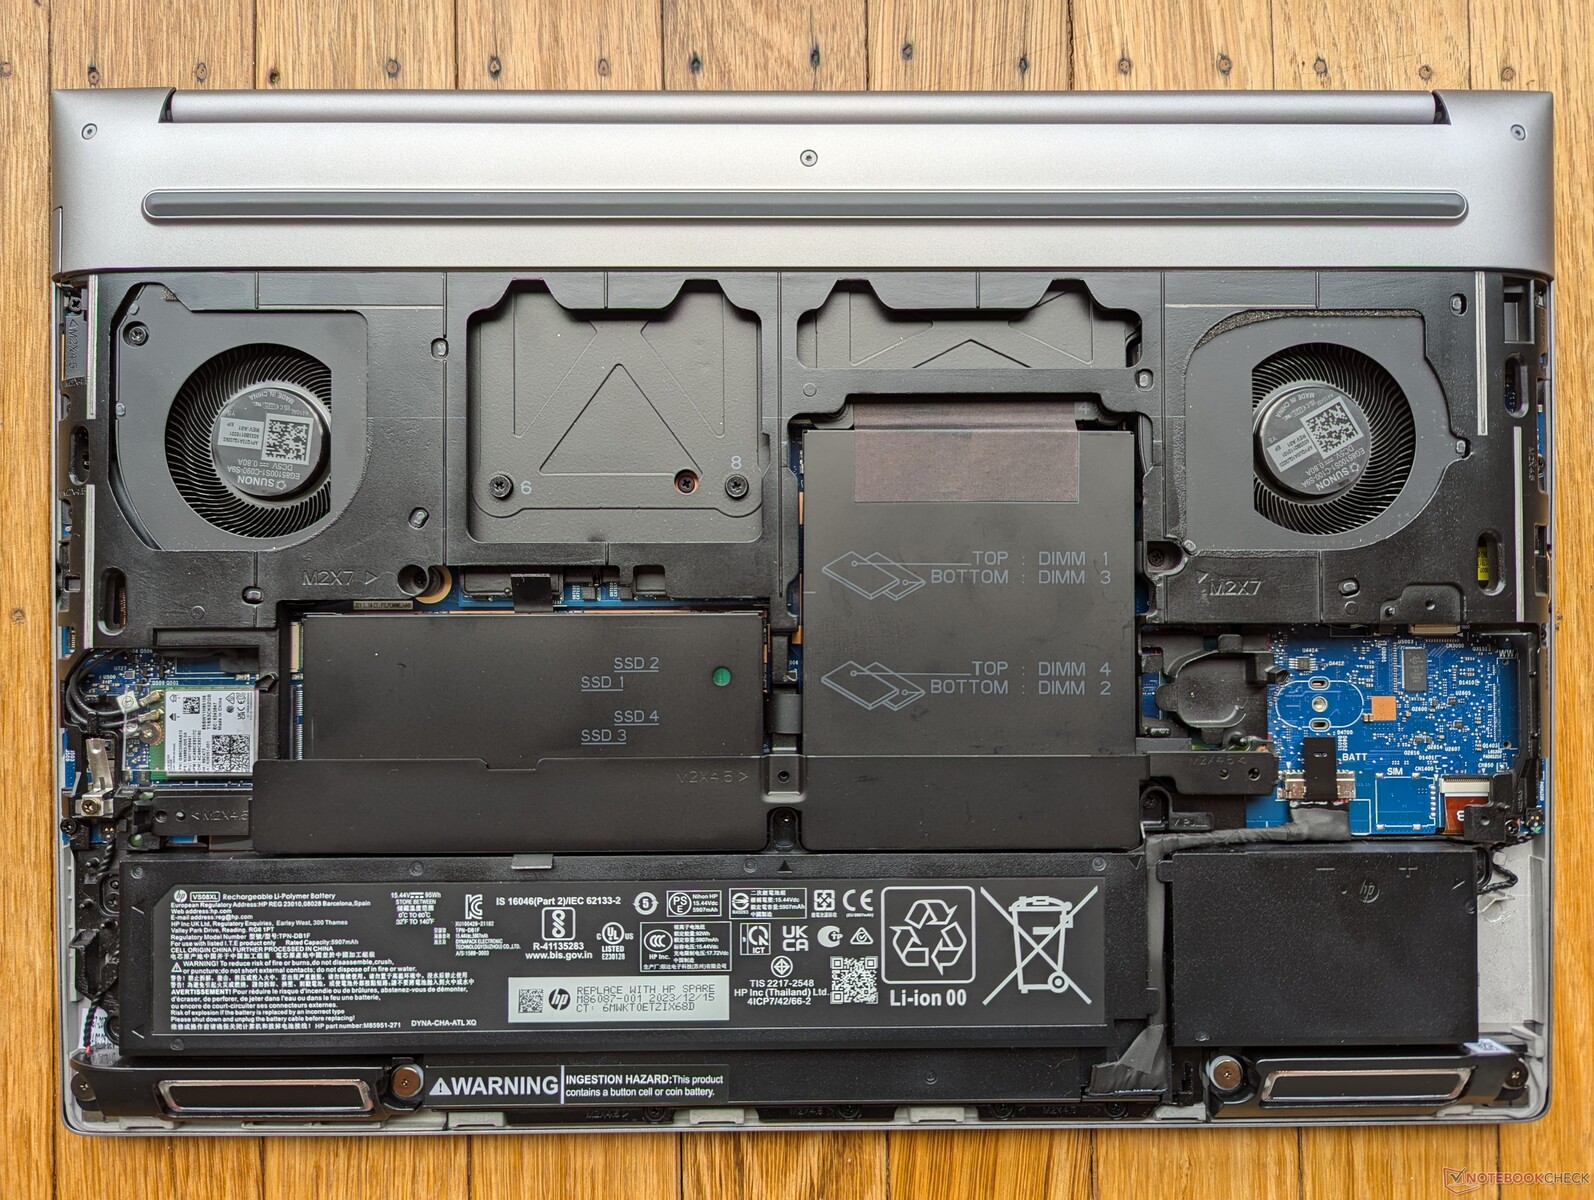
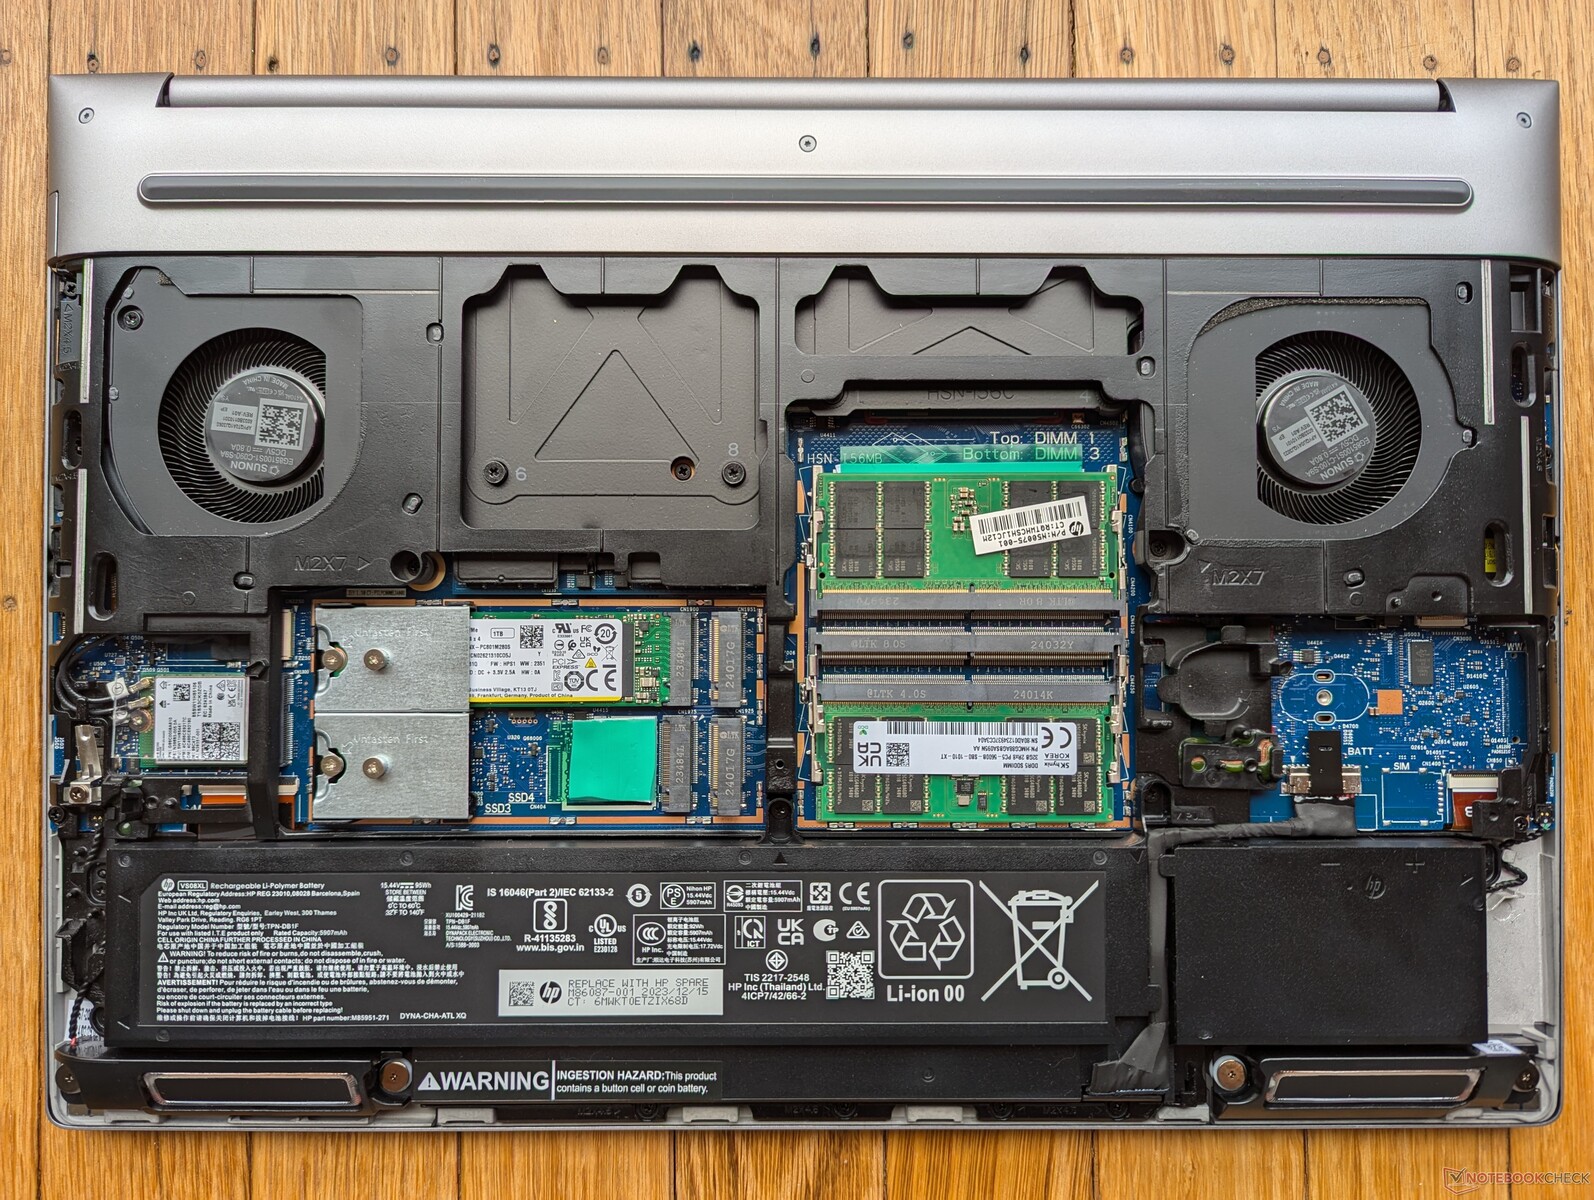
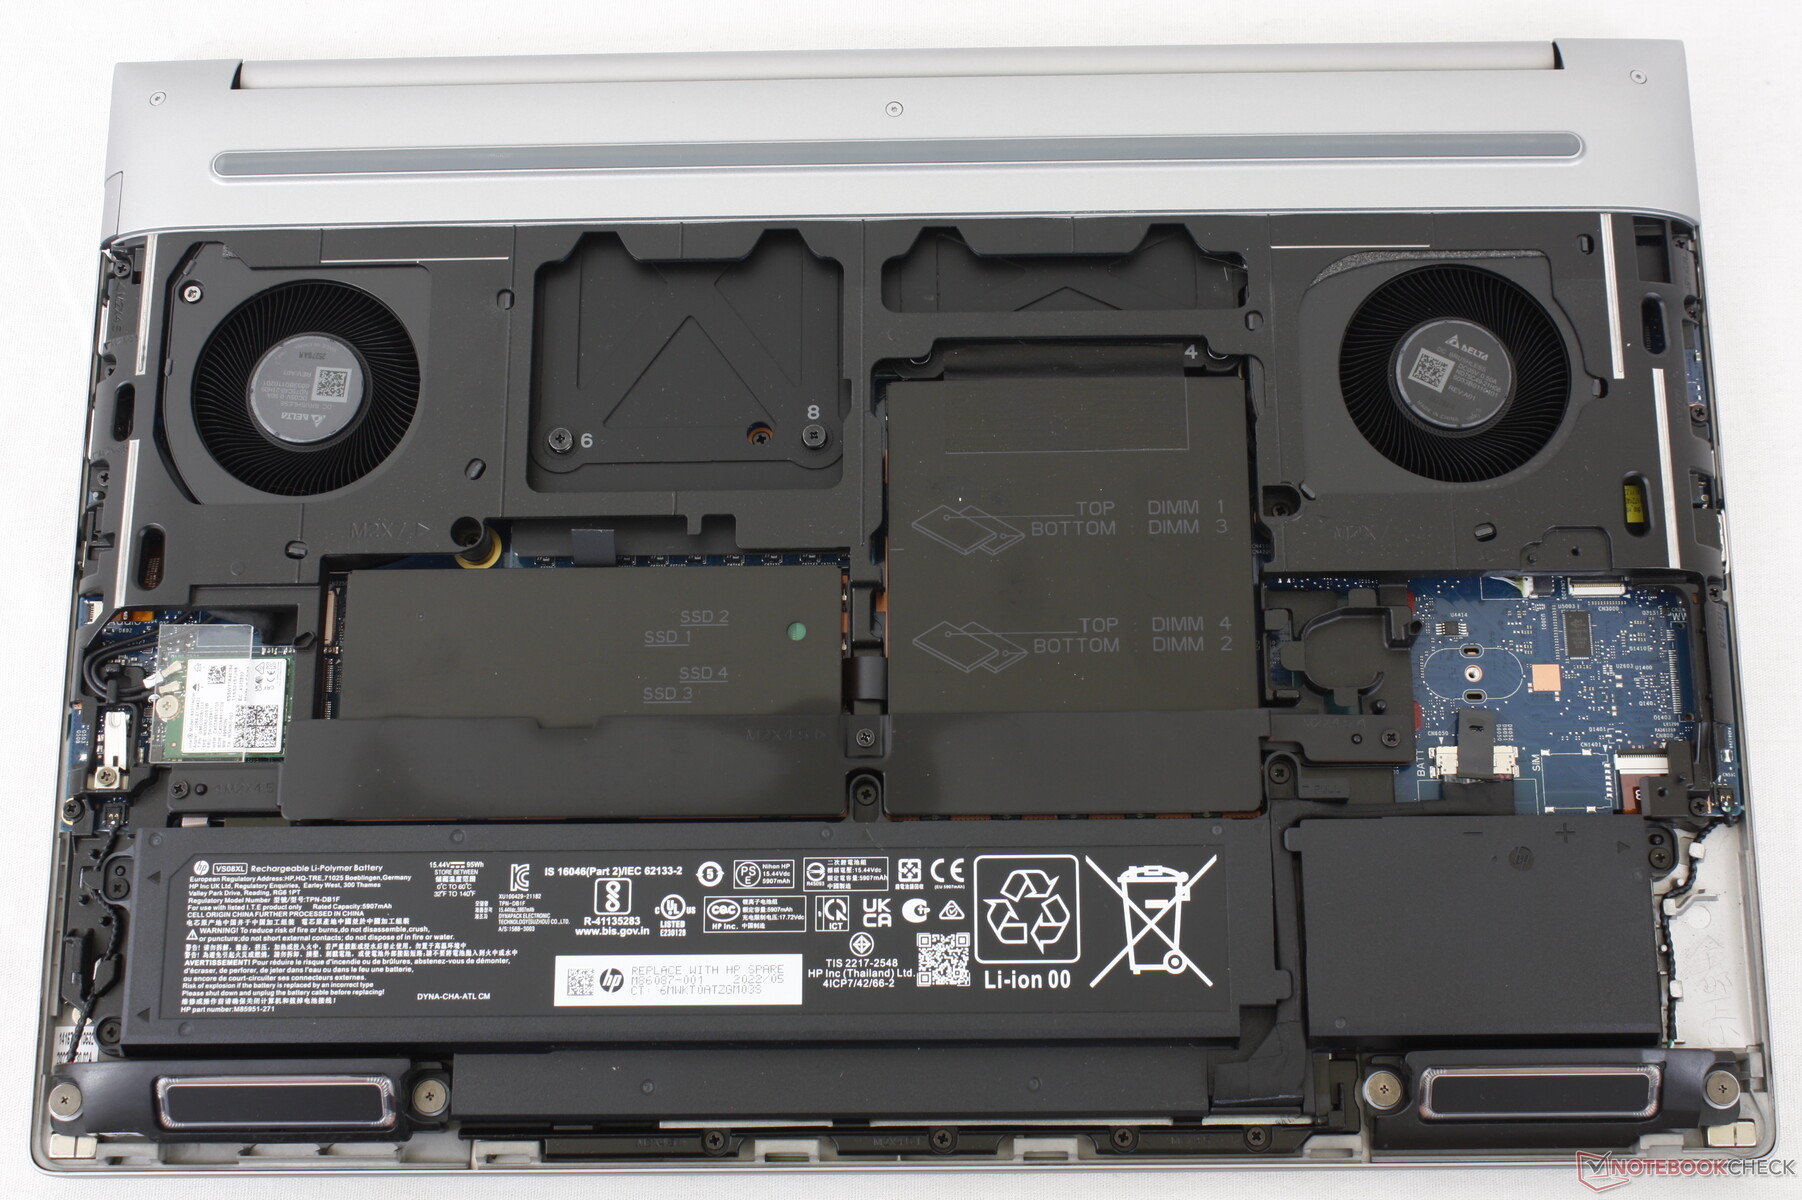
A HP a tavalyi év eleji G9 modell óta büszkélkedik a Fury 16 sorozat szerszám nélküli szervizelésével. Míg az alsó panel könnyen, szerszám nélkül lecsúszott, a RAM- és SODIMM-modulokat továbbra is egy alumínium borítás védte, amelynek eltávolításához csavarhúzóra volt szükség. Ezt az alumíniumfedelet a G11-es modellnél csavarok helyett reteszekkel alakították át, ami azt jelenti, hogy a felhasználók mostantól szerszámok nélkül is beszerelhetik a RAM-modulokat.
Az SSD-ket azonban továbbra is csavarokkal rögzítik az alaplaphoz, így a meghajtók cseréjéhez továbbra is csavarhúzóra van szükség. A rendszer akár négy SSD-t és négy RAM-modult is támogathat.
Fenntarthatóság
A csomagolás teljes mértékben újrahasznosítható, és nagyrészt papírból áll. A hálózati adapter az egyetlen műanyagba csomagolt termék.
Tartozékok és garancia
A kiskereskedelmi doboz a hálózati adapteren és a papírmunkán kívül nem tartalmaz semmilyen extrát. Az Egyesült Államokban történő vásárlás esetén három év gyártói garancia jár.
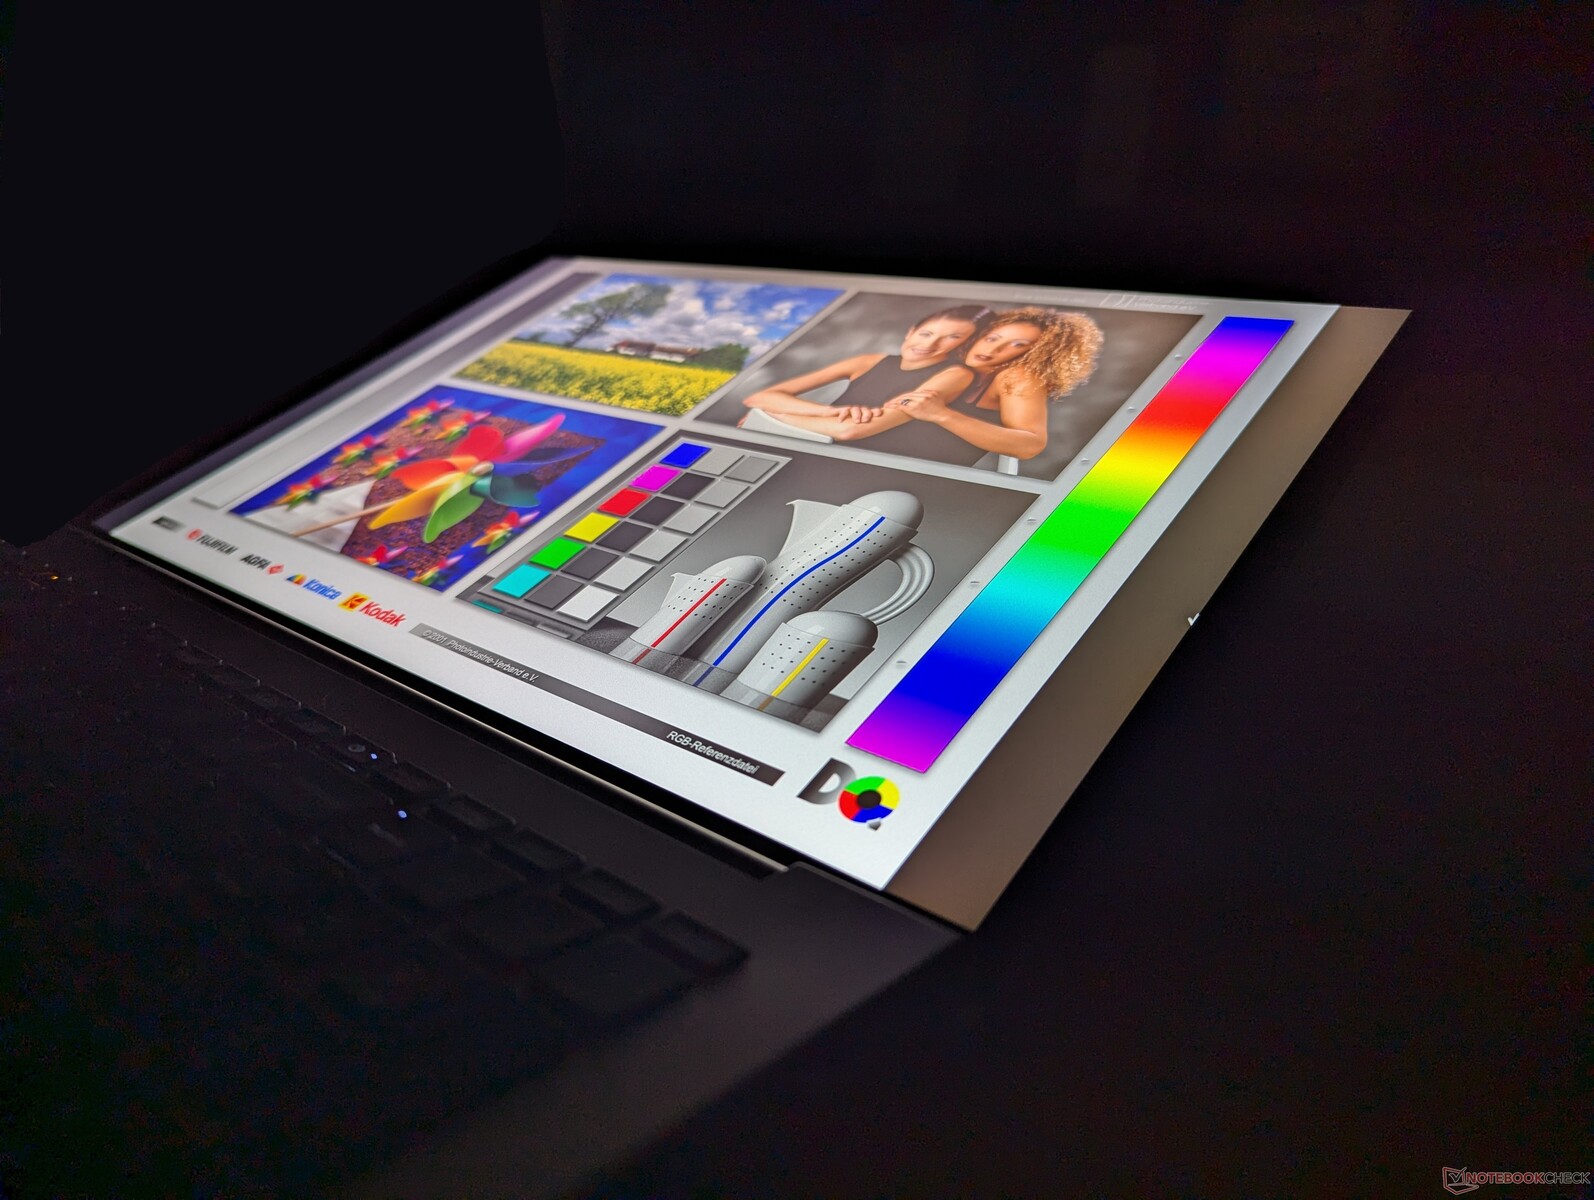
Megjelenítés
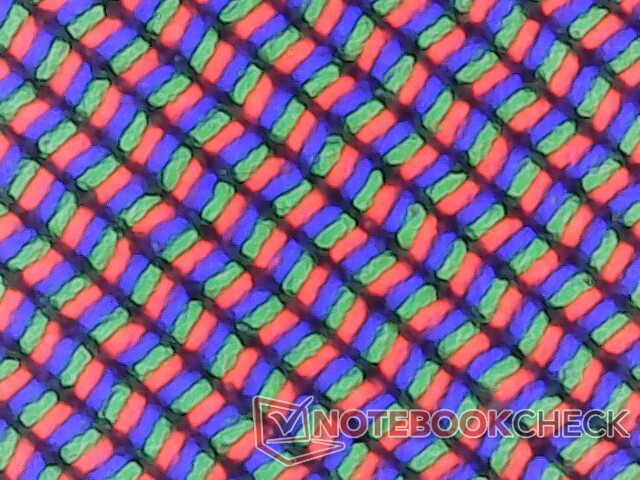
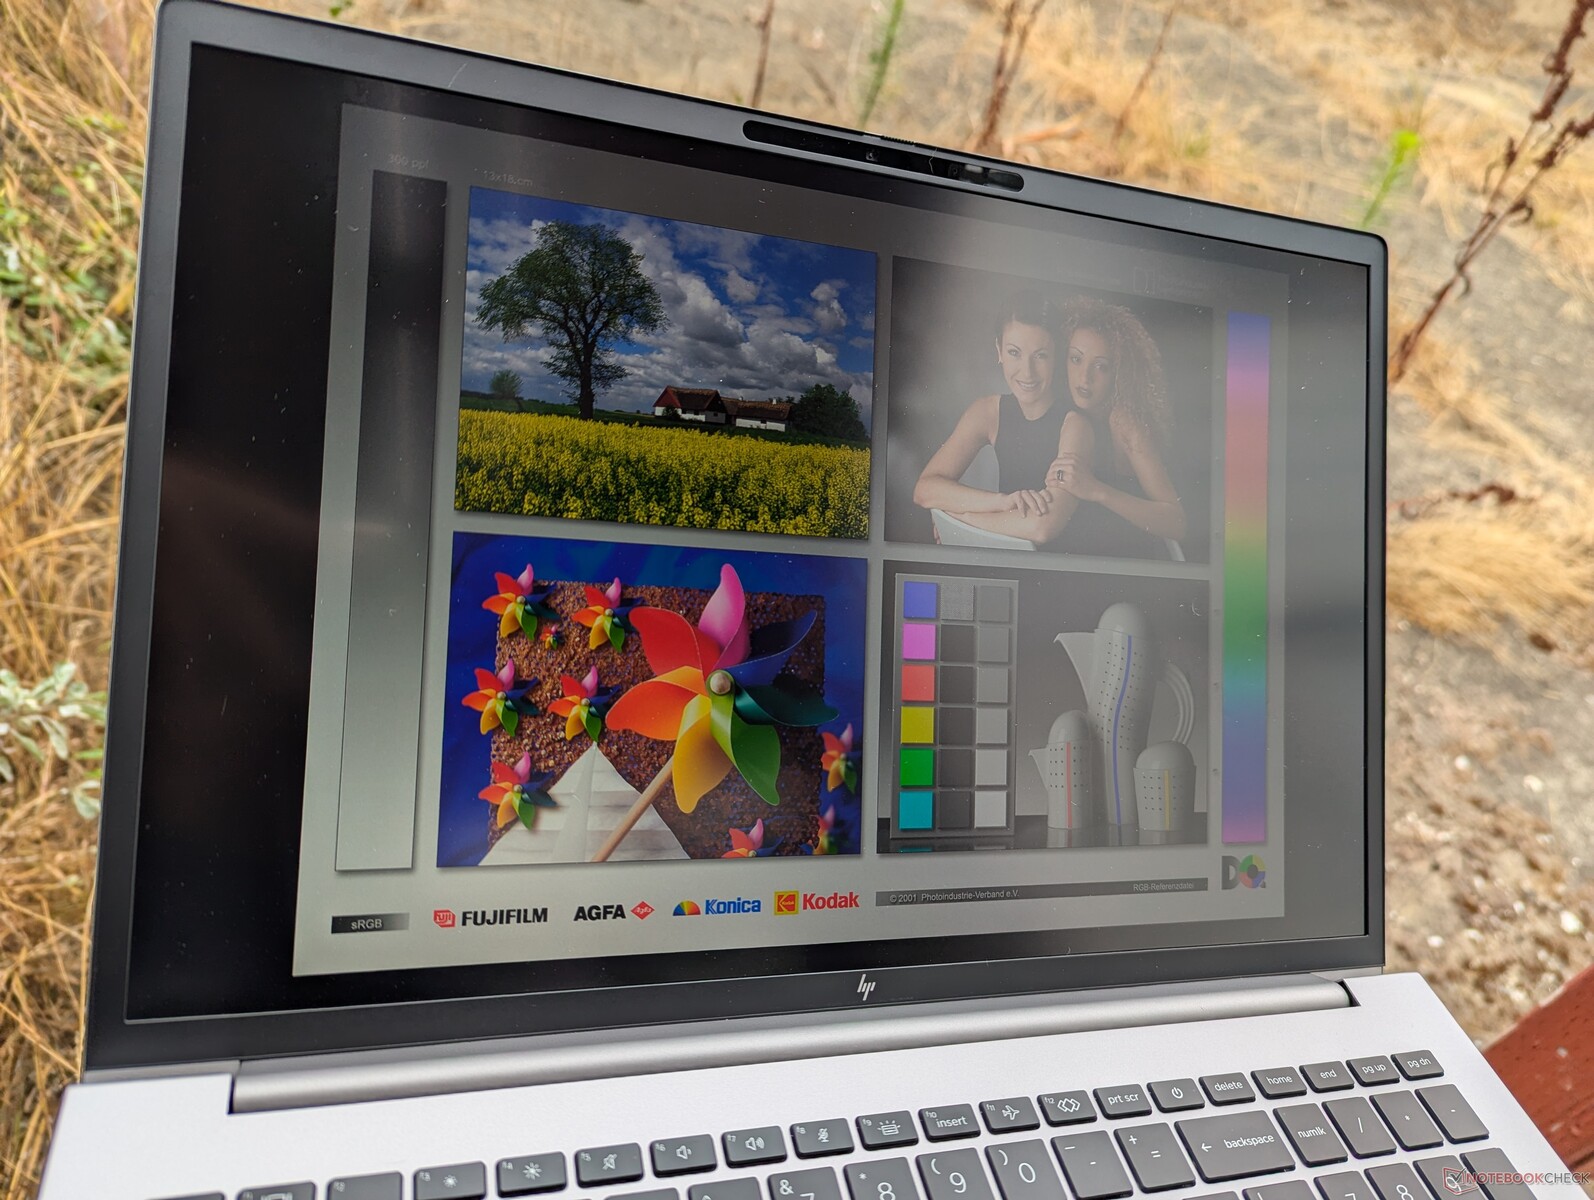
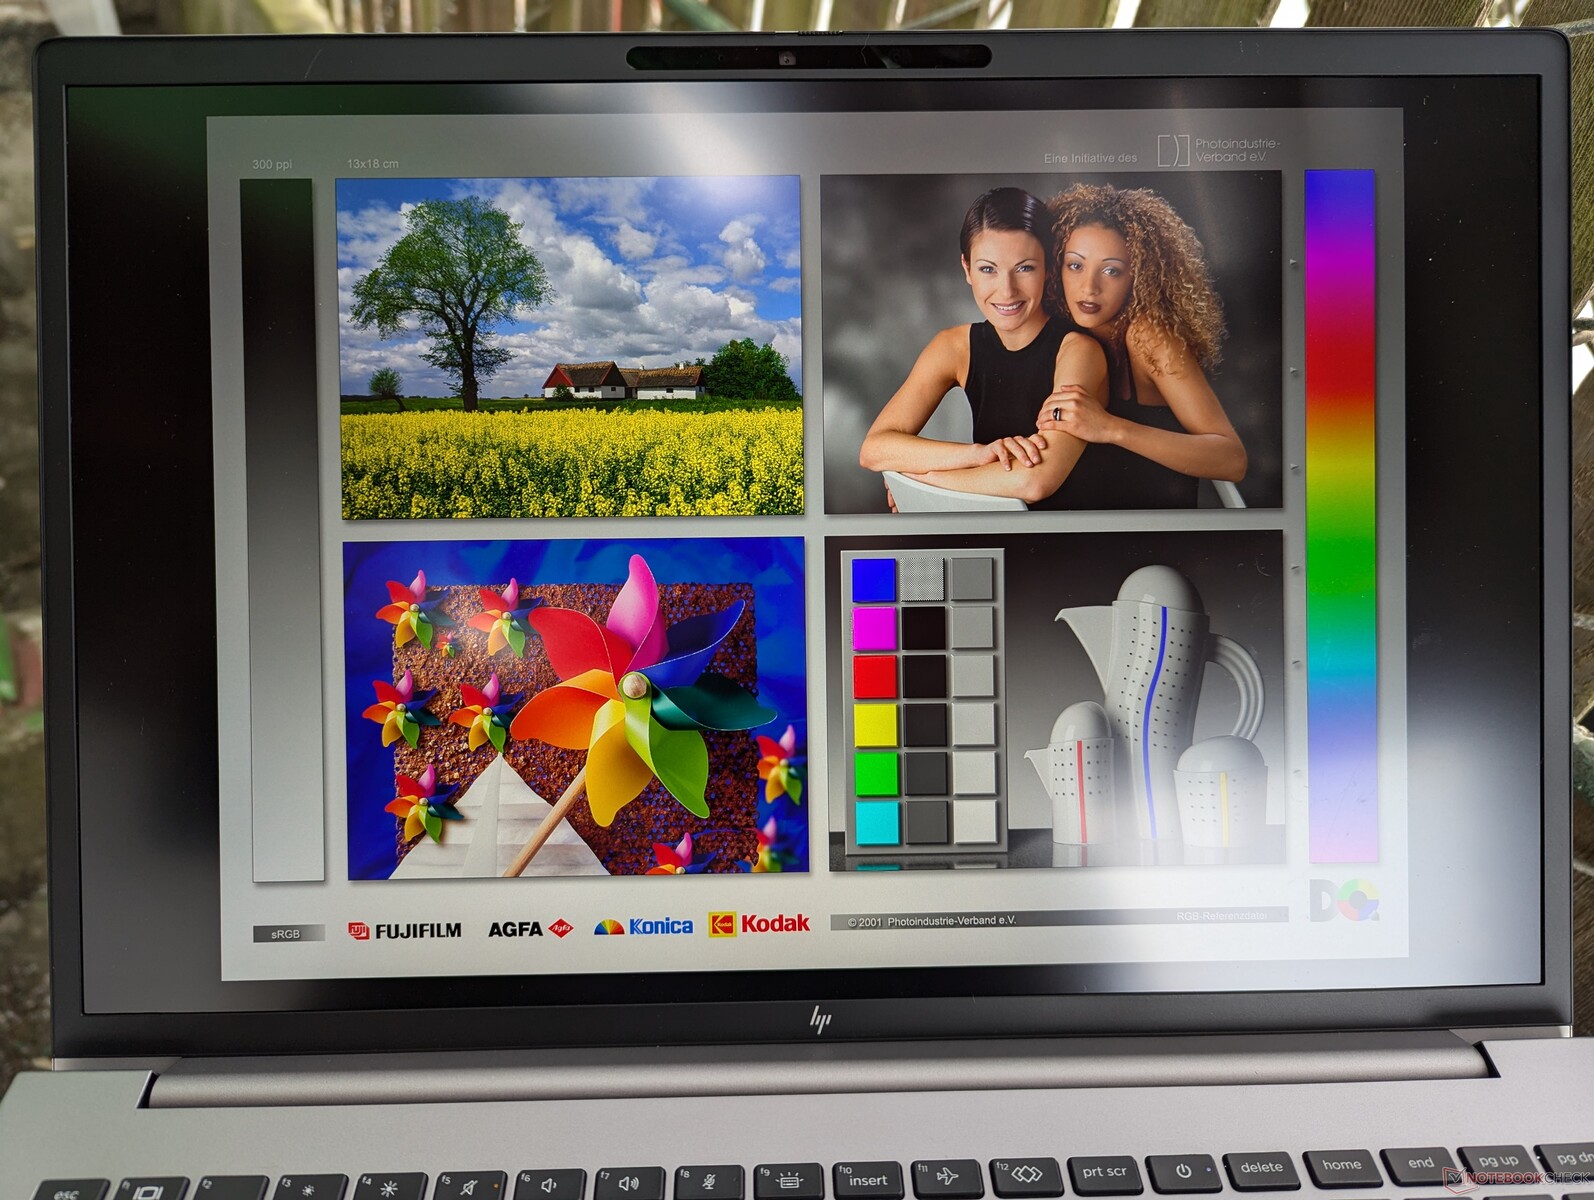
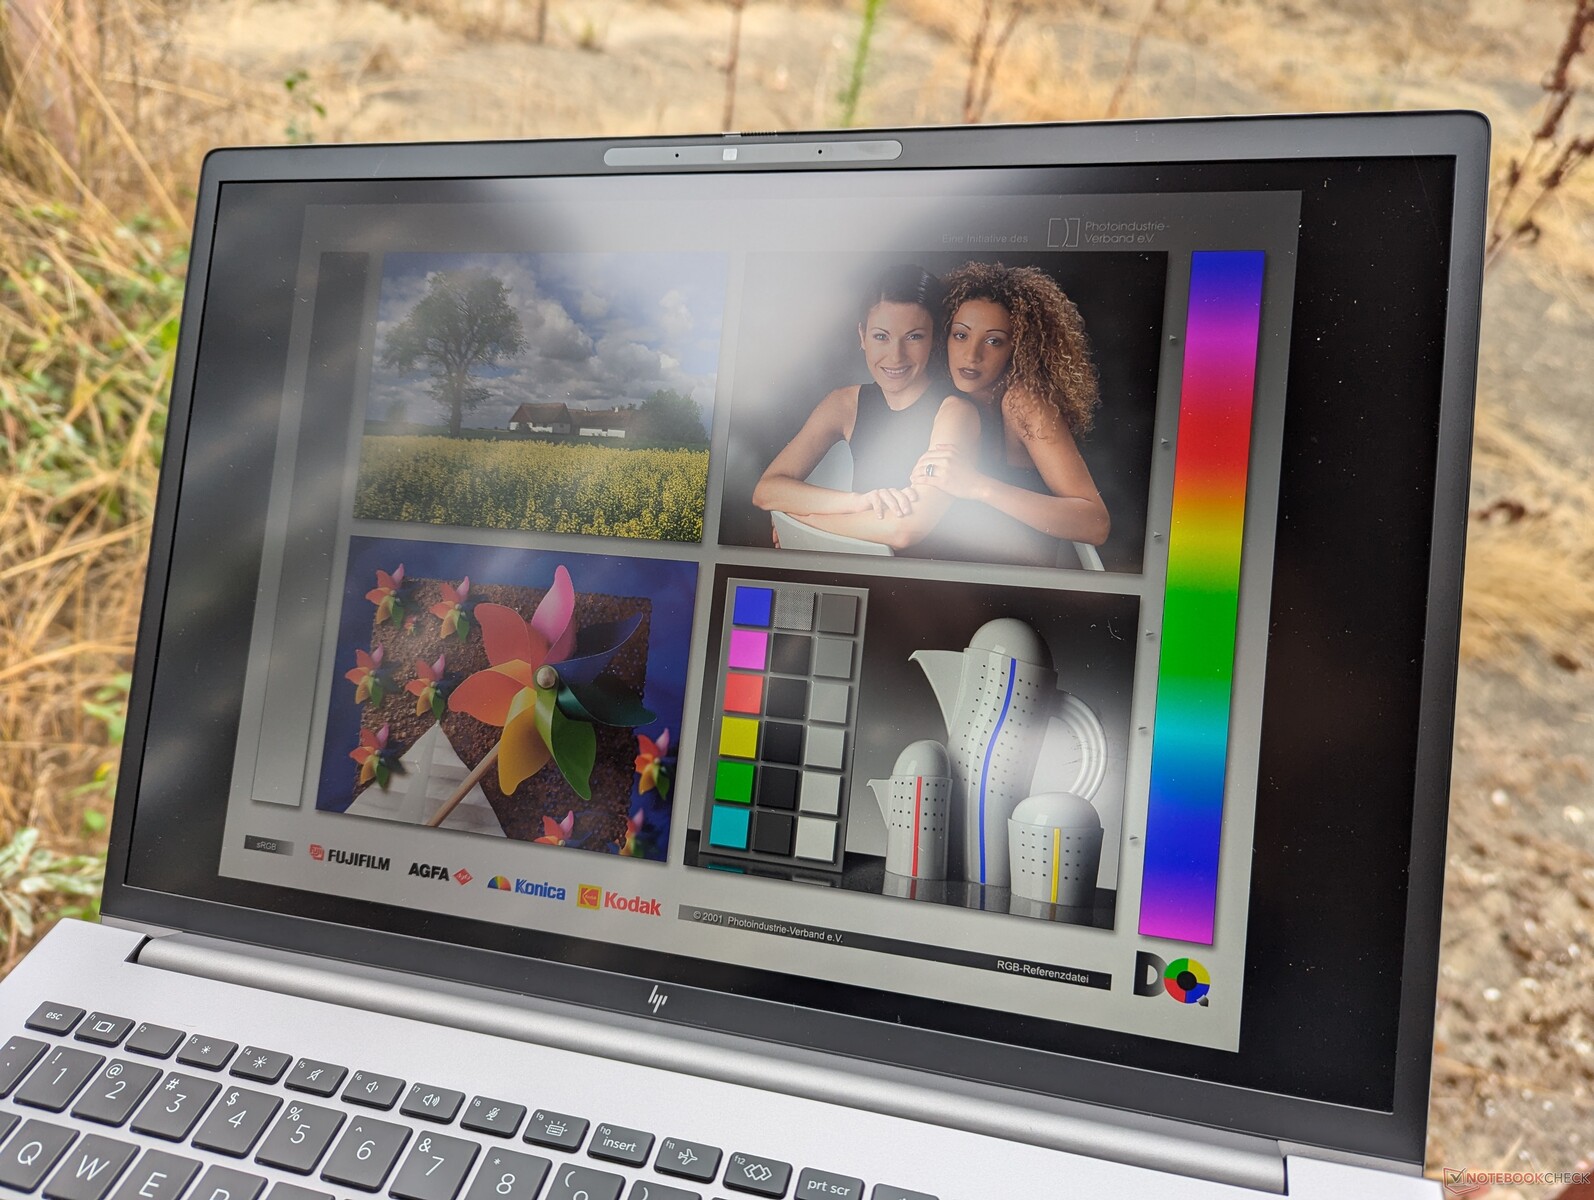
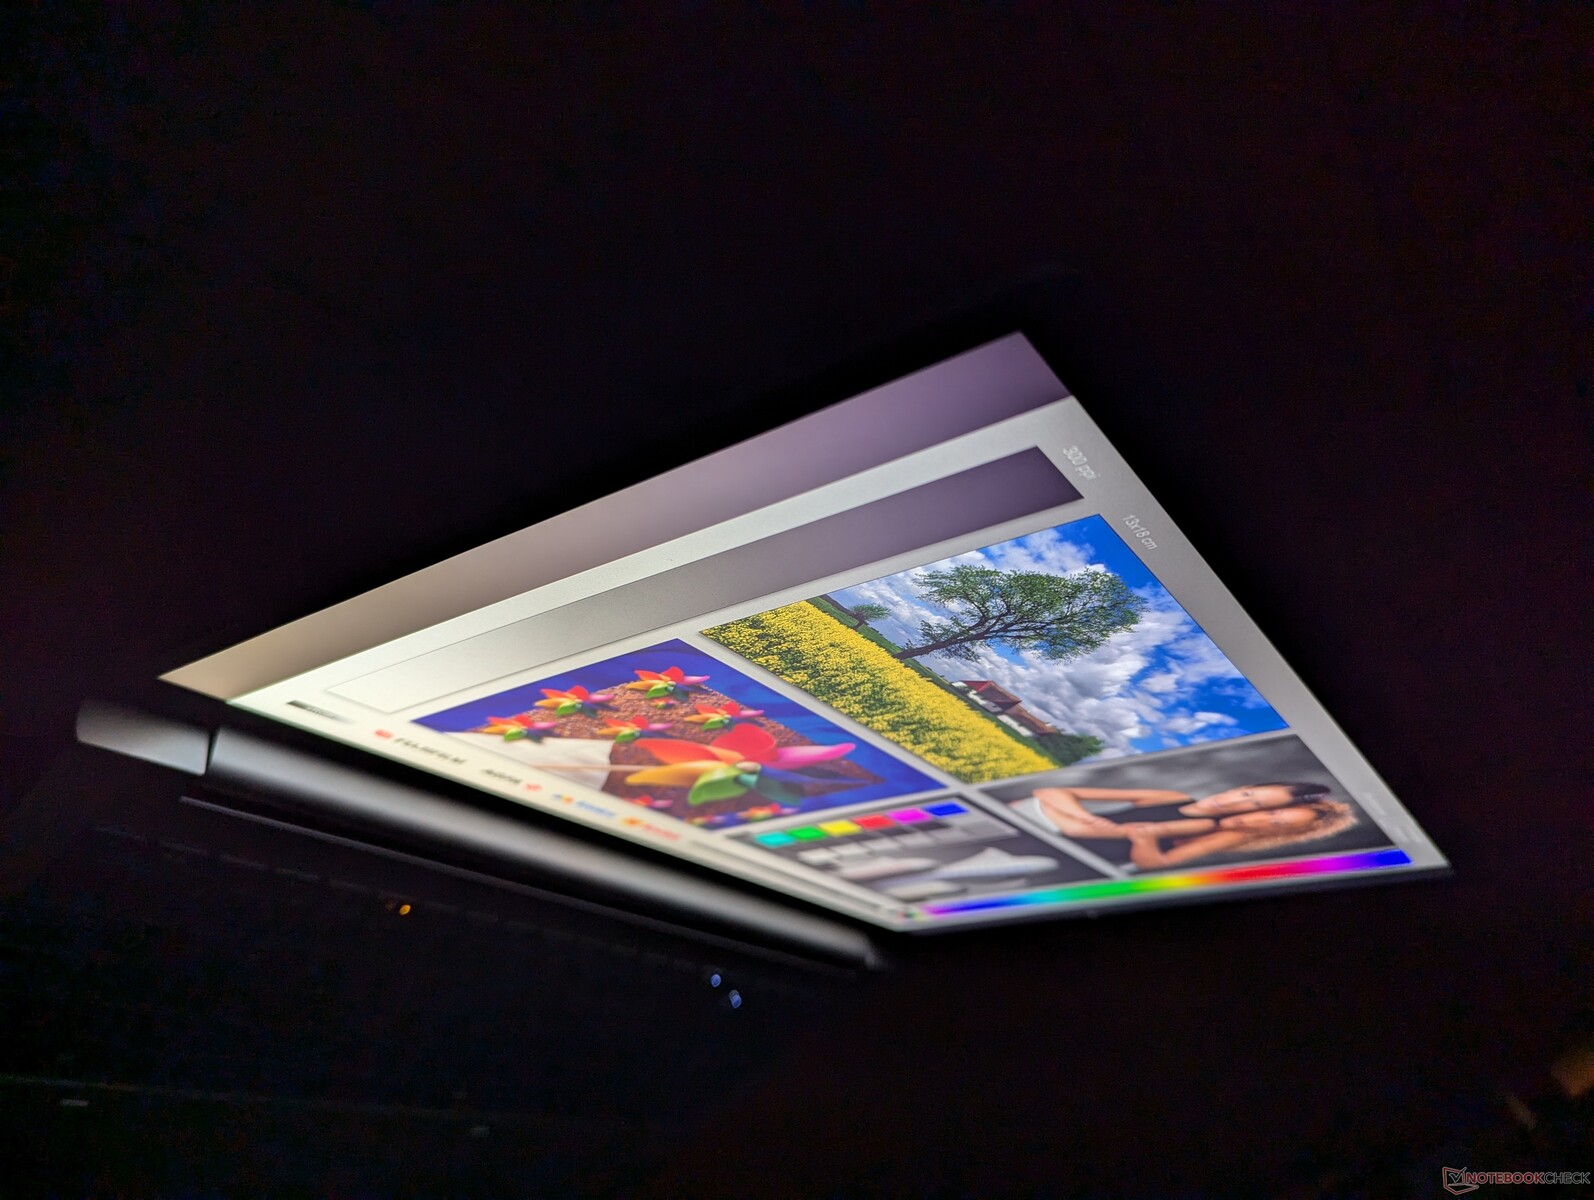
Öt megjelenítési lehetőség áll rendelkezésre az alábbiak szerint. A mi konkrét tesztkészülékünk a félkövérrel szedett panellel van felszerelve.
- 3840 x 2400, OLED, érintőképernyő, fényes, 400 nits, 100% DCI-P3, 60 Hz
- 3840 x 2400, IPS, nem érintőképernyő, matt, 500 nits, 100% DCI-P3, 120 Hz
- 1920 x 1200, IPS, nem érintésérzékeny, matt, 400 nits, 100% sRGB, 60 Hz
- 1920 x 1200, IPS, érintés nélküli, matt, 1000 nits, 100% sRGB, 60 Hz, Sure View Integrated
- 1920 x 1200, IPS, érintőképernyő, fényes, 400 nits, 100% sRGB, 60 Hz
Ez a konkrét panel történetesen ugyanaz, amely a ZBook Fury 16 G10-ünkkel együtt került a fedélzetre, így a vizuális élmény továbbra is azonos. Azoknak a vásárlóknak, akik a laptopot kültéren kívánják használni, érdemes megfontolniuk az 1000 nites opciót, de ez a panel sajnos a Sure View-hoz van kötve, ami jelentősen korlátozza a betekintési szögeket, így a képernyőt nehezebb megosztani másokkal. Eközben az OLED opció sokkal jobb feketeszinteket kínál a digitális művészek és a multimédiás szerkesztő alkalmazások számára, de fényes felülete és csekély 60 Hz-es frissítési frekvenciája kikapcsoló lehet.
A Windows dinamikus frissítési frekvencia csak 60 Hz-ig támogatott a konfigurált panelen.
| |||||||||||||||||||||||||
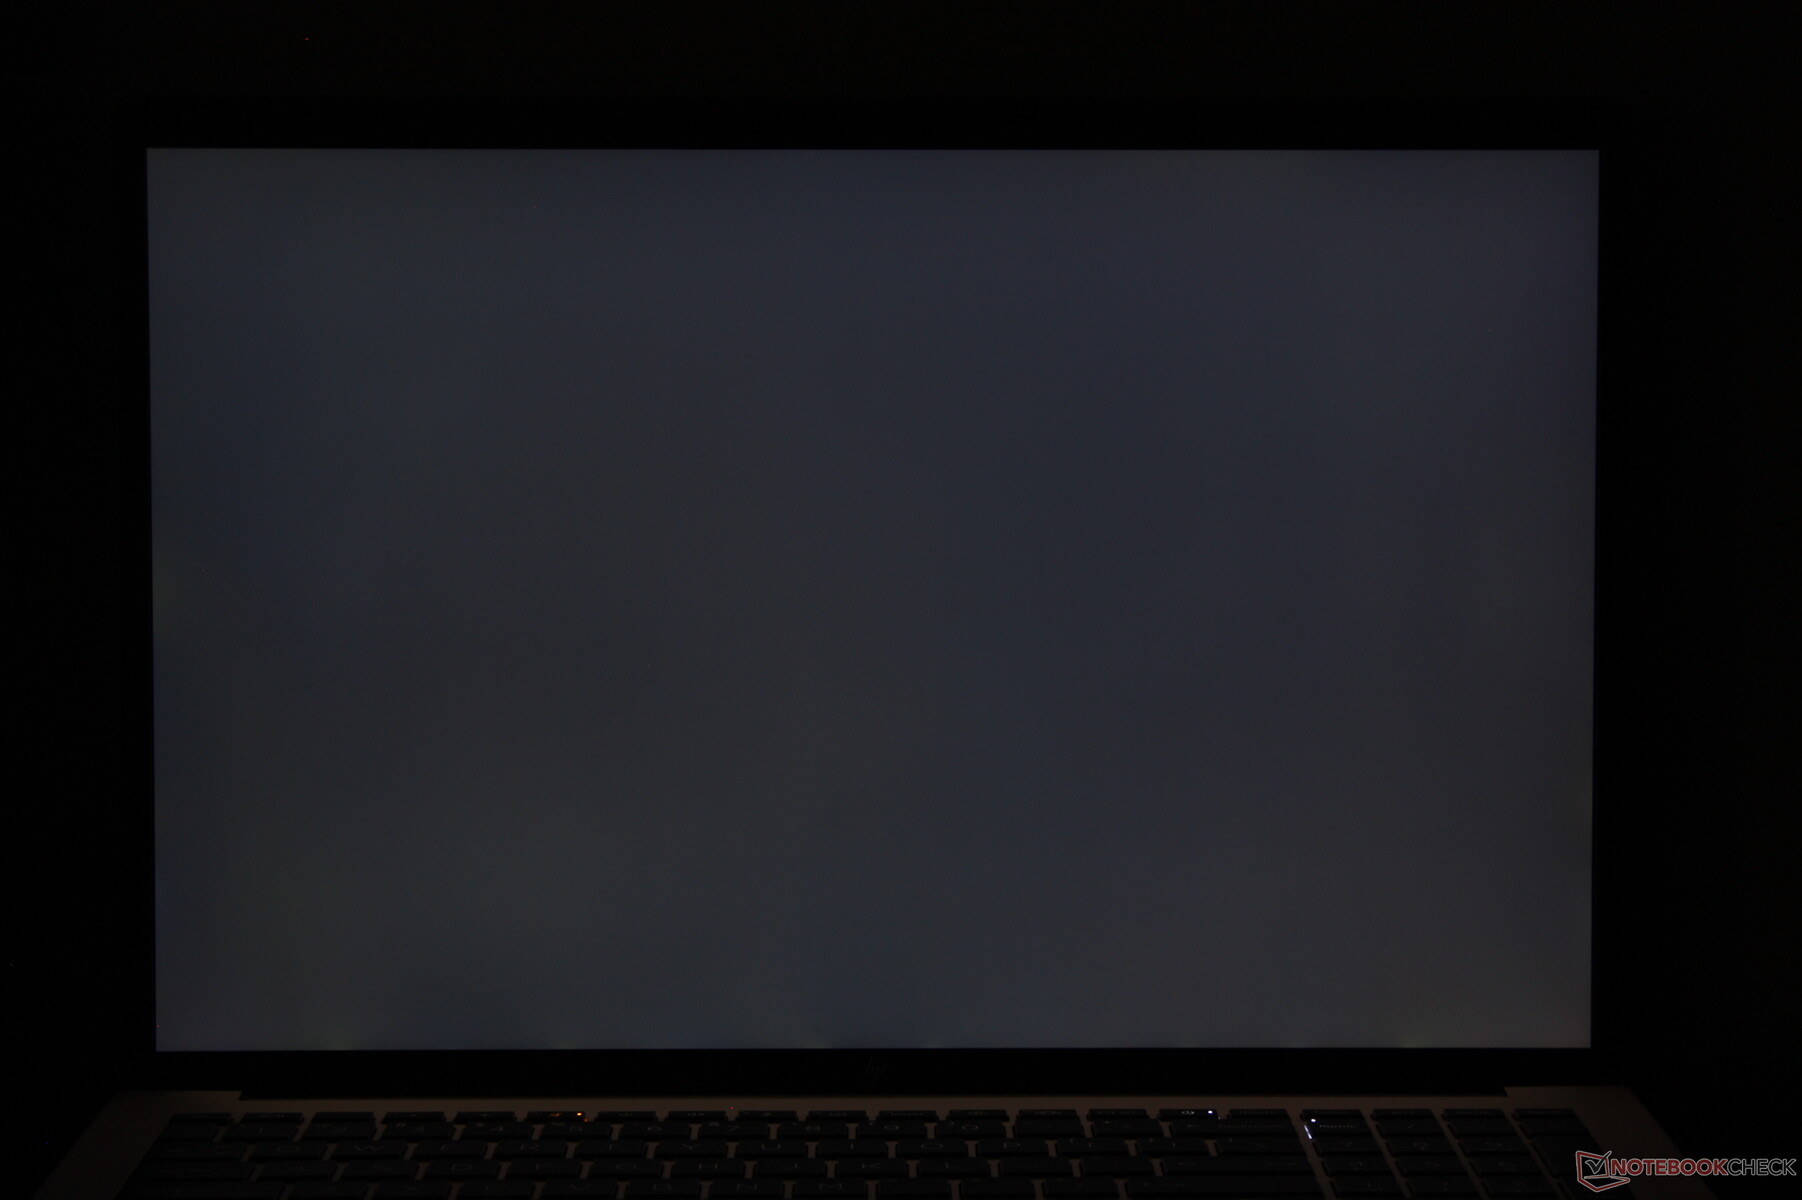
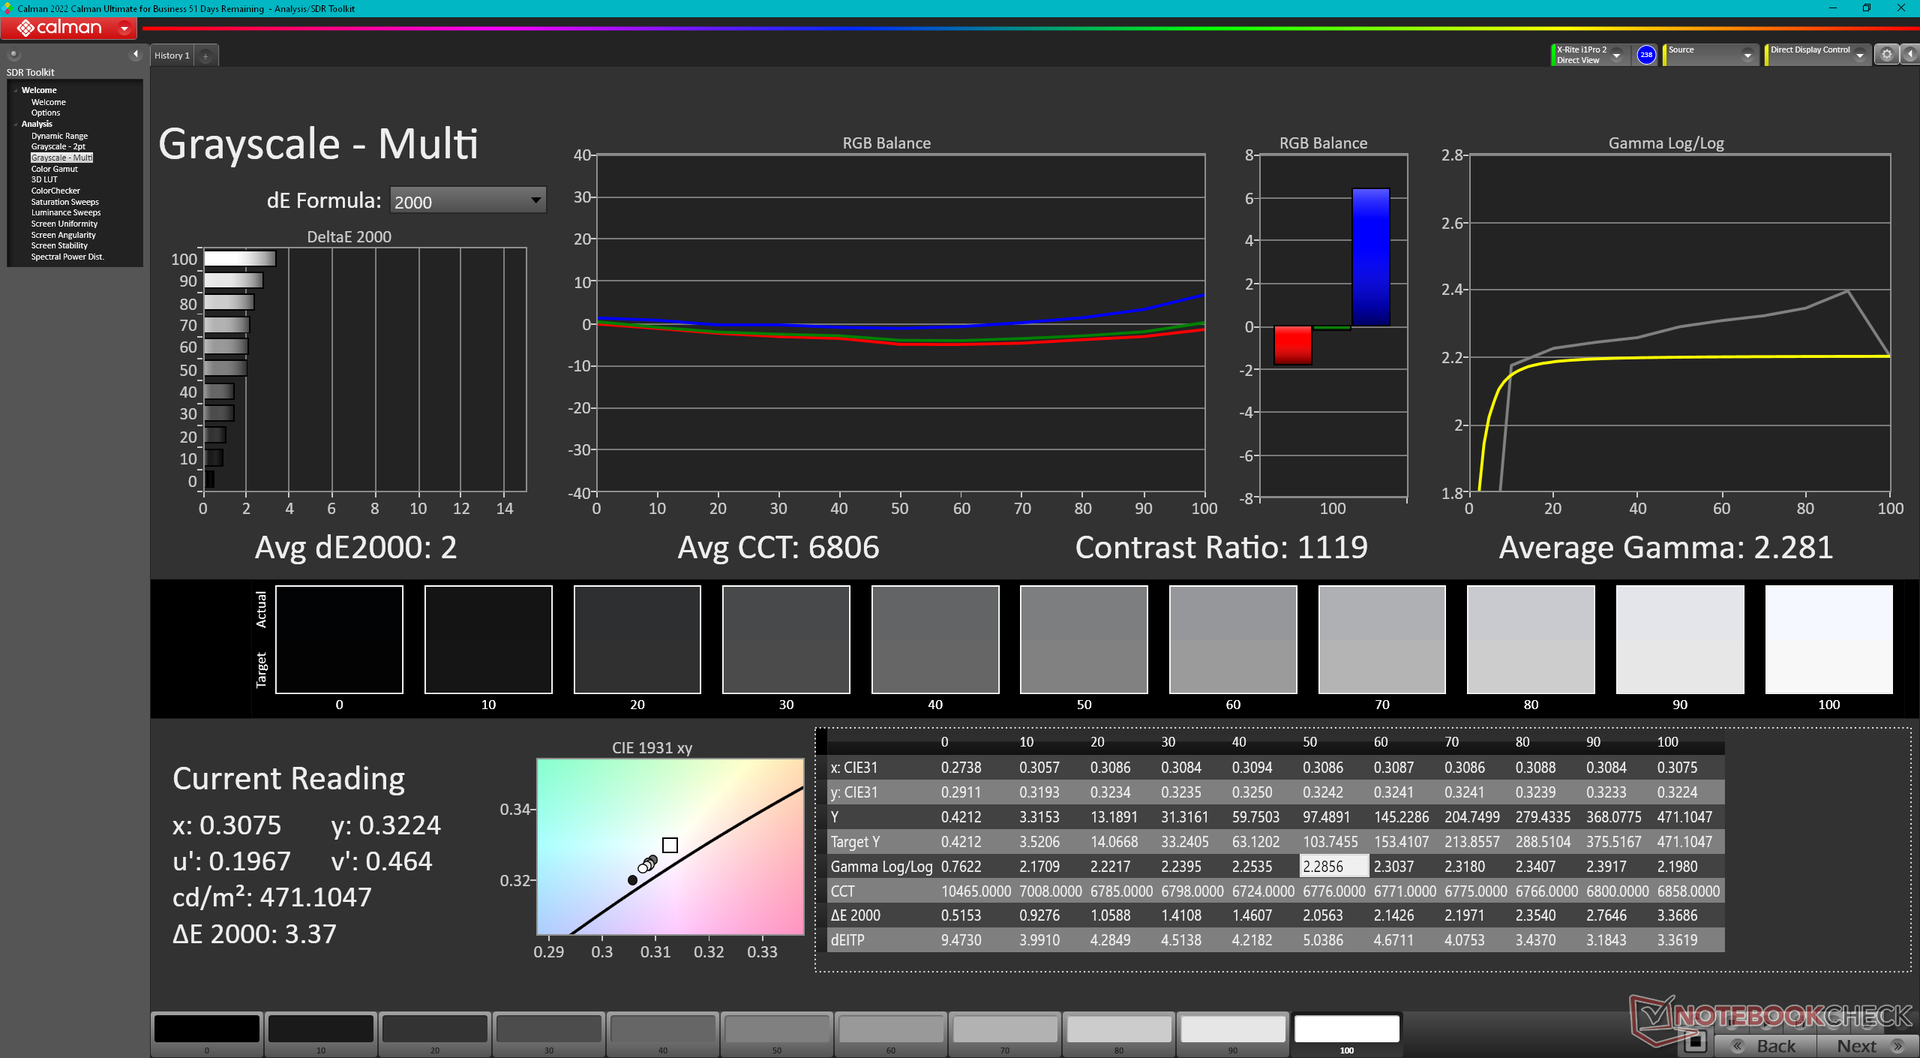
Fényerő megoszlás: 83 %
Centrumban: 457.6 cd/m²
Kontraszt: 1064:1 (Fekete: 0.43 cd/m²)
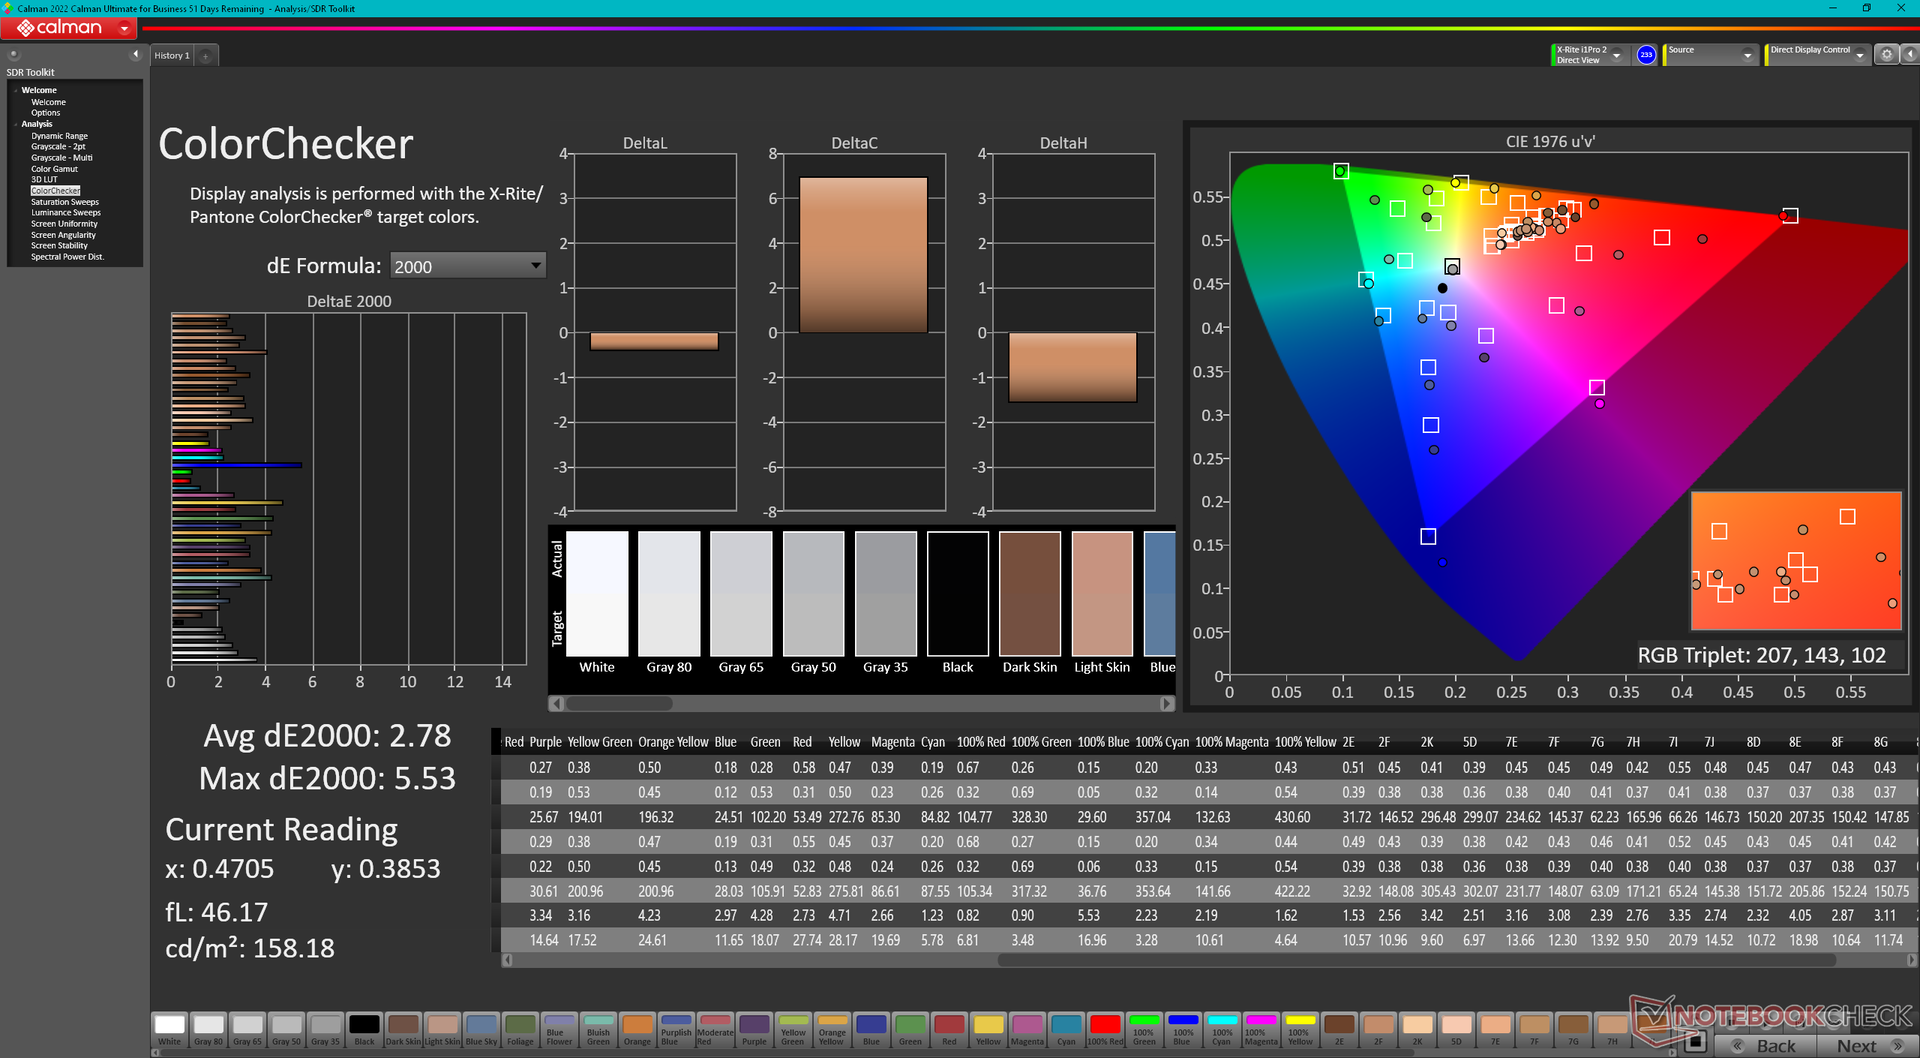
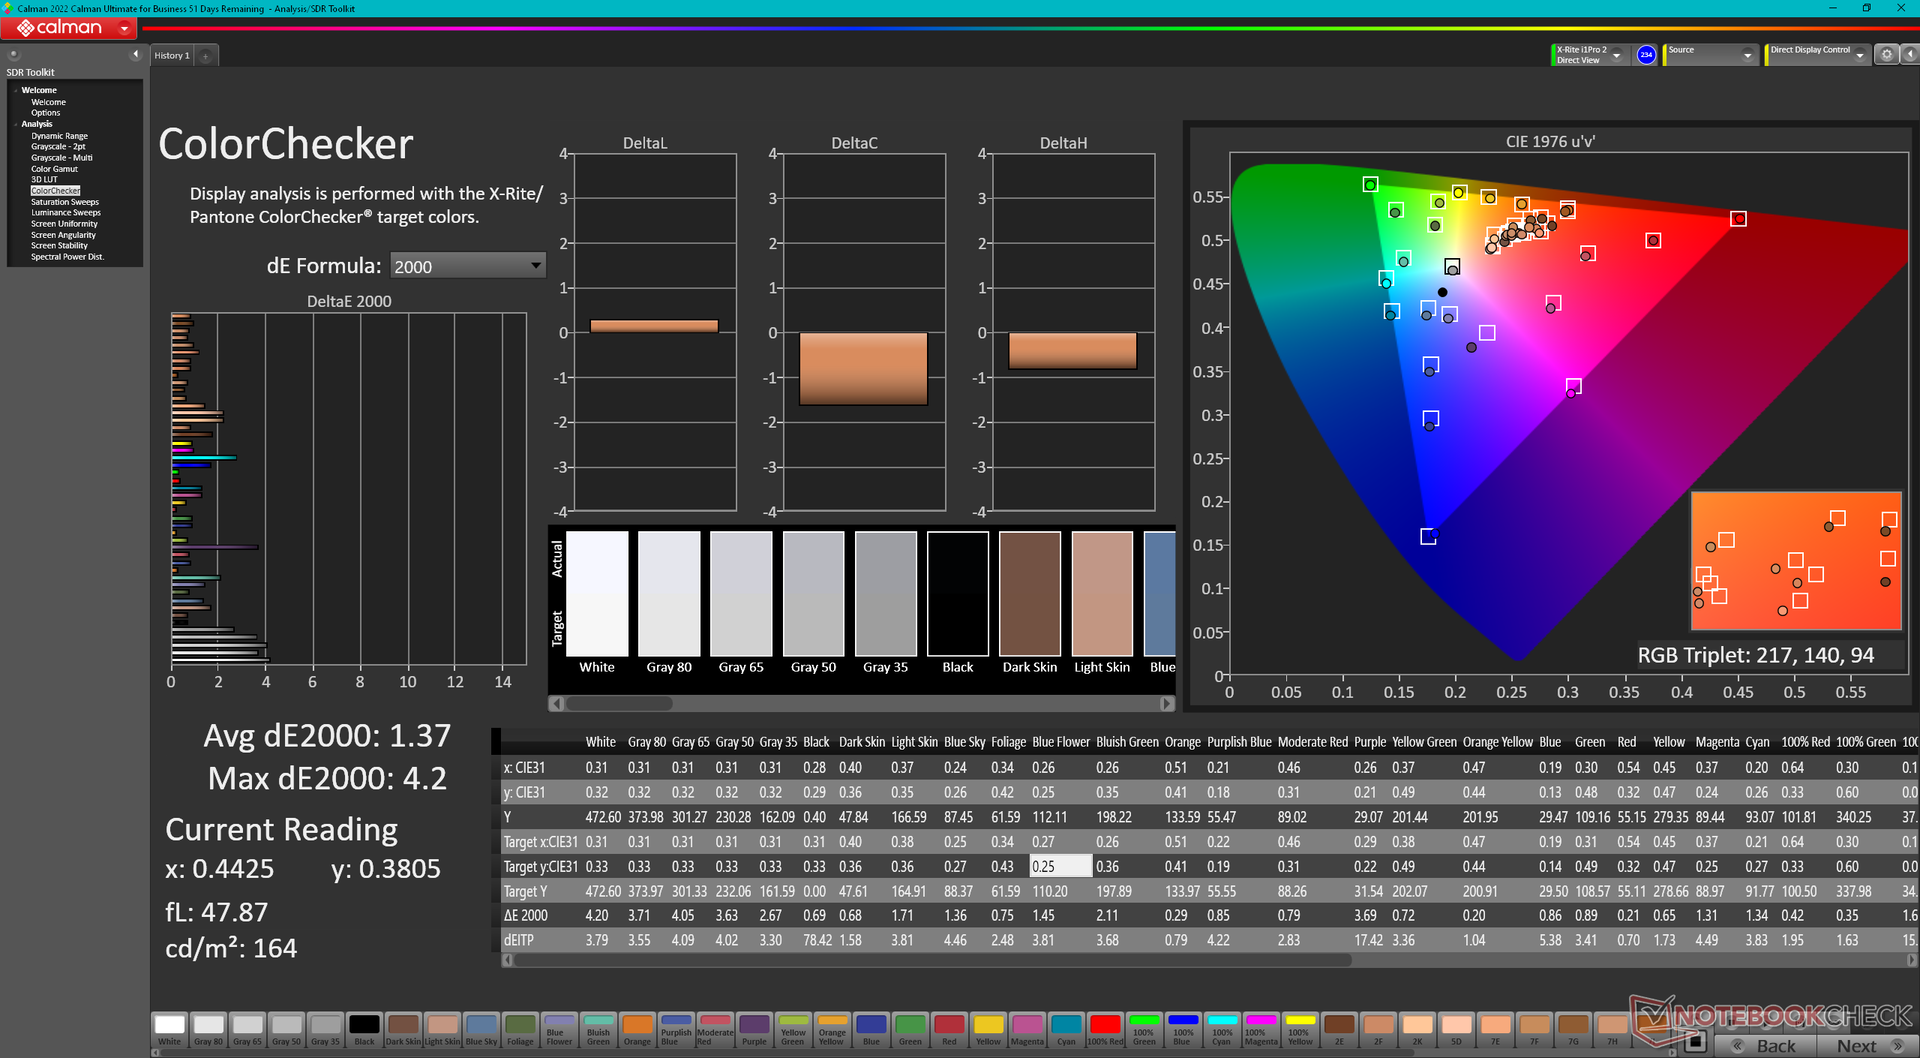
ΔE ColorChecker Calman: 2.78 | ∀{0.5-29.43 Ø4.73}
calibrated: 1.37
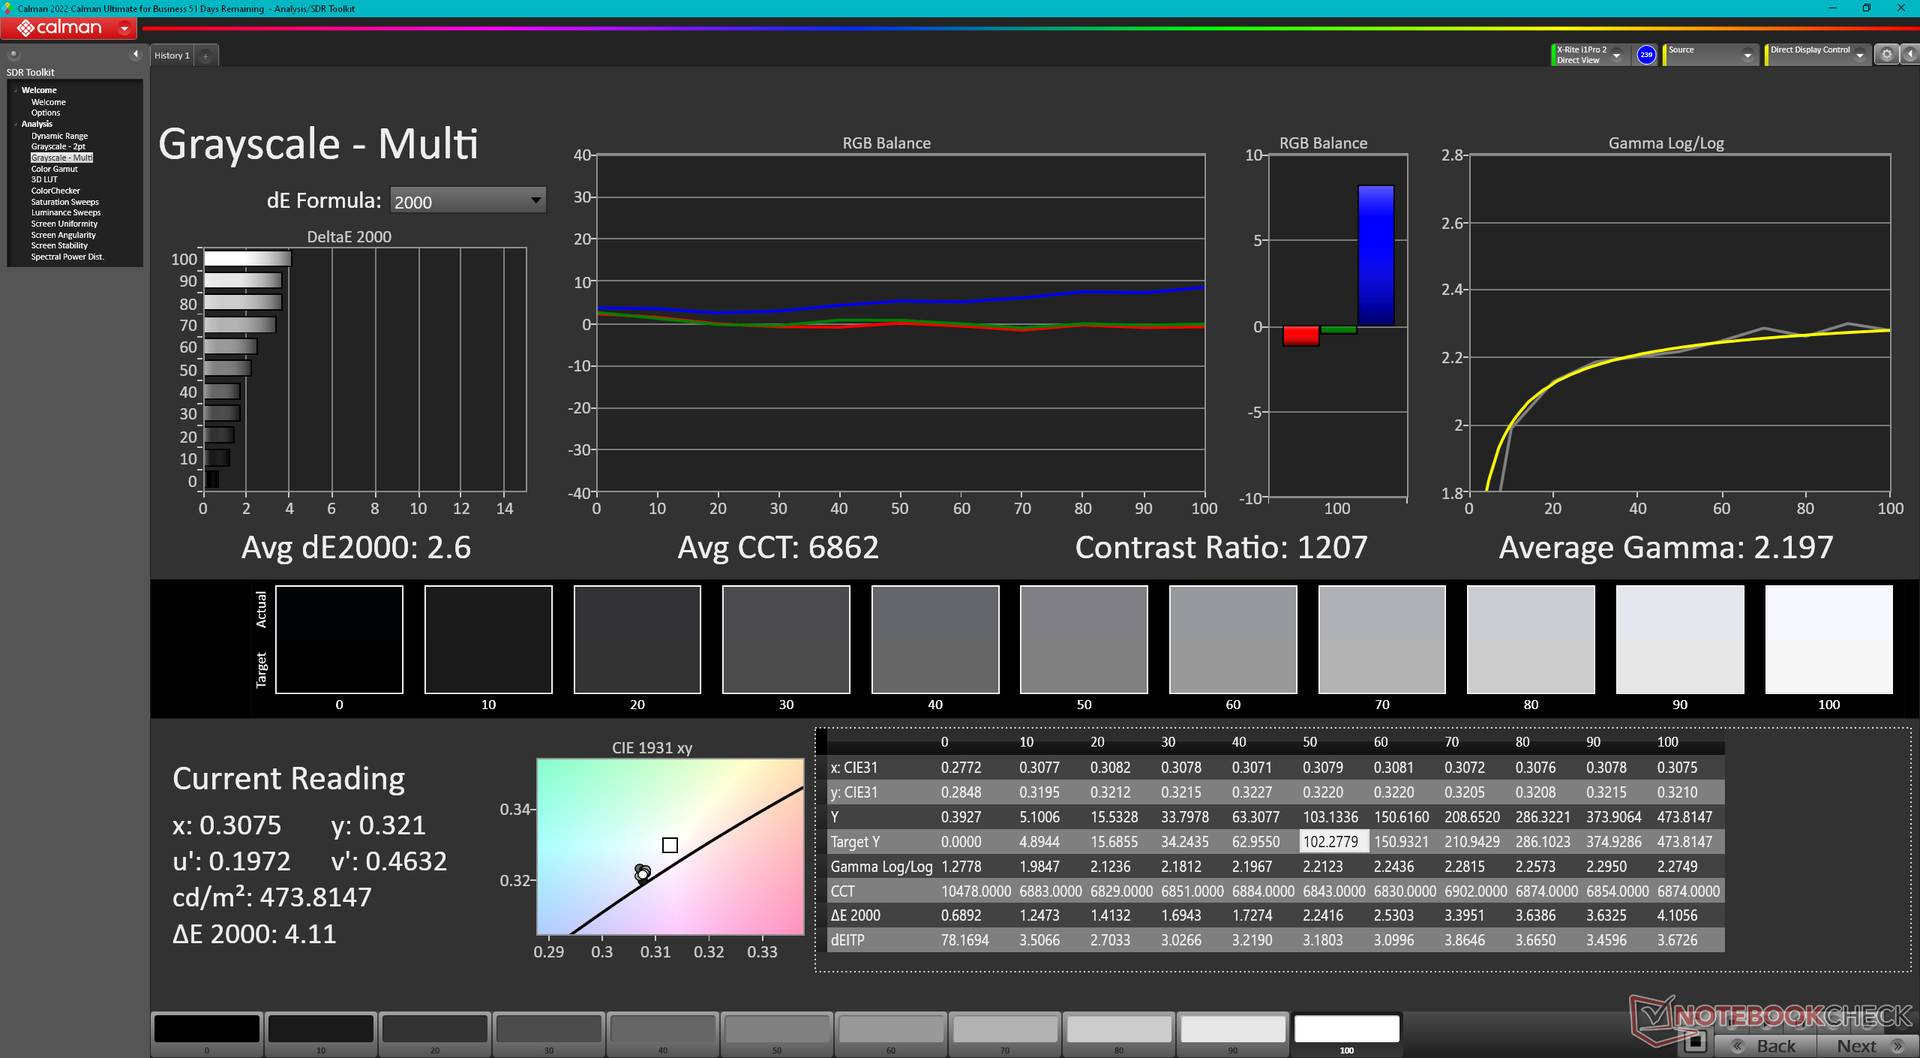
ΔE Greyscale Calman: 2 | ∀{0.09-98 Ø4.97}
86% AdobeRGB 1998 (Argyll 3D)
99.9% sRGB (Argyll 3D)
98.4% Display P3 (Argyll 3D)
Gamma: 2.28
CCT: 6806 K
| HP ZBook Fury 16 G11 AUO87A8, IPS, 3840x2400, 16", 120 Hz | HP ZBook Fury 16 G10 AUO87A8, IPS, 3840x2400, 16", 120 Hz | HP ZBook Fury 16 G9 BOE0A52, IPS, 3840x2400, 16", 60 Hz | Dell Precision 5690 Samsung 160YV03, OLED, 3840x2400, 16", 60 Hz | Lenovo ThinkPad P16 G2 21FA000FGE MNG007DA1-9, IPS LED, 2560x1600, 16", 165 Hz | Lenovo ThinkPad P1 G6 21FV001KUS Samsung ATNA60YV04-0, OLED, 3480x2400, 16", 60 Hz | Asus ProArt Studiobook 16 OLED H7604 ATNA60BX01-1, OLED, 3200x2000, 16", 120 Hz | |
|---|---|---|---|---|---|---|---|
| Display | 0% | -0% | 4% | -15% | 5% | 2% | |
| Display P3 Coverage (%) | 98.4 | 98 0% | 97.4 -1% | 99.8 1% | 71 -28% | 99.8 1% | 99.6 1% |
| sRGB Coverage (%) | 99.9 | 99.9 0% | 99.9 0% | 100 0% | 99.2 -1% | 100 0% | 100 0% |
| AdobeRGB 1998 Coverage (%) | 86 | 86.2 0% | 86.3 0% | 96.6 12% | 73.2 -15% | 97.9 14% | 89.4 4% |
| Response Times | -9% | -11% | 83% | -16% | 82% | 93% | |
| Response Time Grey 50% / Grey 80% * (ms) | 11.4 ? | 11.9 ? -4% | 13.7 ? -20% | 1.7 ? 85% | 12.8 ? -12% | 1.69 ? 85% | 0.59 ? 95% |
| Response Time Black / White * (ms) | 8.4 ? | 9.6 ? -14% | 8.6 ? -2% | 1.7 ? 80% | 10.1 ? -20% | 1.73 ? 79% | 0.79 ? 91% |
| PWM Frequency (Hz) | 60 ? | 60 ? | 240 ? | ||||
| Screen | 19% | -25% | -8% | -7% | 19% | 179% | |
| Brightness middle (cd/m²) | 457.6 | 514.6 12% | 530.5 16% | 348.1 -24% | 510 11% | 375.1 -18% | 349 -24% |
| Brightness (cd/m²) | 466 | 495 6% | 476 2% | 351 -25% | 517 11% | 379 -19% | 350 -25% |
| Brightness Distribution (%) | 83 | 90 8% | 83 0% | 97 17% | 89 7% | 98 18% | 95 14% |
| Black Level * (cd/m²) | 0.43 | 0.46 -7% | 0.57 -33% | 0.37 14% | 0.02 95% | ||
| Contrast (:1) | 1064 | 1119 5% | 931 -12% | 1378 30% | 17450 1540% | ||
| Colorchecker dE 2000 * | 2.78 | 2.4 14% | 2.26 19% | 4.18 -50% | 2.6 6% | 1.16 58% | 2.1 24% |
| Colorchecker dE 2000 max. * | 5.53 | 4.86 12% | 6.68 -21% | 5.2 6% | 2.94 47% | 5.5 1% | |
| Colorchecker dE 2000 calibrated * | 1.37 | 0.4 71% | 4.73 -245% | 0.97 29% | 2.3 -68% | 2.1 -53% | |
| Greyscale dE 2000 * | 2 | 1 50% | 1 50% | 1.7 15% | 3.6 -80% | 1.4 30% | 1.2 40% |
| Gamma | 2.28 96% | 2.3 96% | 2.28 96% | 2.2 100% | 2.26 97% | 2.2 100% | 2.19 100% |
| CCT | 6806 96% | 6553 99% | 6543 99% | 6198 105% | 5969 109% | 6325 103% | 6545 99% |
| Teljes átlag (program / beállítások) | 3% /
11% | -12% /
-17% | 26% /
10% | -13% /
-10% | 35% /
27% | 91% /
129% |
* ... a kisebb jobb
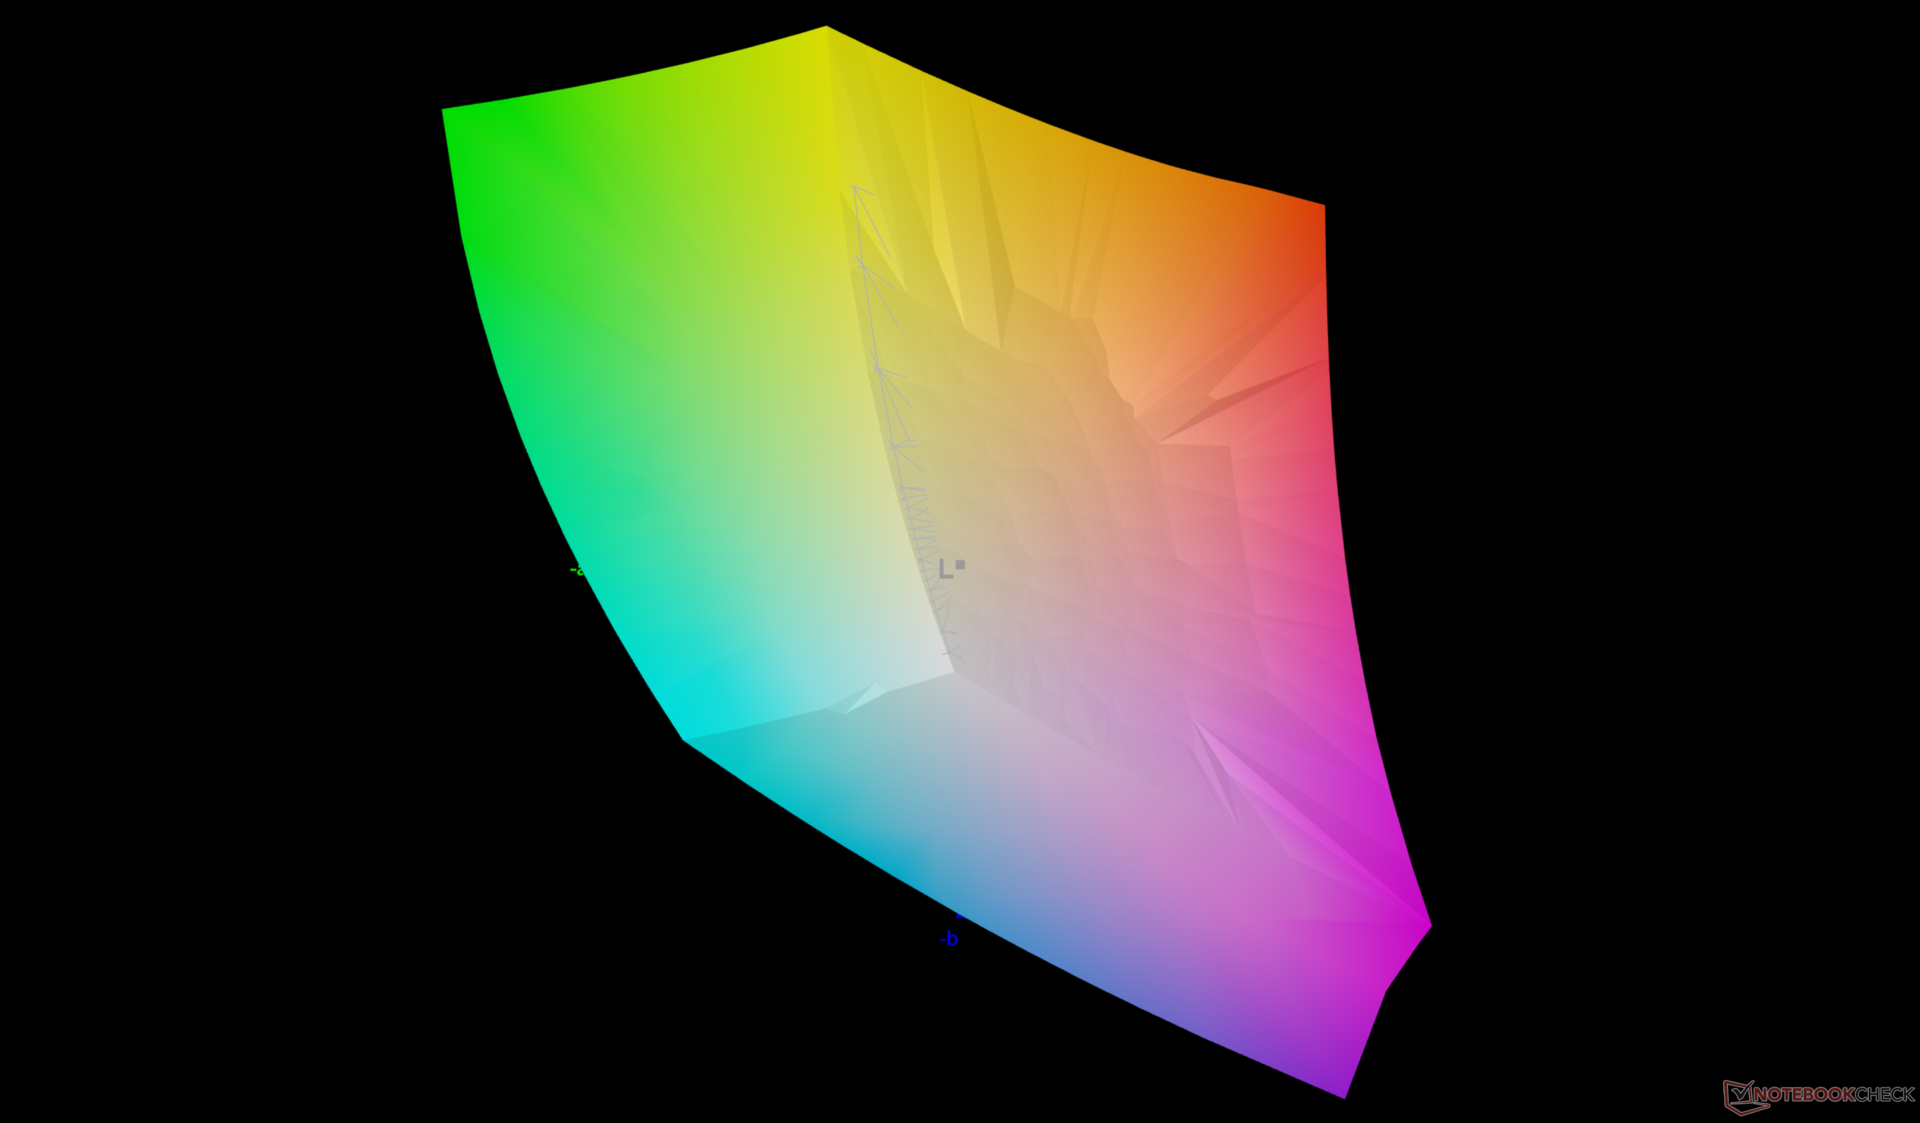
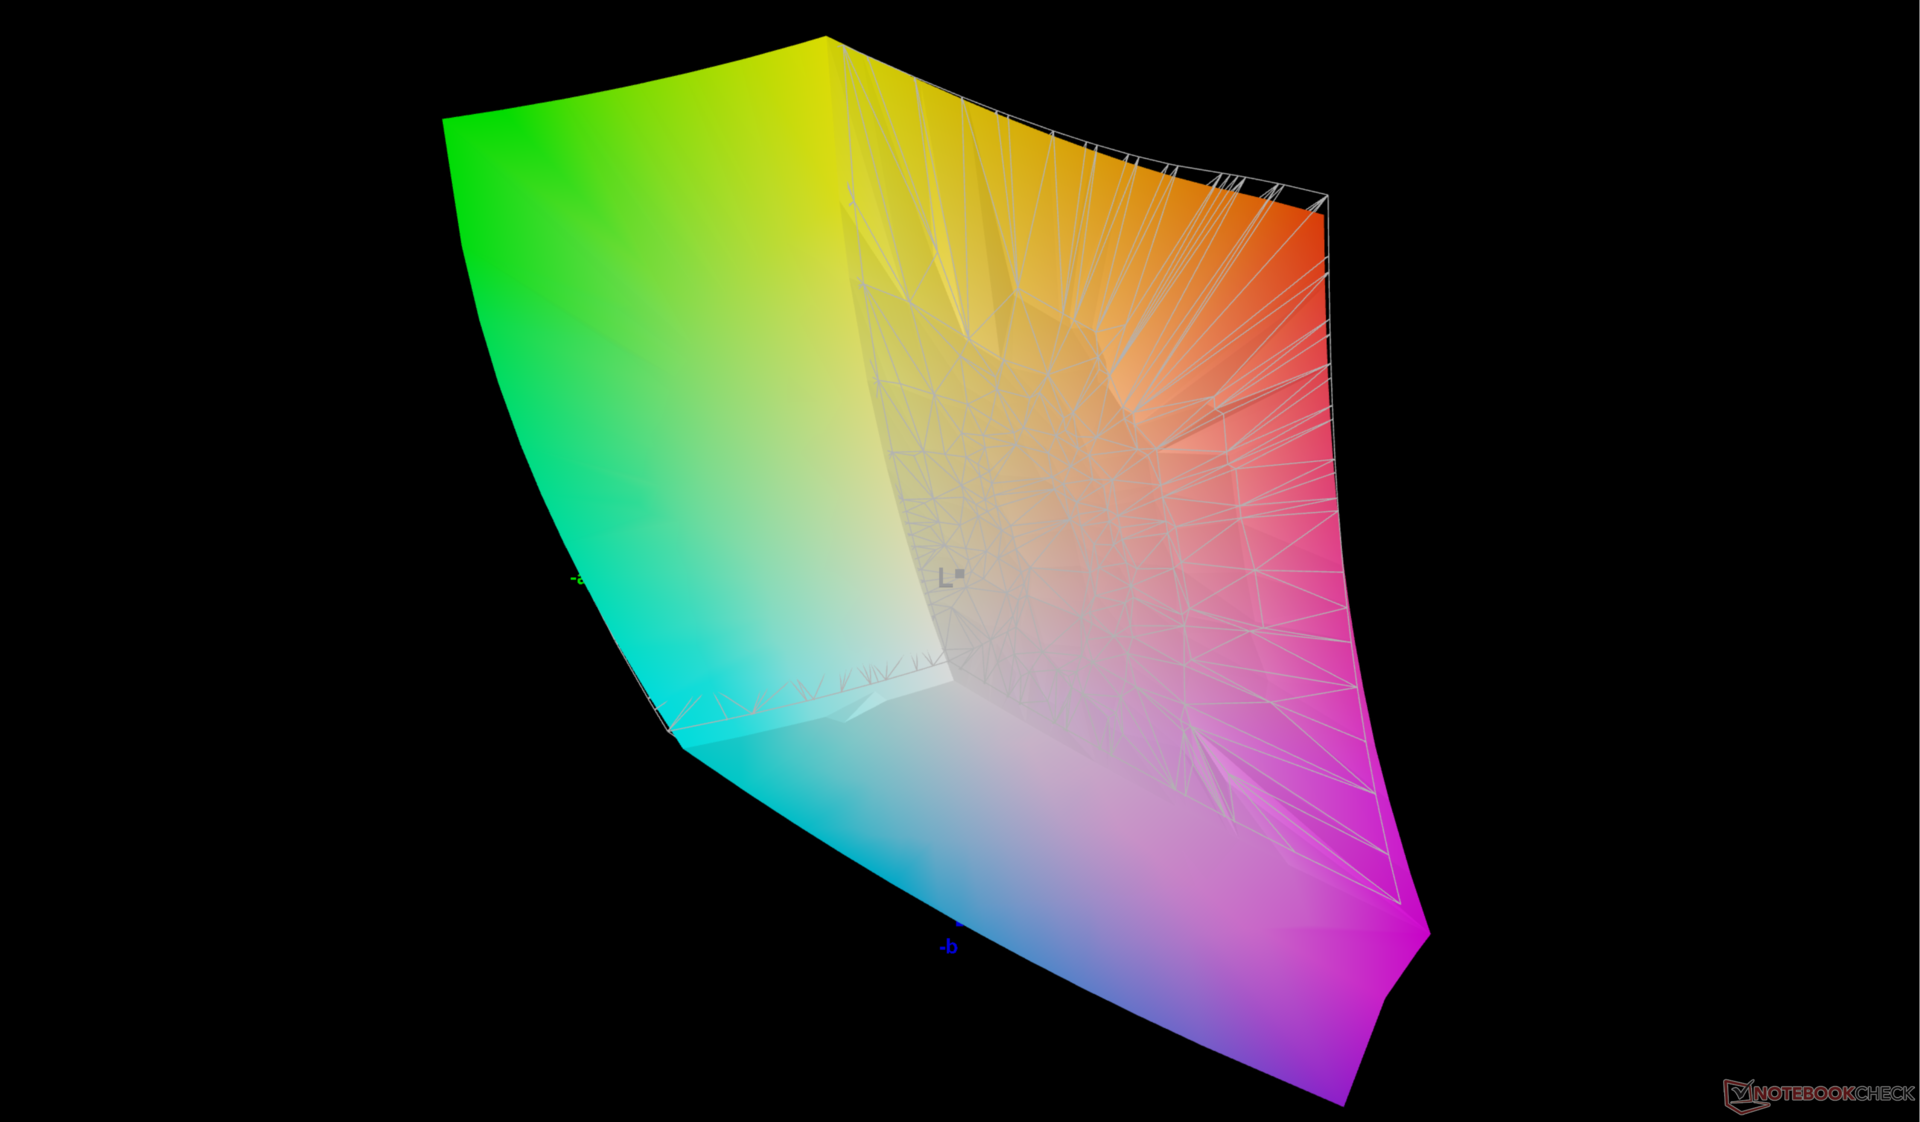
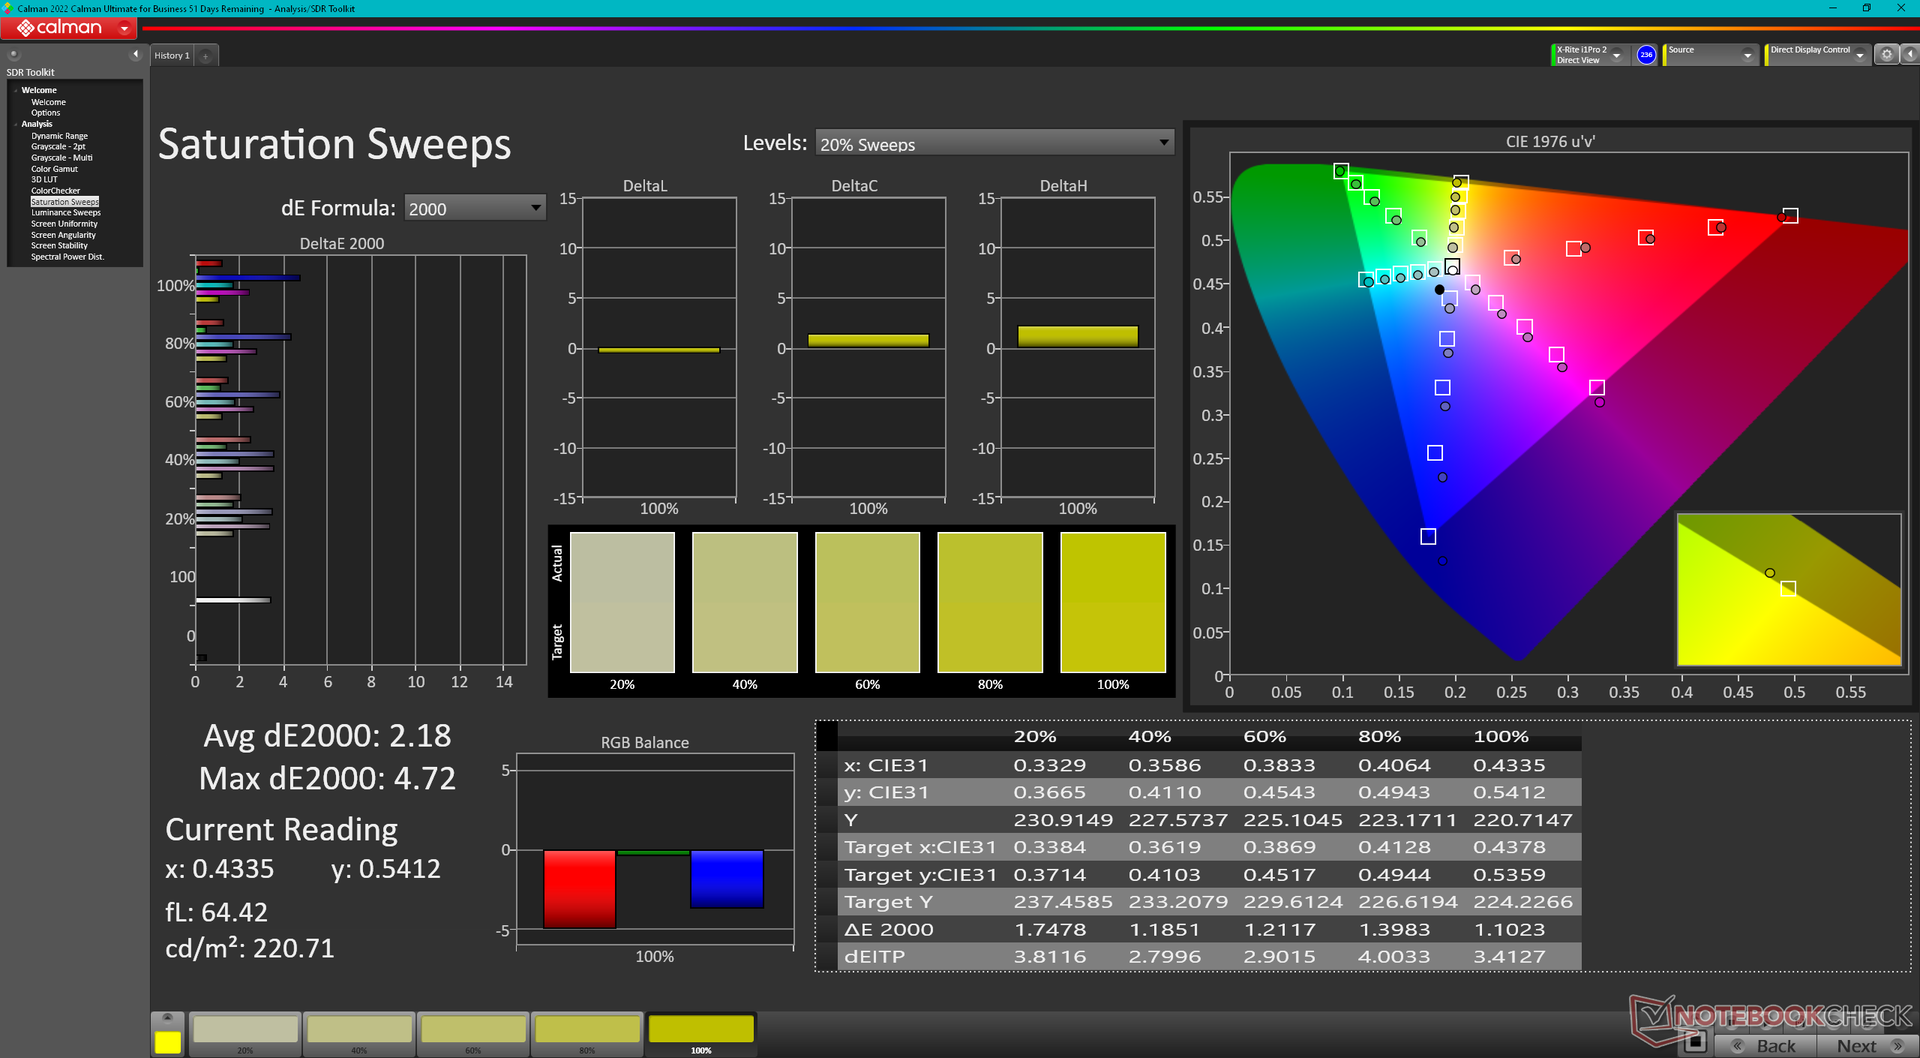
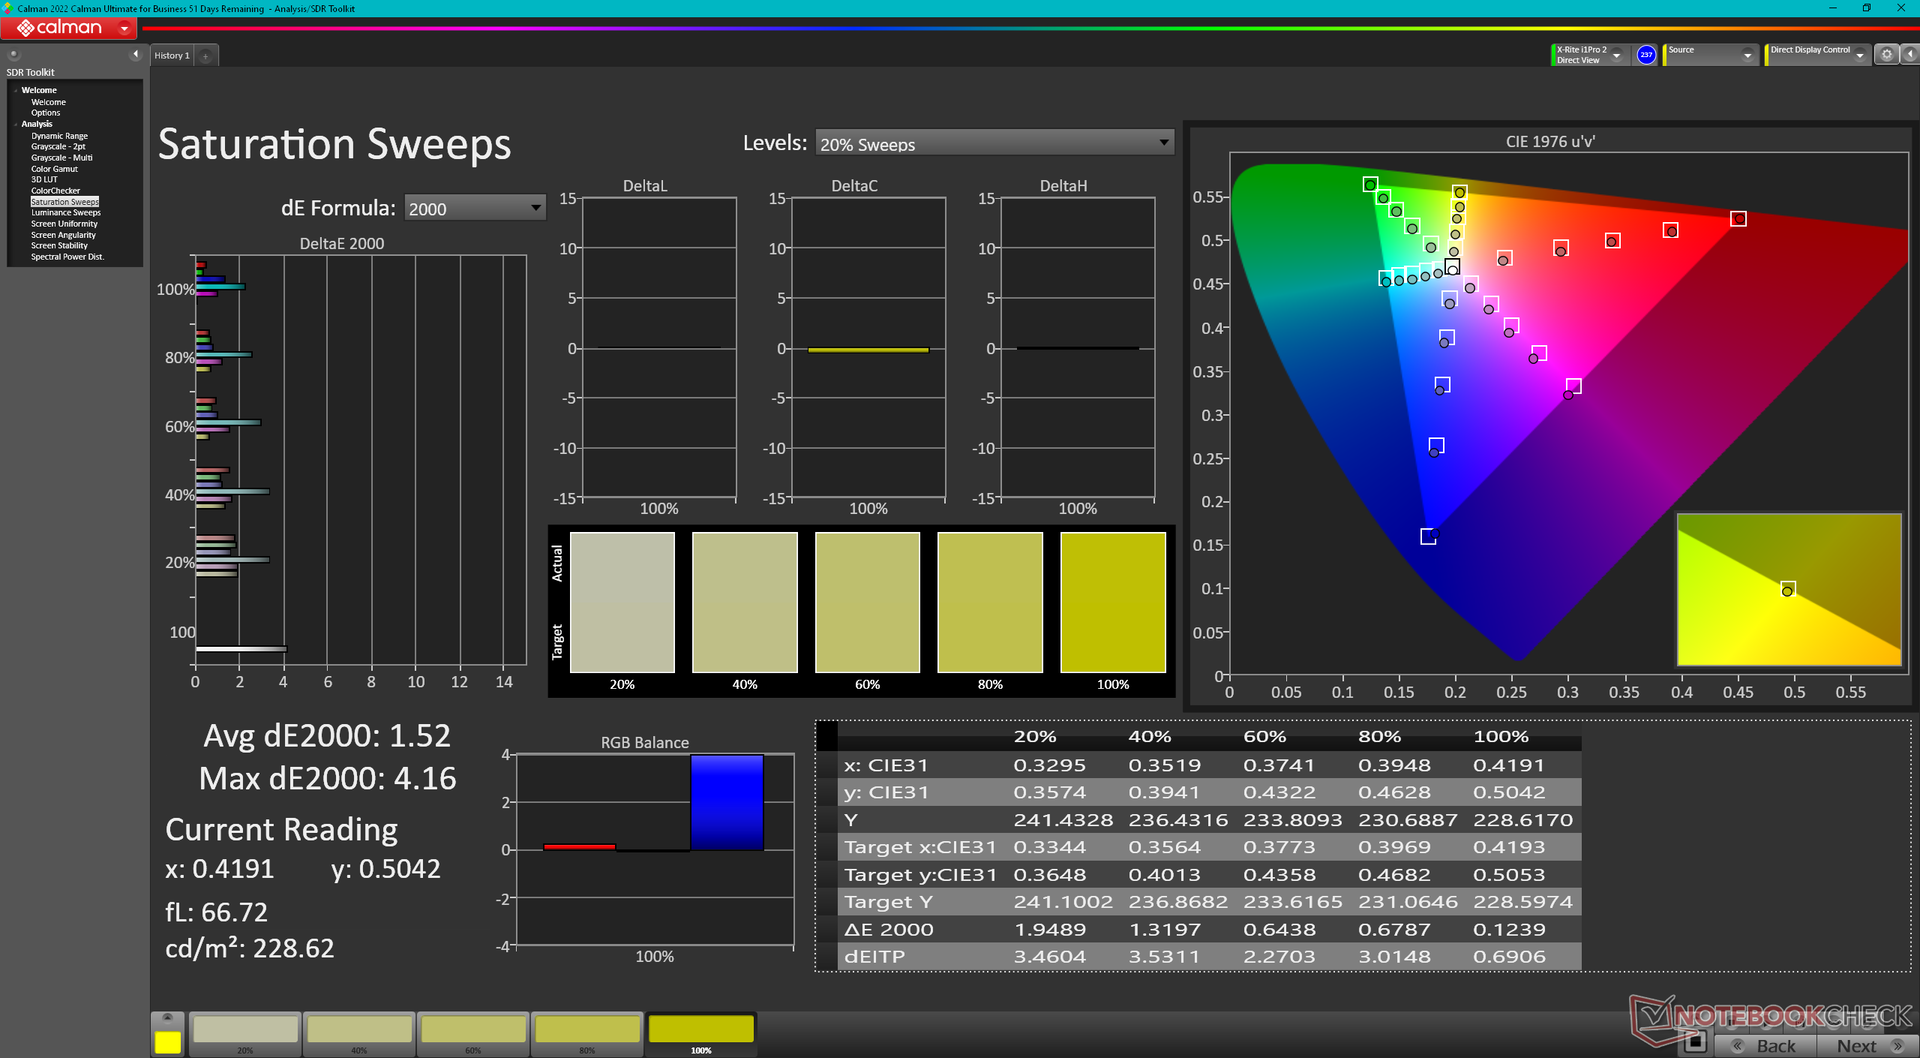
A kijelző jól kalibrált a P3 szabványhoz képest, az átlagos deltaE szürkeárnyalatos és színes értékek mindössze 2, illetve 2,18. A panel további kalibrálása az X-Rite színmérővel csak kis mértékben javítaná a pontosságot, így a legtöbb felhasználó számára többnyire szükségtelen lenne.
Megjelenítési válaszidők
| ↔ Válaszidő Fekete-fehér | ||
|---|---|---|
| 8.4 ms ... emelkedés és süllyedés ↘ kombinálva | ↗ 4.7 ms emelkedés | 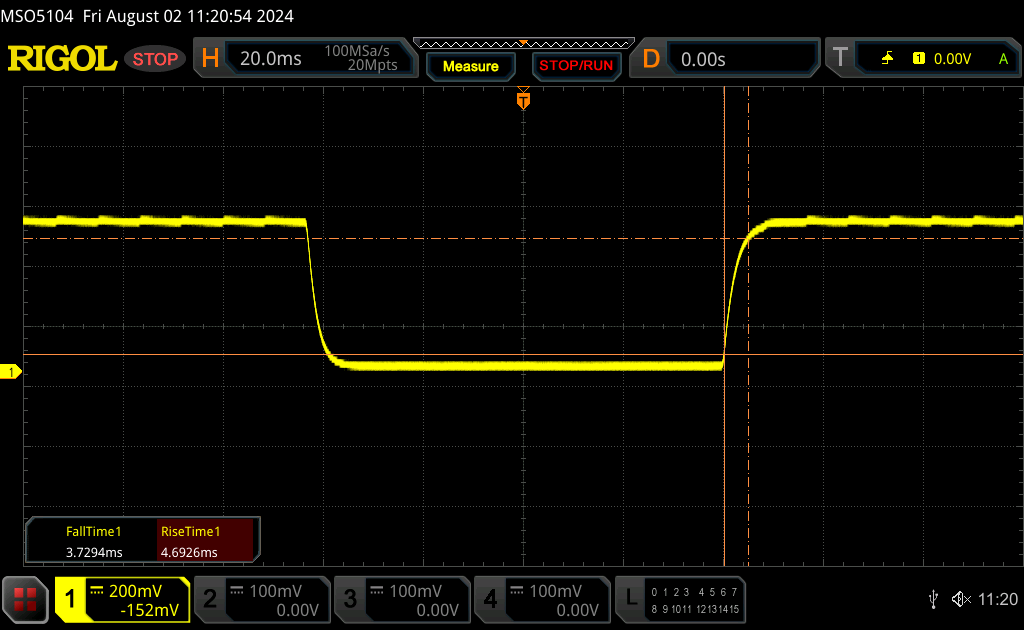 |
| ↘ 3.7 ms ősz | ||
| A képernyő gyors reakciósebességet mutat tesztjeinkben, és játékra is alkalmasnak kell lennie. Összehasonlításképpen, az összes tesztelt eszköz 0.1 (minimum) és 240 (maximum) ms között mozog. » 24 % of all devices are better. Ez azt jelenti, hogy a mért válaszidő jobb, mint az összes vizsgált eszköz átlaga (19.9 ms). | ||
| ↔ Válaszidő 50% szürke és 80% szürke között | ||
| 11.4 ms ... emelkedés és süllyedés ↘ kombinálva | ↗ 5.3 ms emelkedés | 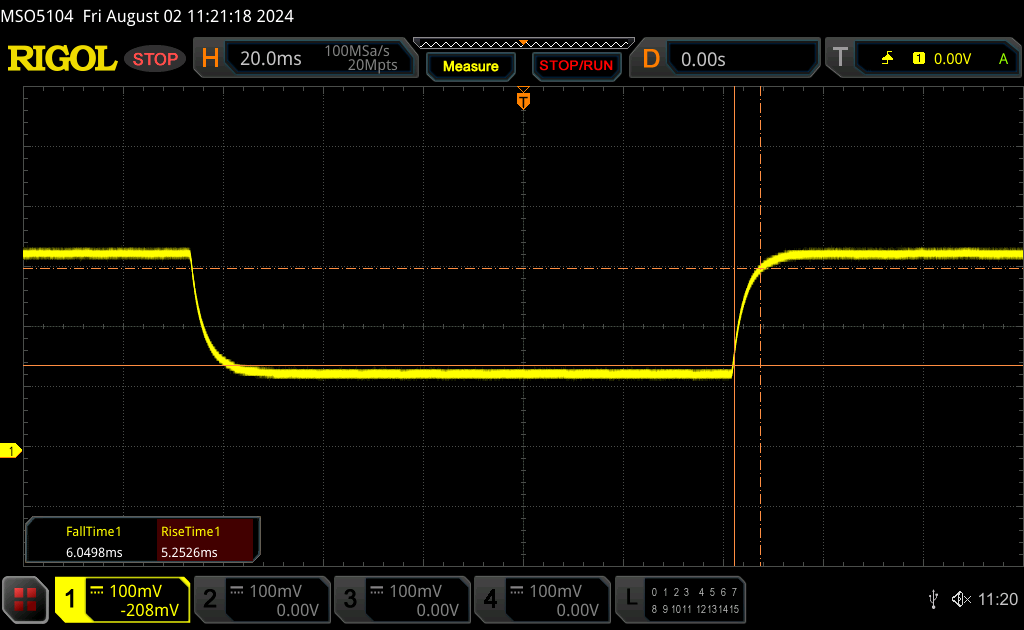 |
| ↘ 6.1 ms ősz | ||
| A képernyő jó reakciósebességet mutat tesztjeinkben, de túl lassú lehet a versenyképes játékosok számára. Összehasonlításképpen, az összes tesztelt eszköz 0.165 (minimum) és 636 (maximum) ms között mozog. » 25 % of all devices are better. Ez azt jelenti, hogy a mért válaszidő jobb, mint az összes vizsgált eszköz átlaga (31.1 ms). | ||
Képernyő villogása / PWM (impulzusszélesség-moduláció)
| Képernyő villogása / PWM nem érzékelhető | 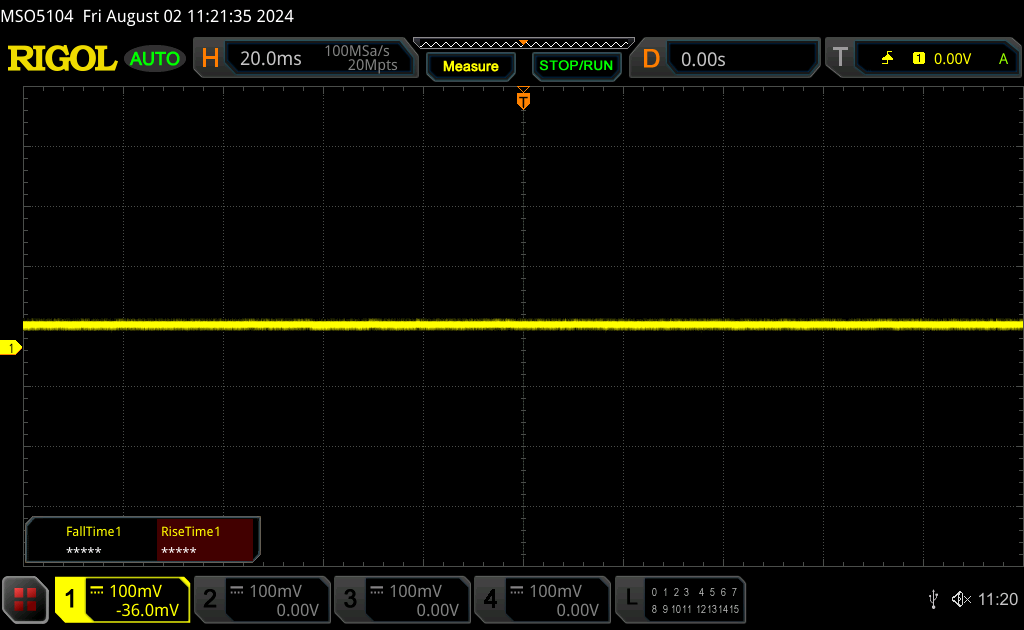 | ||
Összehasonlításképpen: az összes tesztelt eszköz 52 %-a nem használja a PWM-et a kijelző elsötétítésére. Ha PWM-et észleltek, akkor átlagosan 7784 (minimum: 5 - maximum: 343500) Hz-t mértek. | |||

Teljesítmény - Nagyobb turbófeltöltési potenciál
Vizsgálati feltételek
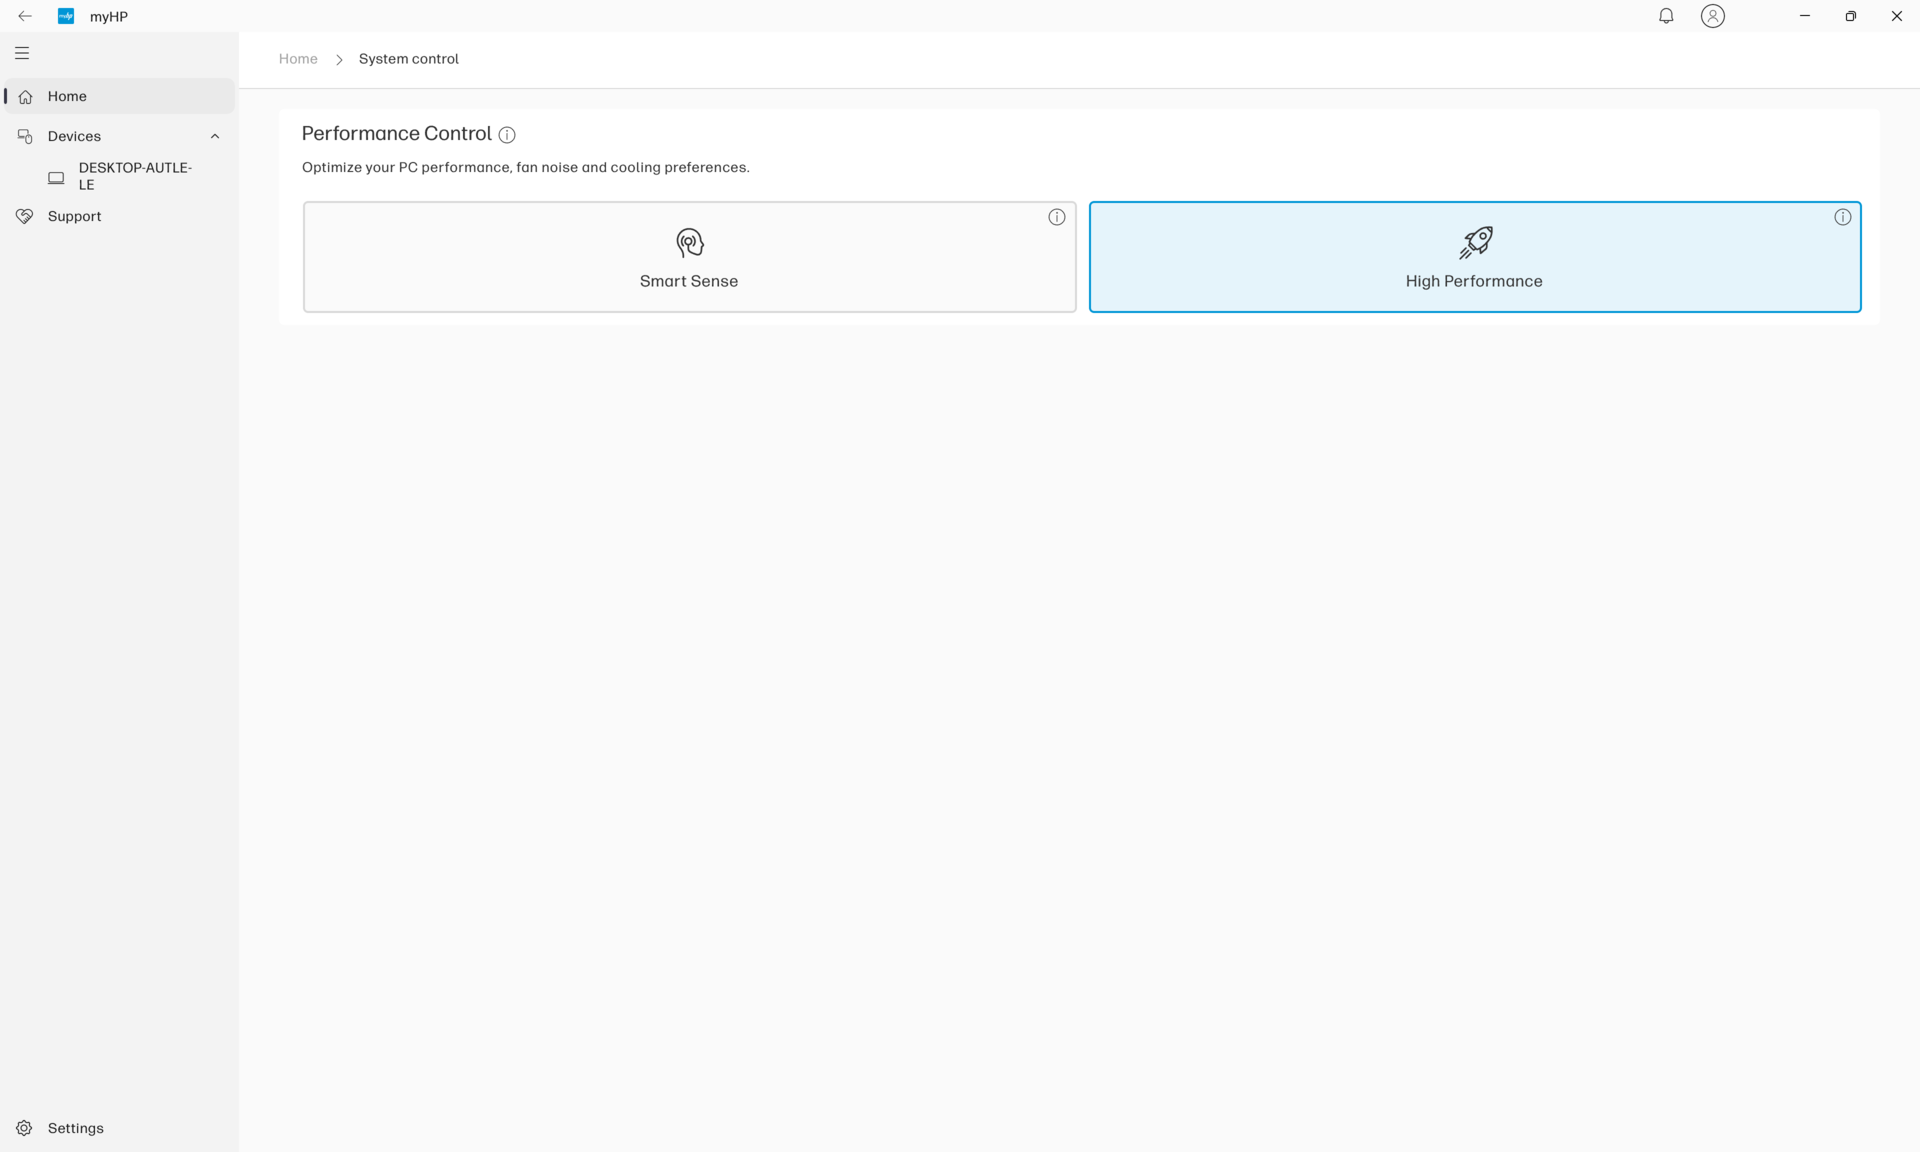
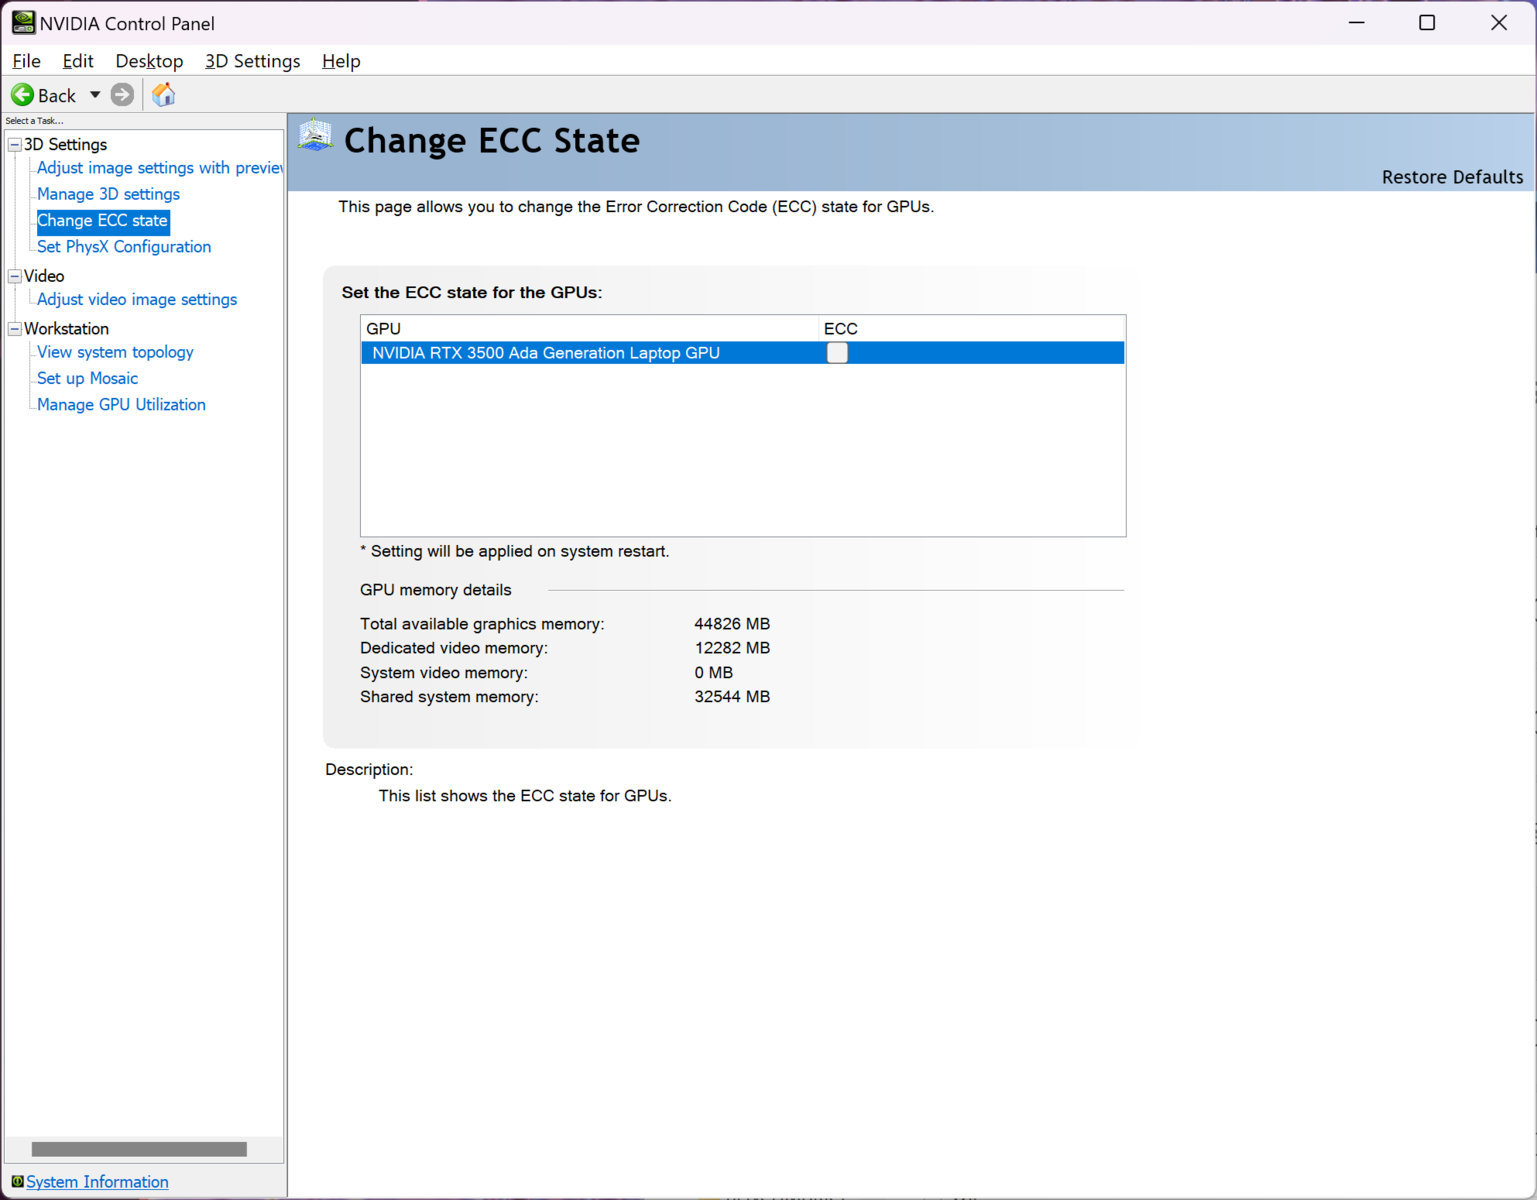
Az alábbi összehasonlító tesztek futtatása előtt a Windows és a MyHP rendszert is teljesítmény üzemmódba állítottuk. A GPU ECC üzemmódját is letiltottuk az Nvidia Control Panel segítségével.
Processzor
Ugrás a Core i9-12950HX a ZBook Fury 16 G9-ben lévő ZBook Fury 16 G9-ről a Core i9-13950HX a ZBook Fury 16 G10-ben jelentős teljesítménynövekedést hozott. Sajnos ugyanez nem mondható el a Fury 16 G10-ben lévő Core i9-13950HX-ről a ZBook Fury 16 G10-ben lévő Core i9-13950HX-re történő átugráskor Core i9-14900HX a Fury 16 G11 konfigurációnkban. A nyereség sokkal kisebb, körülbelül 10-15 százalékkal, még a fojtás figyelembevétele előtt. A throttling figyelembevétele után a processzor összteljesítménye lényegében megegyezik a Core i9-13950HX-ével, amint azt az alábbi CineBench R15 xT huroktesztünk eredményei is mutatják. A Core i9-14900HX ugyanazt a mögöttes architektúrát használja, mint a Core i9-13950HX, így a tavalyi lehetőségek újbóli bevezetésének tekinthető. Így a magasabb Turbo Boost felső határ a fő előnye a kifutó processzorral szemben, még akkor is, ha ezek a magasabb Turbo Boost sebességek rövid életűek.
A Lenovo Legion 9 16IRX9, amely ugyanazt a Core i9-14900HX-et kapja, mint a HP-nk, akár 20 százalékkal gyorsabban is működne, valószínűleg a magasabb Turbo Boost órajelek fenntartására alkalmasabb hűtési megoldásának köszönhetően.
Cinebench R15 Multi Loop
Cinebench R23: Multi Core | Single Core
Cinebench R20: CPU (Multi Core) | CPU (Single Core)
Cinebench R15: CPU Multi 64Bit | CPU Single 64Bit
Blender: v2.79 BMW27 CPU
7-Zip 18.03: 7z b 4 | 7z b 4 -mmt1
Geekbench 6.7: Multi-Core | Single-Core
Geekbench 5.5: Multi-Core | Single-Core
HWBOT x265 Benchmark v2.2: 4k Preset
LibreOffice : 20 Documents To PDF
R Benchmark 2.5: Overall mean
| CPU Performance rating | |
| Asus ProArt Studiobook 16 OLED H7604 -2! | |
| Átlagos Intel Core i9-14900HX | |
| HP ZBook Fury 16 G11 | |
| HP ZBook Fury 16 G10 | |
| Dell Precision 5000 5680 | |
| Lenovo ThinkPad P1 G6 21FV001KUS | |
| Asus ExpertBook B6 Flip B6602FC2 -2! | |
| Lenovo ThinkPad P16 G2 21FA000FGE -2! | |
| Lenovo ThinkPad P1 G6-21FV000DGE | |
| Dell Precision 5690 | |
| HP ZBook Fury 16 G9 -2! | |
| MSI CreatorPro Z16P B12UKST -2! | |
| Lenovo ThinkPad P16v G1 AMD | |
| Lenovo ThinkPad P1 G4-20Y4S0KS00 -2! | |
| Cinebench R23 / Multi Core | |
| Asus ProArt Studiobook 16 OLED H7604 | |
| Átlagos Intel Core i9-14900HX (17078 - 36249, n=37) | |
| HP ZBook Fury 16 G11 | |
| HP ZBook Fury 16 G10 | |
| Lenovo ThinkPad P16 G2 21FA000FGE | |
| Asus ExpertBook B6 Flip B6602FC2 | |
| Dell Precision 5690 | |
| HP ZBook Fury 16 G9 | |
| Dell Precision 5000 5680 | |
| Lenovo ThinkPad P1 G6-21FV000DGE | |
| Lenovo ThinkPad P1 G6 21FV001KUS | |
| MSI CreatorPro Z16P B12UKST | |
| Lenovo ThinkPad P16v G1 AMD | |
| Lenovo ThinkPad P1 G4-20Y4S0KS00 | |
| Cinebench R23 / Single Core | |
| HP ZBook Fury 16 G11 | |
| Átlagos Intel Core i9-14900HX (1720 - 2245, n=37) | |
| Asus ProArt Studiobook 16 OLED H7604 | |
| HP ZBook Fury 16 G10 | |
| Lenovo ThinkPad P1 G6-21FV000DGE | |
| Dell Precision 5000 5680 | |
| Lenovo ThinkPad P1 G6 21FV001KUS | |
| HP ZBook Fury 16 G9 | |
| Lenovo ThinkPad P16 G2 21FA000FGE | |
| Asus ExpertBook B6 Flip B6602FC2 | |
| Dell Precision 5690 | |
| MSI CreatorPro Z16P B12UKST | |
| Lenovo ThinkPad P16v G1 AMD | |
| Lenovo ThinkPad P1 G4-20Y4S0KS00 | |
| Cinebench R20 / CPU (Multi Core) | |
| Asus ProArt Studiobook 16 OLED H7604 | |
| Átlagos Intel Core i9-14900HX (6579 - 13832, n=37) | |
| HP ZBook Fury 16 G11 | |
| HP ZBook Fury 16 G10 | |
| Asus ExpertBook B6 Flip B6602FC2 | |
| Lenovo ThinkPad P16 G2 21FA000FGE | |
| Dell Precision 5690 | |
| HP ZBook Fury 16 G9 | |
| Dell Precision 5000 5680 | |
| Lenovo ThinkPad P1 G6-21FV000DGE | |
| MSI CreatorPro Z16P B12UKST | |
| Lenovo ThinkPad P1 G6 21FV001KUS | |
| Lenovo ThinkPad P16v G1 AMD | |
| Lenovo ThinkPad P1 G4-20Y4S0KS00 | |
| Cinebench R20 / CPU (Single Core) | |
| HP ZBook Fury 16 G11 | |
| Átlagos Intel Core i9-14900HX (657 - 859, n=37) | |
| HP ZBook Fury 16 G10 | |
| Asus ProArt Studiobook 16 OLED H7604 | |
| Lenovo ThinkPad P1 G6-21FV000DGE | |
| Dell Precision 5000 5680 | |
| Lenovo ThinkPad P1 G6 21FV001KUS | |
| HP ZBook Fury 16 G9 | |
| Asus ExpertBook B6 Flip B6602FC2 | |
| Lenovo ThinkPad P16 G2 21FA000FGE | |
| Dell Precision 5690 | |
| MSI CreatorPro Z16P B12UKST | |
| Lenovo ThinkPad P16v G1 AMD | |
| Lenovo ThinkPad P1 G4-20Y4S0KS00 | |
| Cinebench R15 / CPU Multi 64Bit | |
| Asus ProArt Studiobook 16 OLED H7604 | |
| Átlagos Intel Core i9-14900HX (3263 - 5589, n=38) | |
| HP ZBook Fury 16 G11 | |
| HP ZBook Fury 16 G10 | |
| Asus ExpertBook B6 Flip B6602FC2 | |
| Dell Precision 5690 | |
| Lenovo ThinkPad P16 G2 21FA000FGE | |
| Lenovo ThinkPad P1 G6 21FV001KUS | |
| Lenovo ThinkPad P1 G6-21FV000DGE | |
| HP ZBook Fury 16 G9 | |
| Lenovo ThinkPad P16v G1 AMD | |
| Dell Precision 5000 5680 | |
| MSI CreatorPro Z16P B12UKST | |
| Lenovo ThinkPad P1 G4-20Y4S0KS00 | |
| Cinebench R15 / CPU Single 64Bit | |
| Asus ProArt Studiobook 16 OLED H7604 | |
| Átlagos Intel Core i9-14900HX (247 - 323, n=37) | |
| HP ZBook Fury 16 G10 | |
| HP ZBook Fury 16 G11 | |
| Dell Precision 5000 5680 | |
| Lenovo ThinkPad P1 G6-21FV000DGE | |
| Lenovo ThinkPad P1 G6 21FV001KUS | |
| Lenovo ThinkPad P16 G2 21FA000FGE | |
| Asus ExpertBook B6 Flip B6602FC2 | |
| Dell Precision 5690 | |
| Lenovo ThinkPad P16v G1 AMD | |
| MSI CreatorPro Z16P B12UKST | |
| Lenovo ThinkPad P1 G4-20Y4S0KS00 | |
| HP ZBook Fury 16 G9 | |
| Blender / v2.79 BMW27 CPU | |
| Lenovo ThinkPad P1 G4-20Y4S0KS00 | |
| Dell Precision 5690 | |
| Lenovo ThinkPad P16v G1 AMD | |
| MSI CreatorPro Z16P B12UKST | |
| Dell Precision 5000 5680 | |
| Lenovo ThinkPad P1 G6-21FV000DGE | |
| Lenovo ThinkPad P1 G6 21FV001KUS | |
| Asus ExpertBook B6 Flip B6602FC2 | |
| HP ZBook Fury 16 G9 | |
| Lenovo ThinkPad P16 G2 21FA000FGE | |
| HP ZBook Fury 16 G10 | |
| HP ZBook Fury 16 G11 | |
| Átlagos Intel Core i9-14900HX (91 - 206, n=37) | |
| Asus ProArt Studiobook 16 OLED H7604 | |
| 7-Zip 18.03 / 7z b 4 | |
| Asus ProArt Studiobook 16 OLED H7604 | |
| Átlagos Intel Core i9-14900HX (66769 - 136645, n=37) | |
| HP ZBook Fury 16 G11 | |
| HP ZBook Fury 16 G10 | |
| Lenovo ThinkPad P16 G2 21FA000FGE | |
| HP ZBook Fury 16 G9 | |
| Dell Precision 5690 | |
| Asus ExpertBook B6 Flip B6602FC2 | |
| Lenovo ThinkPad P1 G6-21FV000DGE | |
| Lenovo ThinkPad P1 G6 21FV001KUS | |
| Dell Precision 5000 5680 | |
| MSI CreatorPro Z16P B12UKST | |
| Lenovo ThinkPad P16v G1 AMD | |
| Lenovo ThinkPad P1 G4-20Y4S0KS00 | |
| 7-Zip 18.03 / 7z b 4 -mmt1 | |
| Asus ProArt Studiobook 16 OLED H7604 | |
| Átlagos Intel Core i9-14900HX (5452 - 7545, n=37) | |
| HP ZBook Fury 16 G11 | |
| HP ZBook Fury 16 G10 | |
| Lenovo ThinkPad P1 G6-21FV000DGE | |
| Lenovo ThinkPad P16v G1 AMD | |
| Lenovo ThinkPad P16 G2 21FA000FGE | |
| Lenovo ThinkPad P1 G6 21FV001KUS | |
| Asus ExpertBook B6 Flip B6602FC2 | |
| Dell Precision 5000 5680 | |
| HP ZBook Fury 16 G9 | |
| MSI CreatorPro Z16P B12UKST | |
| Lenovo ThinkPad P1 G4-20Y4S0KS00 | |
| Dell Precision 5690 | |
| Geekbench 6.7 / Multi-Core | |
| Átlagos Intel Core i9-14900HX (13158 - 19665, n=37) | |
| HP ZBook Fury 16 G10 | |
| HP ZBook Fury 16 G11 | |
| Dell Precision 5000 5680 | |
| Dell Precision 5690 | |
| Lenovo ThinkPad P1 G6 21FV001KUS | |
| Lenovo ThinkPad P1 G6-21FV000DGE | |
| Lenovo ThinkPad P16v G1 AMD | |
| Geekbench 6.7 / Single-Core | |
| Átlagos Intel Core i9-14900HX (2419 - 3129, n=37) | |
| HP ZBook Fury 16 G10 | |
| HP ZBook Fury 16 G11 | |
| Lenovo ThinkPad P1 G6 21FV001KUS | |
| Lenovo ThinkPad P1 G6-21FV000DGE | |
| Dell Precision 5000 5680 | |
| Lenovo ThinkPad P16v G1 AMD | |
| Dell Precision 5690 | |
| Geekbench 5.5 / Multi-Core | |
| Asus ProArt Studiobook 16 OLED H7604 | |
| Átlagos Intel Core i9-14900HX (8618 - 23194, n=37) | |
| HP ZBook Fury 16 G11 | |
| HP ZBook Fury 16 G10 | |
| Asus ExpertBook B6 Flip B6602FC2 | |
| Dell Precision 5000 5680 | |
| Lenovo ThinkPad P16 G2 21FA000FGE | |
| Dell Precision 5690 | |
| HP ZBook Fury 16 G9 | |
| Lenovo ThinkPad P1 G6 21FV001KUS | |
| MSI CreatorPro Z16P B12UKST | |
| Lenovo ThinkPad P1 G6-21FV000DGE | |
| Lenovo ThinkPad P16v G1 AMD | |
| Lenovo ThinkPad P1 G4-20Y4S0KS00 | |
| Geekbench 5.5 / Single-Core | |
| Asus ProArt Studiobook 16 OLED H7604 | |
| HP ZBook Fury 16 G10 | |
| Átlagos Intel Core i9-14900HX (1669 - 2210, n=37) | |
| Dell Precision 5000 5680 | |
| HP ZBook Fury 16 G11 | |
| Lenovo ThinkPad P1 G6 21FV001KUS | |
| Lenovo ThinkPad P1 G6-21FV000DGE | |
| HP ZBook Fury 16 G9 | |
| Asus ExpertBook B6 Flip B6602FC2 | |
| Lenovo ThinkPad P16 G2 21FA000FGE | |
| Dell Precision 5690 | |
| Lenovo ThinkPad P16v G1 AMD | |
| MSI CreatorPro Z16P B12UKST | |
| Lenovo ThinkPad P1 G4-20Y4S0KS00 | |
| HWBOT x265 Benchmark v2.2 / 4k Preset | |
| Asus ProArt Studiobook 16 OLED H7604 | |
| Átlagos Intel Core i9-14900HX (16.8 - 38.9, n=37) | |
| HP ZBook Fury 16 G11 | |
| HP ZBook Fury 16 G10 | |
| Lenovo ThinkPad P16 G2 21FA000FGE | |
| Dell Precision 5690 | |
| Asus ExpertBook B6 Flip B6602FC2 | |
| Dell Precision 5000 5680 | |
| Lenovo ThinkPad P1 G6 21FV001KUS | |
| HP ZBook Fury 16 G9 | |
| MSI CreatorPro Z16P B12UKST | |
| Lenovo ThinkPad P1 G6-21FV000DGE | |
| Lenovo ThinkPad P16v G1 AMD | |
| Lenovo ThinkPad P1 G4-20Y4S0KS00 | |
| LibreOffice / 20 Documents To PDF | |
| Lenovo ThinkPad P16 G2 21FA000FGE | |
| HP ZBook Fury 16 G11 | |
| Lenovo ThinkPad P1 G6-21FV000DGE | |
| Lenovo ThinkPad P16v G1 AMD | |
| Lenovo ThinkPad P1 G4-20Y4S0KS00 | |
| Lenovo ThinkPad P1 G6 21FV001KUS | |
| Asus ProArt Studiobook 16 OLED H7604 | |
| HP ZBook Fury 16 G10 | |
| Átlagos Intel Core i9-14900HX (19 - 85.1, n=37) | |
| Asus ExpertBook B6 Flip B6602FC2 | |
| Dell Precision 5690 | |
| Dell Precision 5000 5680 | |
| MSI CreatorPro Z16P B12UKST | |
| HP ZBook Fury 16 G9 | |
| R Benchmark 2.5 / Overall mean | |
| Lenovo ThinkPad P1 G4-20Y4S0KS00 | |
| Dell Precision 5690 | |
| MSI CreatorPro Z16P B12UKST | |
| Asus ExpertBook B6 Flip B6602FC2 | |
| Lenovo ThinkPad P16 G2 21FA000FGE | |
| Lenovo ThinkPad P16v G1 AMD | |
| HP ZBook Fury 16 G9 | |
| Lenovo ThinkPad P1 G6-21FV000DGE | |
| Dell Precision 5000 5680 | |
| Lenovo ThinkPad P1 G6 21FV001KUS | |
| HP ZBook Fury 16 G10 | |
| Átlagos Intel Core i9-14900HX (0.3604 - 0.4859, n=37) | |
| Asus ProArt Studiobook 16 OLED H7604 | |
| HP ZBook Fury 16 G11 | |
Cinebench R23: Multi Core | Single Core
Cinebench R20: CPU (Multi Core) | CPU (Single Core)
Cinebench R15: CPU Multi 64Bit | CPU Single 64Bit
Blender: v2.79 BMW27 CPU
7-Zip 18.03: 7z b 4 | 7z b 4 -mmt1
Geekbench 6.7: Multi-Core | Single-Core
Geekbench 5.5: Multi-Core | Single-Core
HWBOT x265 Benchmark v2.2: 4k Preset
LibreOffice : 20 Documents To PDF
R Benchmark 2.5: Overall mean
* ... a kisebb jobb
AIDA64: FP32 Ray-Trace | FPU Julia | CPU SHA3 | CPU Queen | FPU SinJulia | FPU Mandel | CPU AES | CPU ZLib | FP64 Ray-Trace | CPU PhotoWorxx
| Performance rating | |
| Asus ProArt Studiobook 16 OLED H7604 | |
| Átlagos Intel Core i9-14900HX | |
| HP ZBook Fury 16 G10 | |
| HP ZBook Fury 16 G11 | |
| Dell Precision 5690 | |
| Lenovo ThinkPad P16 G2 21FA000FGE | |
| HP ZBook Fury 16 G9 | |
| Lenovo ThinkPad P1 G6 21FV001KUS | |
| AIDA64 / FP32 Ray-Trace | |
| Asus ProArt Studiobook 16 OLED H7604 | |
| Átlagos Intel Core i9-14900HX (13098 - 33474, n=36) | |
| HP ZBook Fury 16 G10 | |
| HP ZBook Fury 16 G11 | |
| Dell Precision 5690 | |
| Lenovo ThinkPad P16 G2 21FA000FGE | |
| HP ZBook Fury 16 G9 | |
| Lenovo ThinkPad P1 G6 21FV001KUS | |
| AIDA64 / FPU Julia | |
| Asus ProArt Studiobook 16 OLED H7604 | |
| Átlagos Intel Core i9-14900HX (67573 - 166040, n=36) | |
| HP ZBook Fury 16 G10 | |
| HP ZBook Fury 16 G11 | |
| HP ZBook Fury 16 G9 | |
| Dell Precision 5690 | |
| Lenovo ThinkPad P16 G2 21FA000FGE | |
| Lenovo ThinkPad P1 G6 21FV001KUS | |
| AIDA64 / CPU SHA3 | |
| Asus ProArt Studiobook 16 OLED H7604 | |
| Átlagos Intel Core i9-14900HX (3589 - 7979, n=36) | |
| HP ZBook Fury 16 G10 | |
| HP ZBook Fury 16 G11 | |
| Dell Precision 5690 | |
| Lenovo ThinkPad P16 G2 21FA000FGE | |
| HP ZBook Fury 16 G9 | |
| Lenovo ThinkPad P1 G6 21FV001KUS | |
| AIDA64 / CPU Queen | |
| Átlagos Intel Core i9-14900HX (118405 - 148966, n=36) | |
| HP ZBook Fury 16 G11 | |
| Asus ProArt Studiobook 16 OLED H7604 | |
| HP ZBook Fury 16 G10 | |
| Lenovo ThinkPad P1 G6 21FV001KUS | |
| Lenovo ThinkPad P16 G2 21FA000FGE | |
| HP ZBook Fury 16 G9 | |
| Dell Precision 5690 | |
| AIDA64 / FPU SinJulia | |
| Asus ProArt Studiobook 16 OLED H7604 | |
| Átlagos Intel Core i9-14900HX (10475 - 18517, n=36) | |
| HP ZBook Fury 16 G11 | |
| HP ZBook Fury 16 G10 | |
| Lenovo ThinkPad P16 G2 21FA000FGE | |
| HP ZBook Fury 16 G9 | |
| Dell Precision 5690 | |
| Lenovo ThinkPad P1 G6 21FV001KUS | |
| AIDA64 / FPU Mandel | |
| Asus ProArt Studiobook 16 OLED H7604 | |
| Átlagos Intel Core i9-14900HX (32543 - 83662, n=36) | |
| HP ZBook Fury 16 G10 | |
| HP ZBook Fury 16 G11 | |
| Dell Precision 5690 | |
| HP ZBook Fury 16 G9 | |
| Lenovo ThinkPad P16 G2 21FA000FGE | |
| Lenovo ThinkPad P1 G6 21FV001KUS | |
| AIDA64 / CPU AES | |
| Átlagos Intel Core i9-14900HX (86964 - 241777, n=36) | |
| Asus ProArt Studiobook 16 OLED H7604 | |
| HP ZBook Fury 16 G10 | |
| HP ZBook Fury 16 G11 | |
| HP ZBook Fury 16 G9 | |
| Dell Precision 5690 | |
| Lenovo ThinkPad P16 G2 21FA000FGE | |
| Lenovo ThinkPad P1 G6 21FV001KUS | |
| AIDA64 / CPU ZLib | |
| Asus ProArt Studiobook 16 OLED H7604 | |
| Átlagos Intel Core i9-14900HX (1054 - 2292, n=36) | |
| HP ZBook Fury 16 G11 | |
| HP ZBook Fury 16 G10 | |
| Dell Precision 5690 | |
| HP ZBook Fury 16 G9 | |
| Lenovo ThinkPad P1 G6 21FV001KUS | |
| Lenovo ThinkPad P16 G2 21FA000FGE | |
| AIDA64 / FP64 Ray-Trace | |
| Asus ProArt Studiobook 16 OLED H7604 | |
| Átlagos Intel Core i9-14900HX (6809 - 18349, n=36) | |
| HP ZBook Fury 16 G10 | |
| HP ZBook Fury 16 G11 | |
| Lenovo ThinkPad P16 G2 21FA000FGE | |
| Dell Precision 5690 | |
| Lenovo ThinkPad P1 G6 21FV001KUS | |
| HP ZBook Fury 16 G9 | |
| AIDA64 / CPU PhotoWorxx | |
| Dell Precision 5690 | |
| Asus ProArt Studiobook 16 OLED H7604 | |
| Átlagos Intel Core i9-14900HX (23903 - 54702, n=36) | |
| HP ZBook Fury 16 G10 | |
| HP ZBook Fury 16 G9 | |
| HP ZBook Fury 16 G11 | |
| Lenovo ThinkPad P16 G2 21FA000FGE | |
| Lenovo ThinkPad P1 G6 21FV001KUS | |
Stressz teszt
A Prime95 futtatásakor a CPU terheléséhez a magok órajelének sebessége és a csomag teljesítményfelvétele 3,7 GHz-re, illetve 139 W-ra ugrott, és legfeljebb egy percig tartott, miközben a mag hőmérséklete 99 C-ra emelkedett. A CPU végül 2,3 GHz-en és 69 W-on állapodott meg, hogy a 82 C-os maghőmérsékletet kezelhetőbb szinten tartsa. A teljesítmény idővel történő viszonylag meredek csökkenése a fent említett, fokozatosan csökkenő CineBench R15 xT loop pontszámokhoz vezetett.
A CPU és a GPU hőmérséklete nagyobb terhelés, például játékok futtatása esetén a teljesítménykülönbségek ellenére közel azonos értékeken stabilizálódna, mint amit a tavalyi ZBook Fury 16 G10-en rögzítettünk.
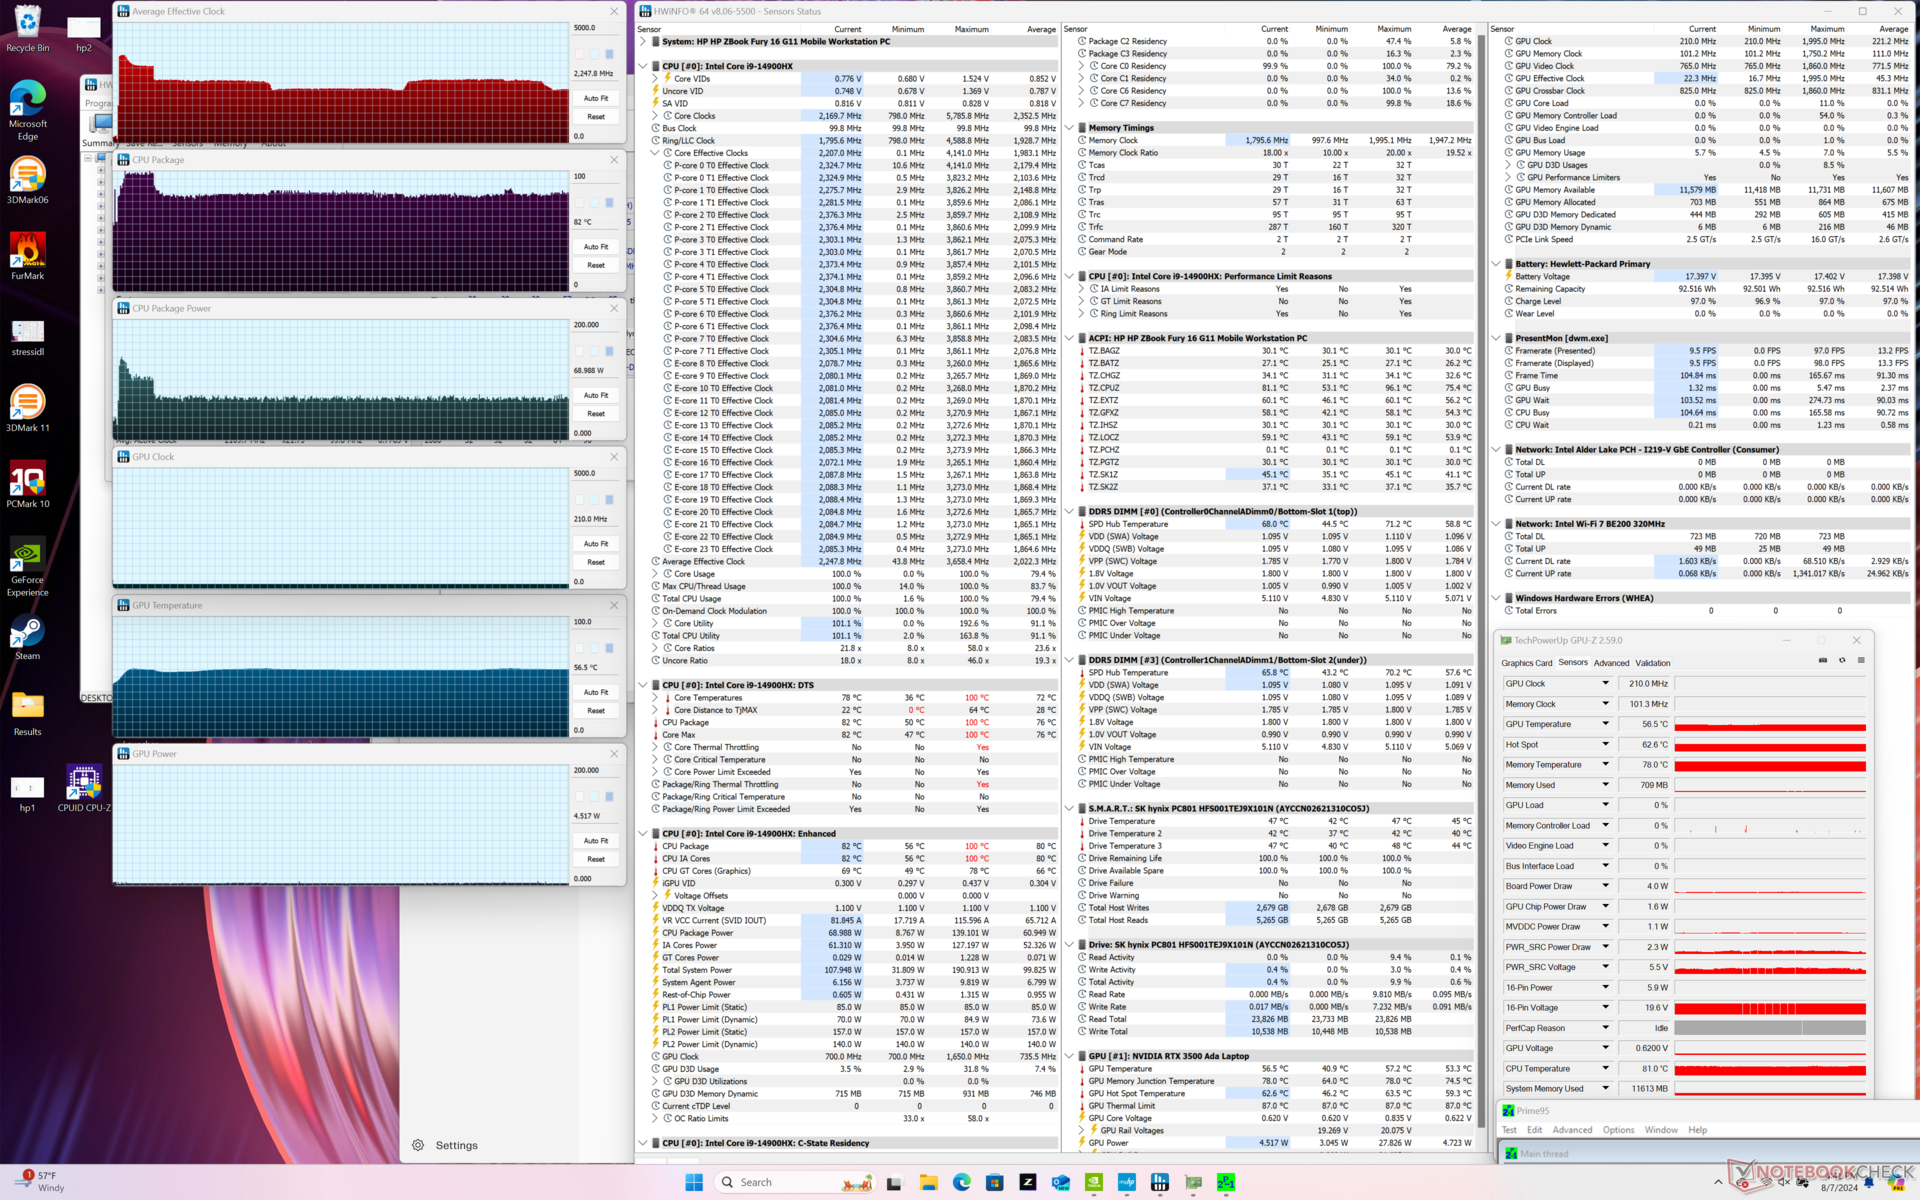
| Átlagos CPU órajel (GHz) | GPU órajel (MHz) | Átlagos CPU hőmérséklet (°C) | Átlagos GPU hőmérséklet (°C) | |
| Rendszer üresjárat | -- | -- | 51 | 42 |
| Prime95 Stressz | 2,2 - 2,6 | -- | 82 | 57 |
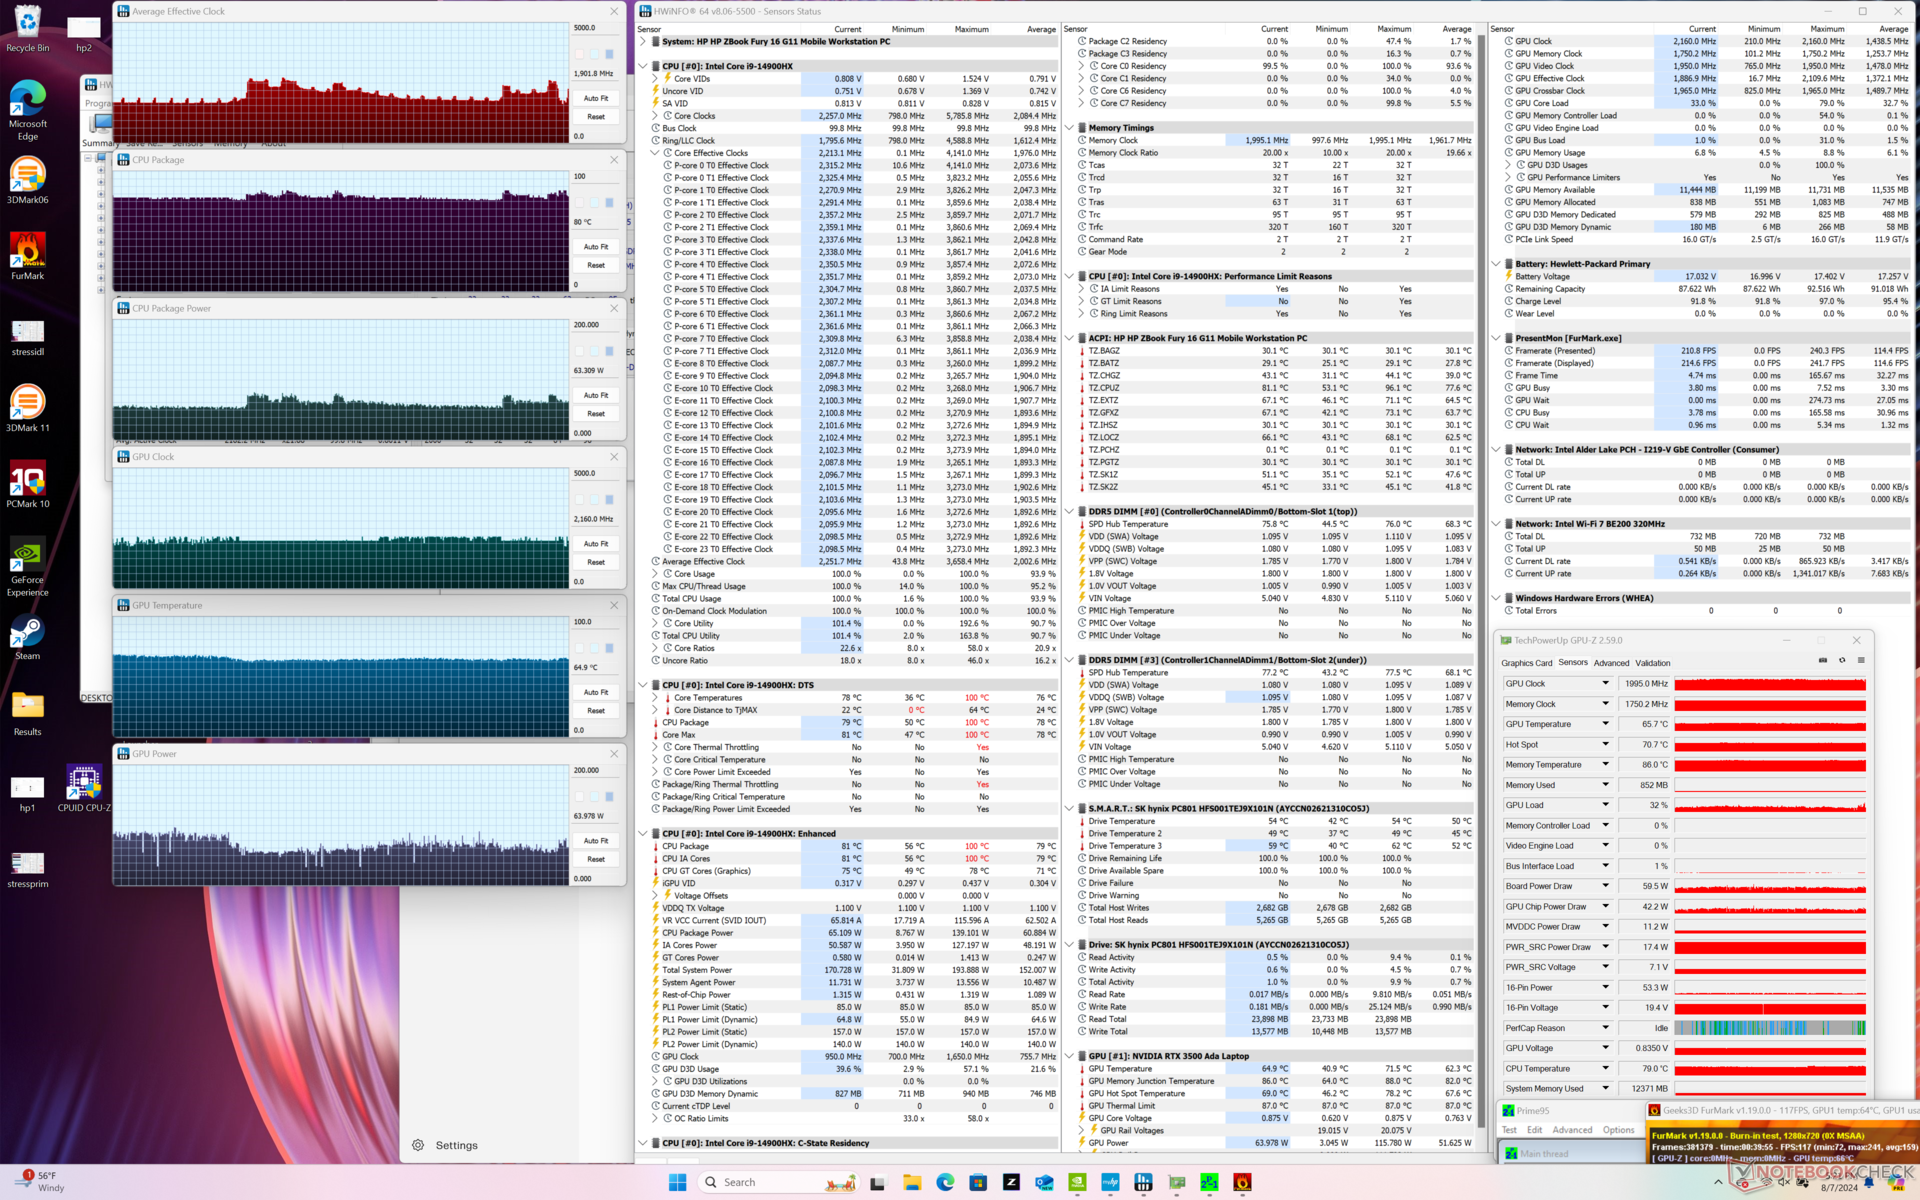
| Prime95 + FurMark Stressz | 1,8 | 1995 | 81 | 65 |
| Cyberpunk 2077 Stressz | 1.1 | 1845 | 81 | 69 |
Rendszer teljesítménye
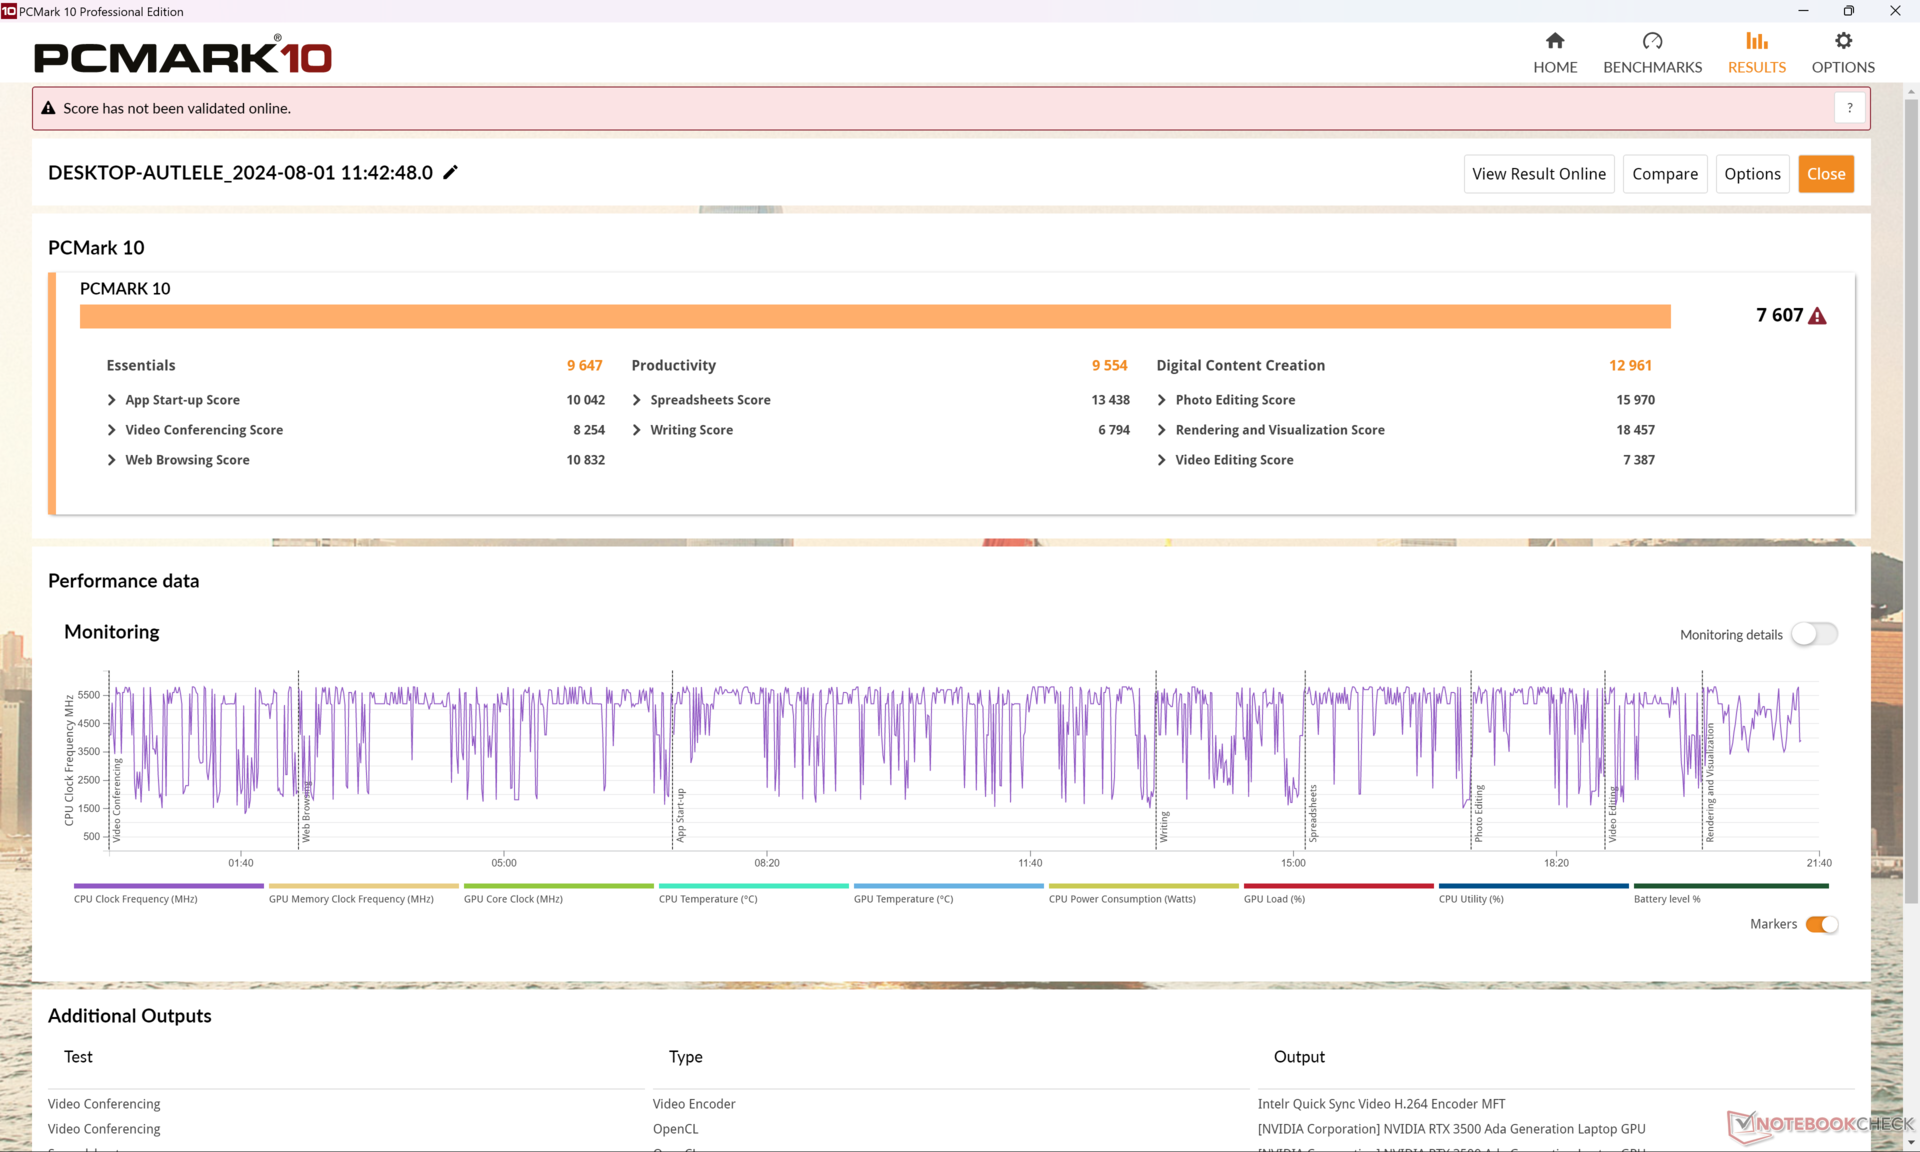
A PCMark eredmények hasonlóak ahhoz, amit a tavalyi ZBook Fury 16 G10-en rögzítettünk, ami arra utal, hogy a ZBook Fury 16 G11 a legtöbb napi feladatot nem fogja gyorsabban futtatni, mint elődje.
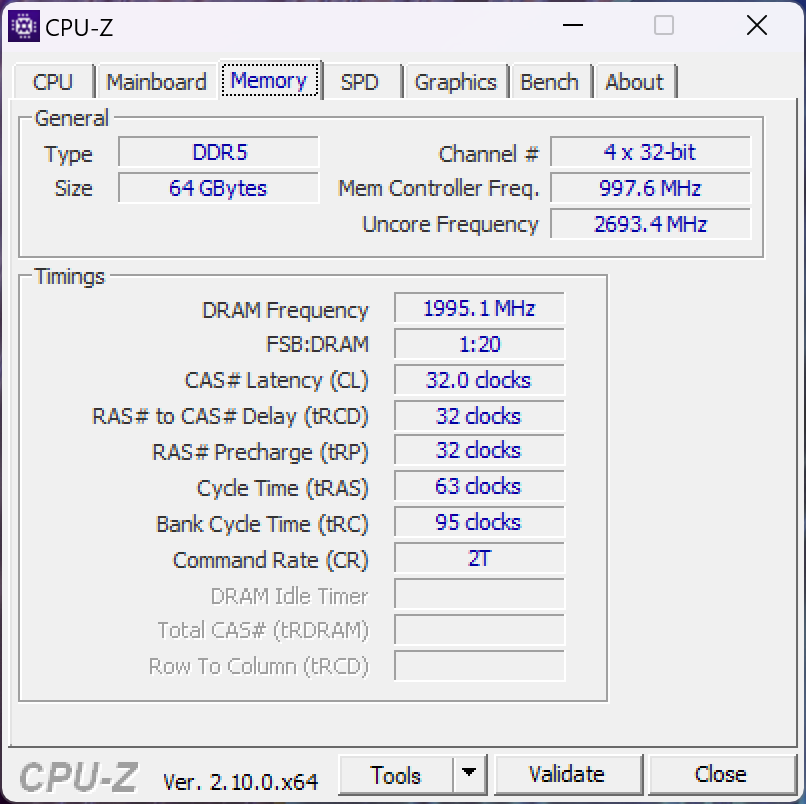
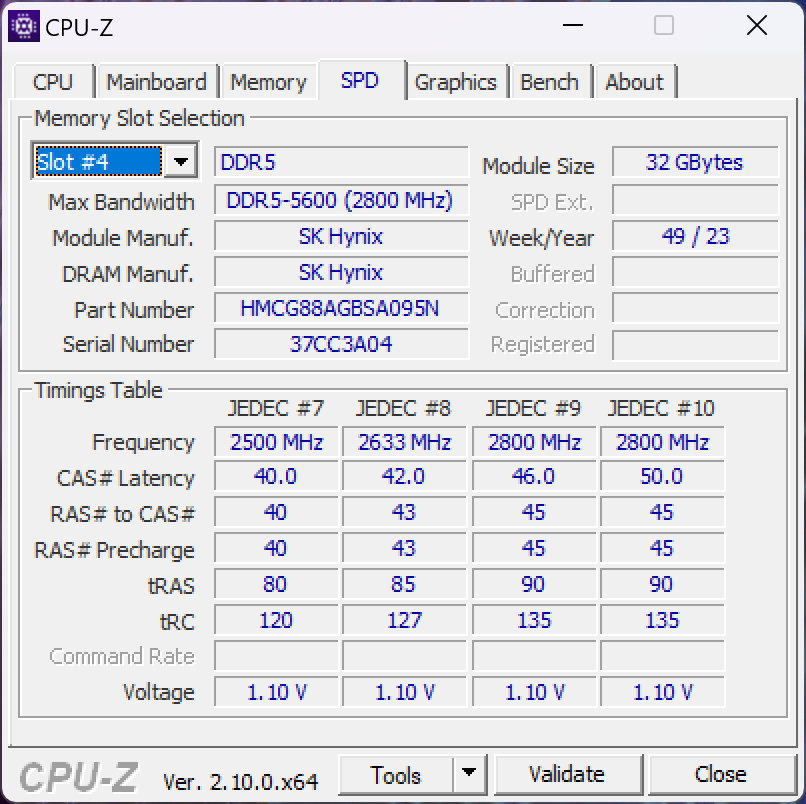
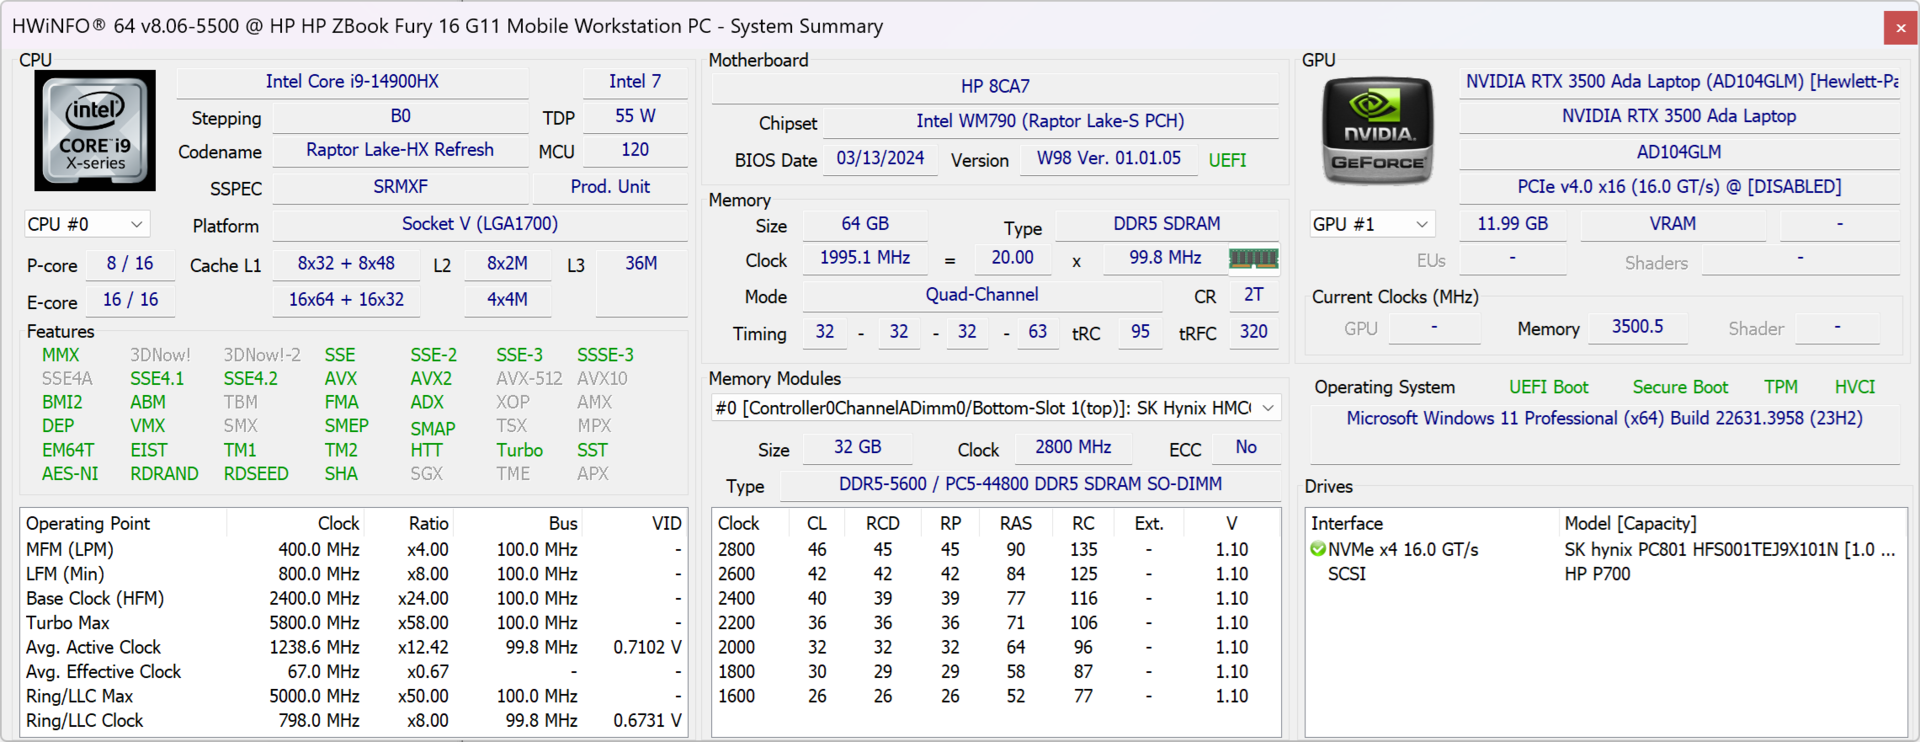
Ne feledje, hogy a SODIMM szabvány korlátai miatt a maximális RAM-sebesség mindössze 4000 MT/s-ra korlátozódik, ha 128 GB memóriával konfigurálják. A modell ECC RAM és nem ECC RAM memóriát egyaránt támogat.
CrossMark: Overall | Productivity | Creativity | Responsiveness
WebXPRT 3: Overall
WebXPRT 4: Overall
Mozilla Kraken 1.1: Total
| PCMark 10 / Score | |
| HP ZBook Fury 16 G10 | |
| Dell Precision 5690 | |
| Lenovo ThinkPad P1 G6 21FV001KUS | |
| HP ZBook Fury 16 G11 | |
| Átlagos Intel Core i9-14900HX, NVIDIA RTX 3500 Ada Generation Laptop (n=1) | |
| Asus ProArt Studiobook 16 OLED H7604 | |
| Lenovo ThinkPad P16 G2 21FA000FGE | |
| HP ZBook Fury 16 G9 | |
| PCMark 10 / Essentials | |
| Lenovo ThinkPad P1 G6 21FV001KUS | |
| HP ZBook Fury 16 G10 | |
| Dell Precision 5690 | |
| Lenovo ThinkPad P16 G2 21FA000FGE | |
| HP ZBook Fury 16 G9 | |
| Asus ProArt Studiobook 16 OLED H7604 | |
| HP ZBook Fury 16 G11 | |
| Átlagos Intel Core i9-14900HX, NVIDIA RTX 3500 Ada Generation Laptop (n=1) | |
| PCMark 10 / Productivity | |
| Dell Precision 5690 | |
| Lenovo ThinkPad P1 G6 21FV001KUS | |
| Asus ProArt Studiobook 16 OLED H7604 | |
| HP ZBook Fury 16 G11 | |
| Átlagos Intel Core i9-14900HX, NVIDIA RTX 3500 Ada Generation Laptop (n=1) | |
| Lenovo ThinkPad P16 G2 21FA000FGE | |
| HP ZBook Fury 16 G10 | |
| HP ZBook Fury 16 G9 | |
| PCMark 10 / Digital Content Creation | |
| HP ZBook Fury 16 G10 | |
| HP ZBook Fury 16 G11 | |
| Átlagos Intel Core i9-14900HX, NVIDIA RTX 3500 Ada Generation Laptop (n=1) | |
| Lenovo ThinkPad P1 G6 21FV001KUS | |
| Dell Precision 5690 | |
| Asus ProArt Studiobook 16 OLED H7604 | |
| Lenovo ThinkPad P16 G2 21FA000FGE | |
| HP ZBook Fury 16 G9 | |
| CrossMark / Overall | |
| Asus ProArt Studiobook 16 OLED H7604 | |
| HP ZBook Fury 16 G11 | |
| Átlagos Intel Core i9-14900HX, NVIDIA RTX 3500 Ada Generation Laptop (n=1) | |
| HP ZBook Fury 16 G10 | |
| HP ZBook Fury 16 G9 | |
| Lenovo ThinkPad P16 G2 21FA000FGE | |
| Lenovo ThinkPad P1 G6 21FV001KUS | |
| Dell Precision 5690 | |
| CrossMark / Productivity | |
| Asus ProArt Studiobook 16 OLED H7604 | |
| HP ZBook Fury 16 G11 | |
| Átlagos Intel Core i9-14900HX, NVIDIA RTX 3500 Ada Generation Laptop (n=1) | |
| HP ZBook Fury 16 G10 | |
| HP ZBook Fury 16 G9 | |
| Dell Precision 5690 | |
| Lenovo ThinkPad P1 G6 21FV001KUS | |
| Lenovo ThinkPad P16 G2 21FA000FGE | |
| CrossMark / Creativity | |
| Asus ProArt Studiobook 16 OLED H7604 | |
| HP ZBook Fury 16 G11 | |
| Átlagos Intel Core i9-14900HX, NVIDIA RTX 3500 Ada Generation Laptop (n=1) | |
| Lenovo ThinkPad P16 G2 21FA000FGE | |
| HP ZBook Fury 16 G9 | |
| HP ZBook Fury 16 G10 | |
| Lenovo ThinkPad P1 G6 21FV001KUS | |
| Dell Precision 5690 | |
| CrossMark / Responsiveness | |
| Asus ProArt Studiobook 16 OLED H7604 | |
| HP ZBook Fury 16 G11 | |
| Átlagos Intel Core i9-14900HX, NVIDIA RTX 3500 Ada Generation Laptop (n=1) | |
| HP ZBook Fury 16 G10 | |
| HP ZBook Fury 16 G9 | |
| Dell Precision 5690 | |
| Lenovo ThinkPad P1 G6 21FV001KUS | |
| Lenovo ThinkPad P16 G2 21FA000FGE | |
| WebXPRT 3 / Overall | |
| HP ZBook Fury 16 G10 | |
| Asus ProArt Studiobook 16 OLED H7604 | |
| Lenovo ThinkPad P16 G2 21FA000FGE | |
| HP ZBook Fury 16 G11 | |
| Átlagos Intel Core i9-14900HX, NVIDIA RTX 3500 Ada Generation Laptop (n=1) | |
| Lenovo ThinkPad P1 G6 21FV001KUS | |
| HP ZBook Fury 16 G9 | |
| Dell Precision 5690 | |
| WebXPRT 4 / Overall | |
| HP ZBook Fury 16 G11 | |
| Átlagos Intel Core i9-14900HX, NVIDIA RTX 3500 Ada Generation Laptop (n=1) | |
| HP ZBook Fury 16 G10 | |
| Asus ProArt Studiobook 16 OLED H7604 | |
| Lenovo ThinkPad P1 G6 21FV001KUS | |
| HP ZBook Fury 16 G9 | |
| Dell Precision 5690 | |
| Mozilla Kraken 1.1 / Total | |
| Dell Precision 5690 | |
| HP ZBook Fury 16 G9 | |
| Lenovo ThinkPad P16 G2 21FA000FGE | |
| Lenovo ThinkPad P1 G6 21FV001KUS | |
| HP ZBook Fury 16 G10 | |
| HP ZBook Fury 16 G11 | |
| Átlagos Intel Core i9-14900HX, NVIDIA RTX 3500 Ada Generation Laptop (n=1) | |
| Asus ProArt Studiobook 16 OLED H7604 | |
* ... a kisebb jobb
| PCMark 10 Score | 7607 pontok | |
Segítség | ||
| AIDA64 / Memory Copy | |
| Dell Precision 5690 | |
| Átlagos Intel Core i9-14900HX (38028 - 83392, n=36) | |
| Asus ProArt Studiobook 16 OLED H7604 | |
| HP ZBook Fury 16 G10 | |
| HP ZBook Fury 16 G9 | |
| HP ZBook Fury 16 G11 | |
| Lenovo ThinkPad P16 G2 21FA000FGE | |
| Lenovo ThinkPad P1 G6 21FV001KUS | |
| AIDA64 / Memory Read | |
| Dell Precision 5690 | |
| Átlagos Intel Core i9-14900HX (43306 - 87568, n=36) | |
| Asus ProArt Studiobook 16 OLED H7604 | |
| HP ZBook Fury 16 G10 | |
| HP ZBook Fury 16 G11 | |
| HP ZBook Fury 16 G9 | |
| Lenovo ThinkPad P16 G2 21FA000FGE | |
| Lenovo ThinkPad P1 G6 21FV001KUS | |
| AIDA64 / Memory Write | |
| Dell Precision 5690 | |
| Átlagos Intel Core i9-14900HX (37146 - 80589, n=36) | |
| Asus ProArt Studiobook 16 OLED H7604 | |
| HP ZBook Fury 16 G10 | |
| HP ZBook Fury 16 G9 | |
| Lenovo ThinkPad P16 G2 21FA000FGE | |
| HP ZBook Fury 16 G11 | |
| Lenovo ThinkPad P1 G6 21FV001KUS | |
| AIDA64 / Memory Latency | |
| Dell Precision 5690 | |
| HP ZBook Fury 16 G10 | |
| Lenovo ThinkPad P16 G2 21FA000FGE | |
| HP ZBook Fury 16 G11 | |
| HP ZBook Fury 16 G9 | |
| Asus ProArt Studiobook 16 OLED H7604 | |
| Lenovo ThinkPad P1 G6 21FV001KUS | |
| Átlagos Intel Core i9-14900HX (76.1 - 105, n=36) | |
* ... a kisebb jobb
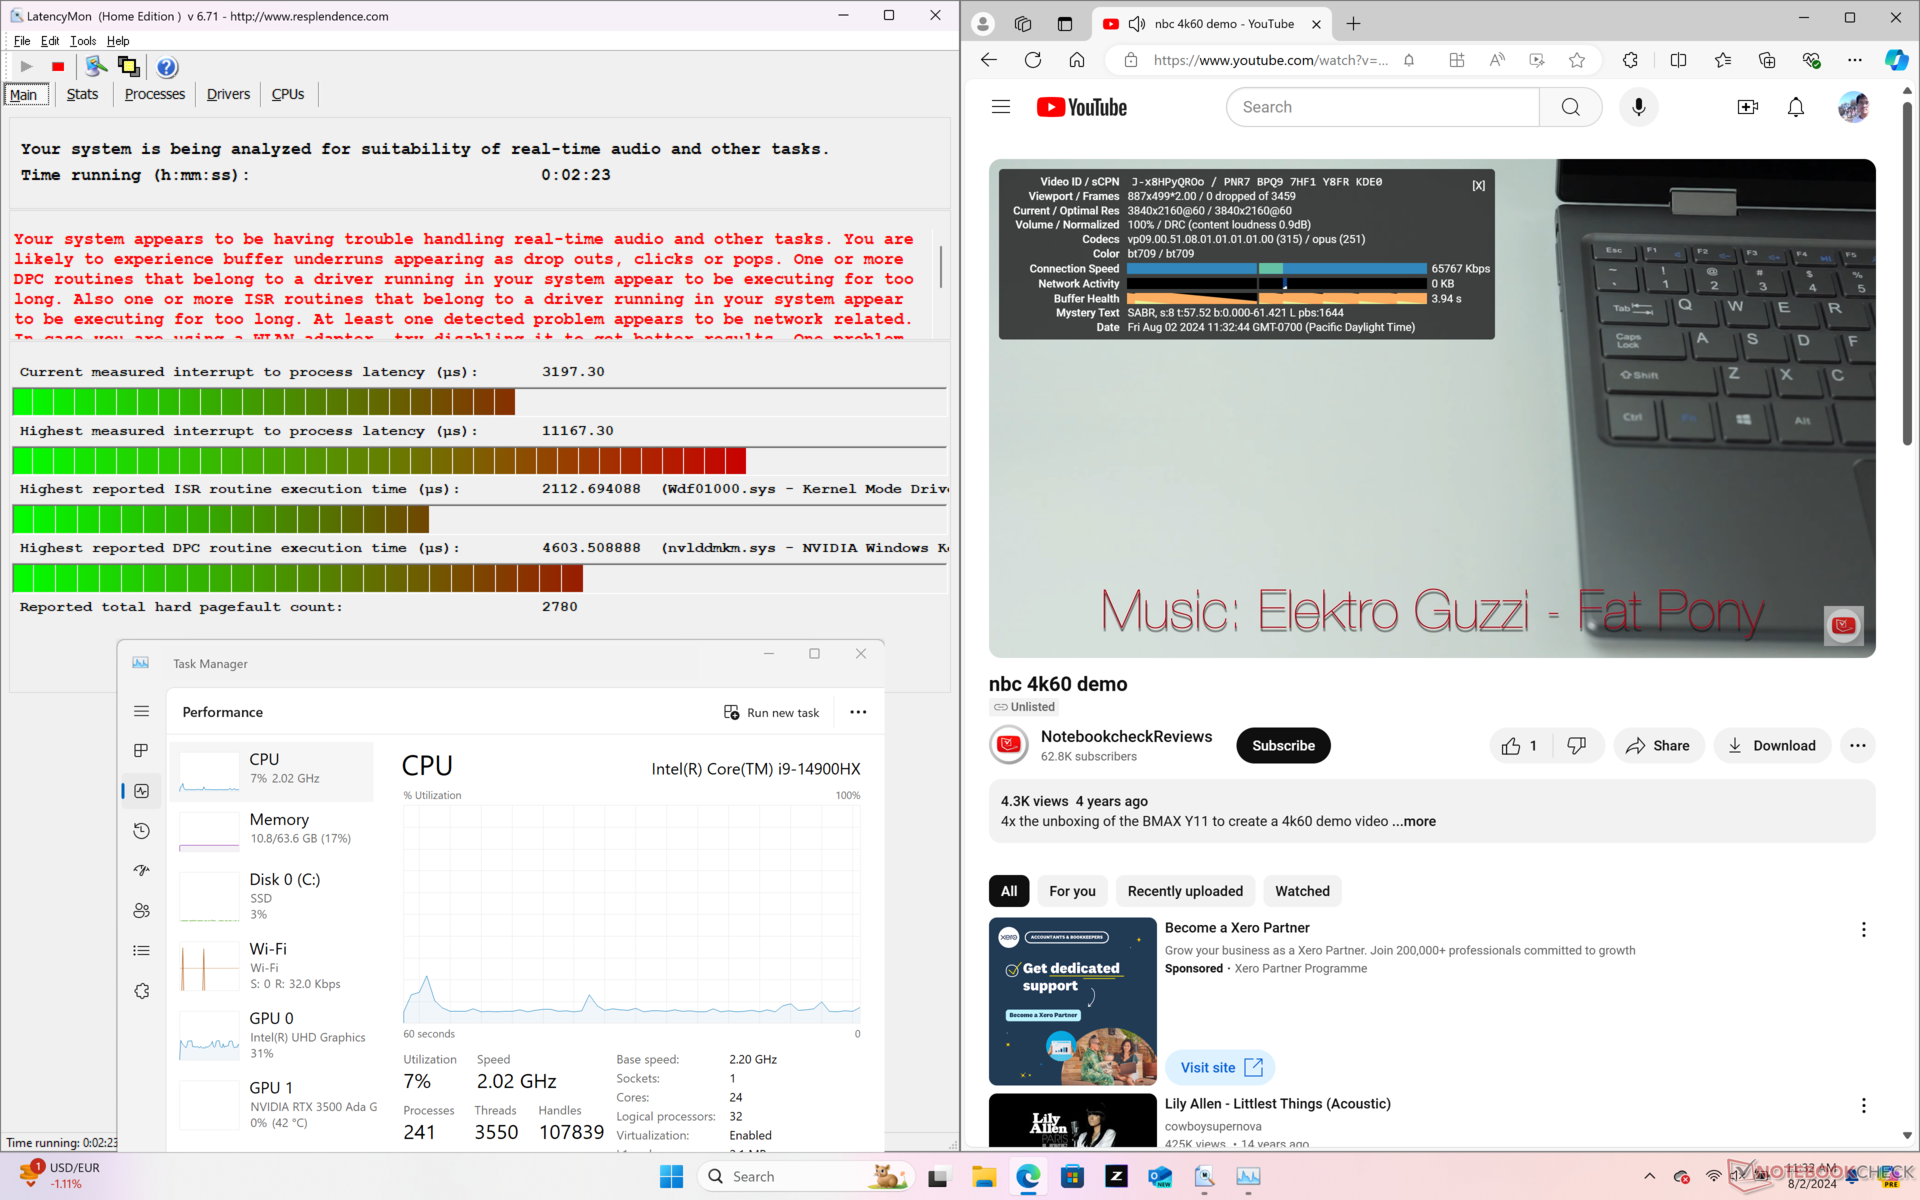
DPC késleltetés
A LatencyMon DPC-problémákat tár fel a honlapunk több böngészőfülének megnyitásakor. a 4K videólejátszás 60 FPS mellett egyébként tökéletes, és nem rögzítettek kiesett képkockákat.

| DPC Latencies / LatencyMon - interrupt to process latency (max), Web, Youtube, Prime95 | |
| HP ZBook Fury 16 G11 | |
| HP ZBook Fury 16 G10 | |
| HP ZBook Fury 16 G9 | |
| Asus ProArt Studiobook 16 OLED H7604 | |
| Lenovo ThinkPad P1 G6 21FV001KUS | |
| Lenovo ThinkPad P16 G2 21FA000FGE | |
| Dell Precision 5690 | |
* ... a kisebb jobb
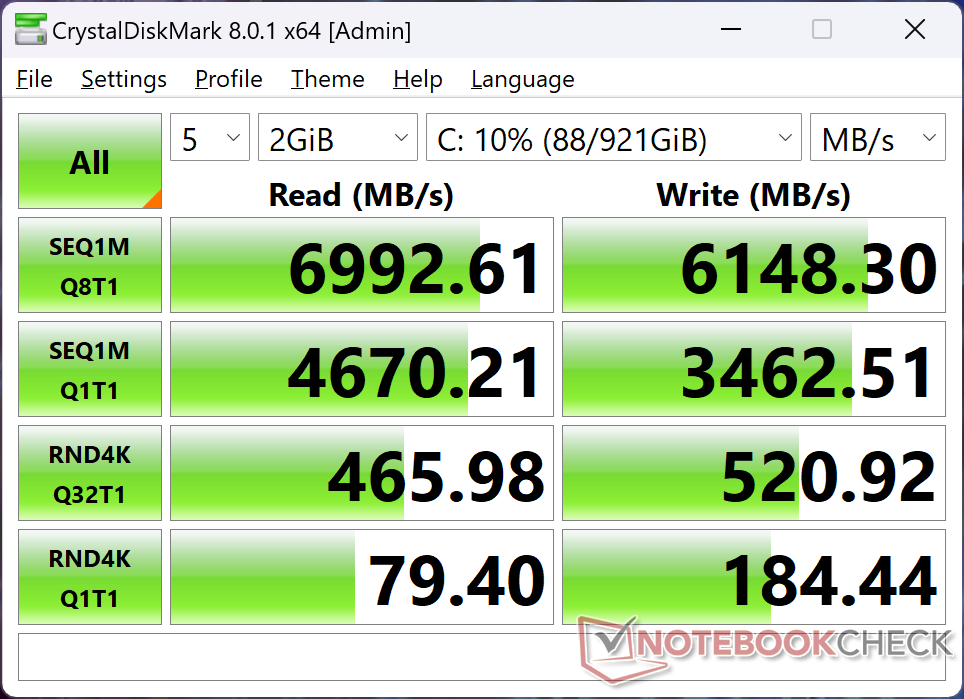
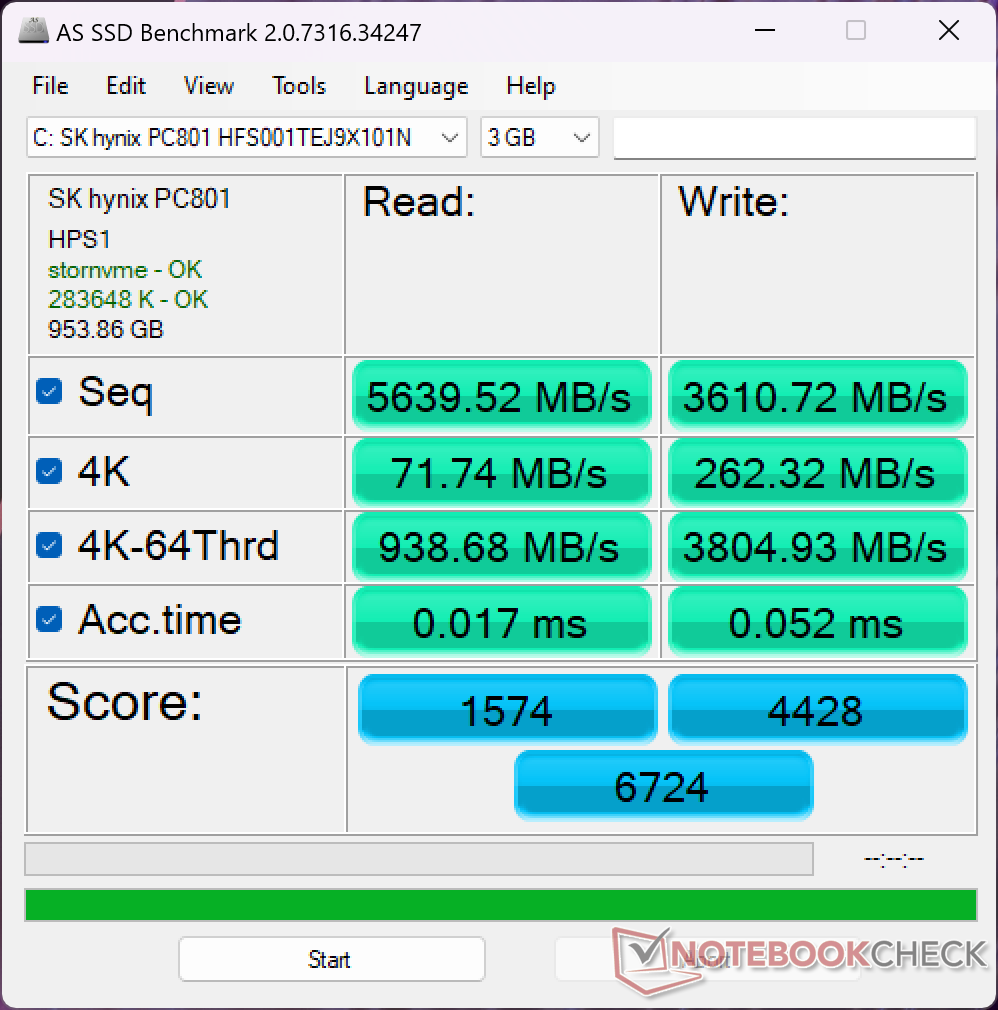
Tárolóeszközök
Tesztkészülékünk ugyanazt az 1 TB-os SK Hynix PC801 HFS001TEJ9X101N PCIe4 M.2 SSD-vel, mint a tavalyi ZBook Fury 16 G10-ben. Sajnos a meghajtó is ugyanazoktól a teljesítménycsökkentési problémáktól szenved. A DiskSpd hurokban történő futtatásakor az átviteli sebesség nagyon magas, majdnem 7000 MB/s volt, majd néhány perc múlva 3400 MB/s-ra esett vissza, ahogy az alábbi grafikon mutatja. Ez a meghajtók elégtelen hűtésének tudható be, de talán ez az ára annak, hogy több egyedi meghajtót támogatunk, mint a legtöbb más laptopon.

| Drive Performance rating - Percent | |
| HP ZBook Fury 16 G9 | |
| Asus ProArt Studiobook 16 OLED H7604 | |
| HP ZBook Fury 16 G11 | |
| Dell Precision 5690 | |
| HP ZBook Fury 16 G10 | |
| Lenovo ThinkPad P16 G2 21FA000FGE | |
| Lenovo ThinkPad P1 G6 21FV001KUS | |
| DiskSpd | |
| seq read | |
| Dell Precision 5690 | |
| HP ZBook Fury 16 G11 | |
| Lenovo ThinkPad P16 G2 21FA000FGE | |
| Asus ProArt Studiobook 16 OLED H7604 | |
| Lenovo ThinkPad P1 G6 21FV001KUS | |
| HP ZBook Fury 16 G10 | |
| HP ZBook Fury 16 G9 | |
| seq write | |
| Dell Precision 5690 | |
| HP ZBook Fury 16 G9 | |
| Asus ProArt Studiobook 16 OLED H7604 | |
| Lenovo ThinkPad P1 G6 21FV001KUS | |
| Lenovo ThinkPad P16 G2 21FA000FGE | |
| HP ZBook Fury 16 G11 | |
| HP ZBook Fury 16 G10 | |
| seq q8 t1 read | |
| Dell Precision 5690 | |
| Lenovo ThinkPad P16 G2 21FA000FGE | |
| Asus ProArt Studiobook 16 OLED H7604 | |
| HP ZBook Fury 16 G11 | |
| HP ZBook Fury 16 G10 | |
| Lenovo ThinkPad P1 G6 21FV001KUS | |
| HP ZBook Fury 16 G9 | |
| seq q8 t1 write | |
| Dell Precision 5690 | |
| Asus ProArt Studiobook 16 OLED H7604 | |
| HP ZBook Fury 16 G11 | |
| Lenovo ThinkPad P16 G2 21FA000FGE | |
| HP ZBook Fury 16 G10 | |
| Lenovo ThinkPad P1 G6 21FV001KUS | |
| HP ZBook Fury 16 G9 | |
| 4k q1 t1 read | |
| Dell Precision 5690 | |
| Asus ProArt Studiobook 16 OLED H7604 | |
| HP ZBook Fury 16 G10 | |
| HP ZBook Fury 16 G11 | |
| HP ZBook Fury 16 G9 | |
| Lenovo ThinkPad P1 G6 21FV001KUS | |
| Lenovo ThinkPad P16 G2 21FA000FGE | |
| 4k q1 t1 write | |
| Asus ProArt Studiobook 16 OLED H7604 | |
| HP ZBook Fury 16 G10 | |
| HP ZBook Fury 16 G11 | |
| Dell Precision 5690 | |
| Lenovo ThinkPad P1 G6 21FV001KUS | |
| HP ZBook Fury 16 G9 | |
| Lenovo ThinkPad P16 G2 21FA000FGE | |
| 4k q32 t16 read | |
| HP ZBook Fury 16 G9 | |
| Dell Precision 5690 | |
| HP ZBook Fury 16 G10 | |
| Lenovo ThinkPad P16 G2 21FA000FGE | |
| HP ZBook Fury 16 G11 | |
| Lenovo ThinkPad P1 G6 21FV001KUS | |
| Asus ProArt Studiobook 16 OLED H7604 | |
| 4k q32 t16 write | |
| HP ZBook Fury 16 G9 | |
| Dell Precision 5690 | |
| Asus ProArt Studiobook 16 OLED H7604 | |
| HP ZBook Fury 16 G11 | |
| HP ZBook Fury 16 G10 | |
| Lenovo ThinkPad P16 G2 21FA000FGE | |
| Lenovo ThinkPad P1 G6 21FV001KUS | |
| AS SSD | |
| Score Total | |
| Asus ProArt Studiobook 16 OLED H7604 | |
| HP ZBook Fury 16 G9 | |
| HP ZBook Fury 16 G11 | |
| HP ZBook Fury 16 G10 | |
| Lenovo ThinkPad P16 G2 21FA000FGE | |
| Lenovo ThinkPad P1 G6 21FV001KUS | |
| Dell Precision 5690 | |
| Score Read | |
| HP ZBook Fury 16 G9 | |
| Dell Precision 5690 | |
| HP ZBook Fury 16 G11 | |
| Asus ProArt Studiobook 16 OLED H7604 | |
| HP ZBook Fury 16 G10 | |
| Lenovo ThinkPad P1 G6 21FV001KUS | |
| Lenovo ThinkPad P16 G2 21FA000FGE | |
| Score Write | |
| Asus ProArt Studiobook 16 OLED H7604 | |
| HP ZBook Fury 16 G11 | |
| HP ZBook Fury 16 G10 | |
| Lenovo ThinkPad P16 G2 21FA000FGE | |
| HP ZBook Fury 16 G9 | |
| Lenovo ThinkPad P1 G6 21FV001KUS | |
| Dell Precision 5690 | |
| Seq Read | |
| Dell Precision 5690 | |
| HP ZBook Fury 16 G11 | |
| HP ZBook Fury 16 G10 | |
| Lenovo ThinkPad P1 G6 21FV001KUS | |
| Asus ProArt Studiobook 16 OLED H7604 | |
| HP ZBook Fury 16 G9 | |
| Lenovo ThinkPad P16 G2 21FA000FGE | |
| Seq Write | |
| Dell Precision 5690 | |
| HP ZBook Fury 16 G11 | |
| Lenovo ThinkPad P1 G6 21FV001KUS | |
| Asus ProArt Studiobook 16 OLED H7604 | |
| HP ZBook Fury 16 G10 | |
| HP ZBook Fury 16 G9 | |
| Lenovo ThinkPad P16 G2 21FA000FGE | |
| 4K Read | |
| Asus ProArt Studiobook 16 OLED H7604 | |
| HP ZBook Fury 16 G11 | |
| HP ZBook Fury 16 G10 | |
| Dell Precision 5690 | |
| Lenovo ThinkPad P1 G6 21FV001KUS | |
| HP ZBook Fury 16 G9 | |
| Lenovo ThinkPad P16 G2 21FA000FGE | |
| 4K Write | |
| HP ZBook Fury 16 G11 | |
| HP ZBook Fury 16 G10 | |
| Asus ProArt Studiobook 16 OLED H7604 | |
| Lenovo ThinkPad P1 G6 21FV001KUS | |
| HP ZBook Fury 16 G9 | |
| Dell Precision 5690 | |
| Lenovo ThinkPad P16 G2 21FA000FGE | |
| 4K-64 Read | |
| HP ZBook Fury 16 G9 | |
| Asus ProArt Studiobook 16 OLED H7604 | |
| Lenovo ThinkPad P16 G2 21FA000FGE | |
| HP ZBook Fury 16 G11 | |
| HP ZBook Fury 16 G10 | |
| Lenovo ThinkPad P1 G6 21FV001KUS | |
| Dell Precision 5690 | |
| 4K-64 Write | |
| Asus ProArt Studiobook 16 OLED H7604 | |
| HP ZBook Fury 16 G11 | |
| HP ZBook Fury 16 G10 | |
| Lenovo ThinkPad P16 G2 21FA000FGE | |
| HP ZBook Fury 16 G9 | |
| Lenovo ThinkPad P1 G6 21FV001KUS | |
| Dell Precision 5690 | |
| Access Time Read | |
| Lenovo ThinkPad P1 G6 21FV001KUS | |
| Lenovo ThinkPad P16 G2 21FA000FGE | |
| Dell Precision 5690 | |
| HP ZBook Fury 16 G10 | |
| HP ZBook Fury 16 G9 | |
| Asus ProArt Studiobook 16 OLED H7604 | |
| HP ZBook Fury 16 G11 | |
| Access Time Write | |
| Dell Precision 5690 | |
| HP ZBook Fury 16 G9 | |
| Lenovo ThinkPad P1 G6 21FV001KUS | |
| HP ZBook Fury 16 G10 | |
| HP ZBook Fury 16 G11 | |
| Lenovo ThinkPad P16 G2 21FA000FGE | |
| Asus ProArt Studiobook 16 OLED H7604 | |
* ... a kisebb jobb
Disk Throttling: DiskSpd Read Loop, Queue Depth 8
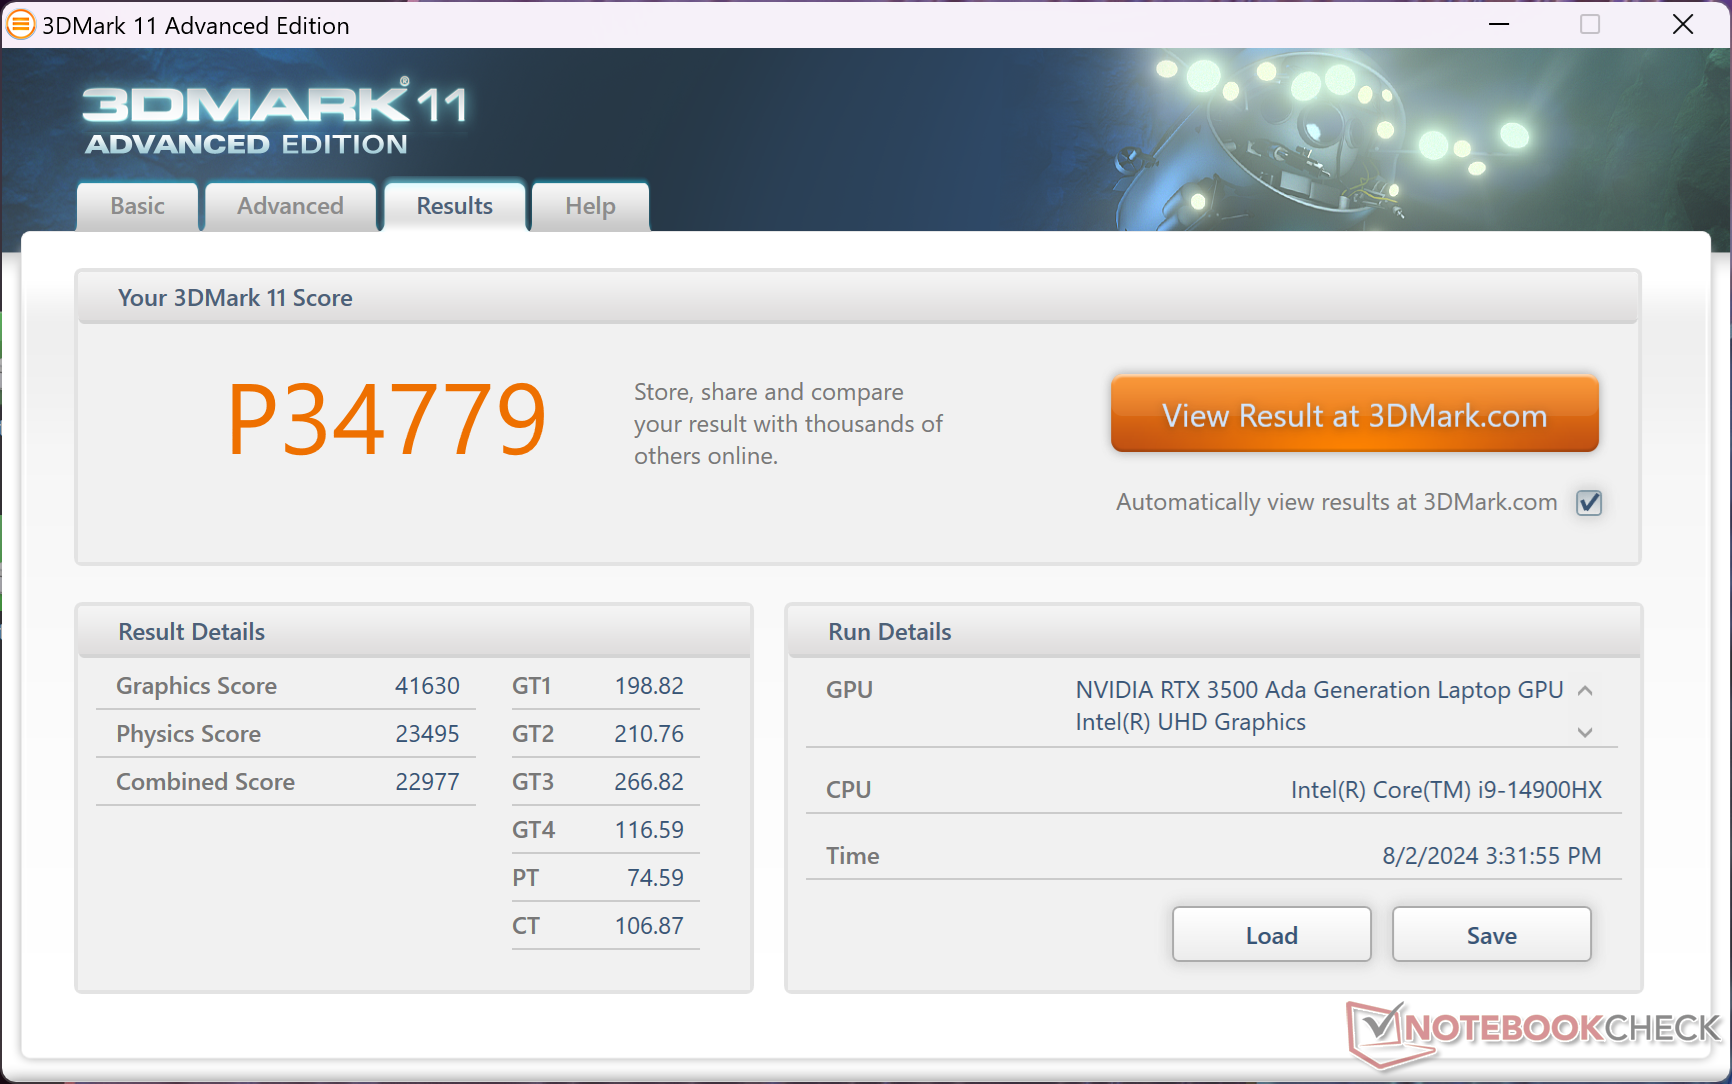
GPU teljesítmény
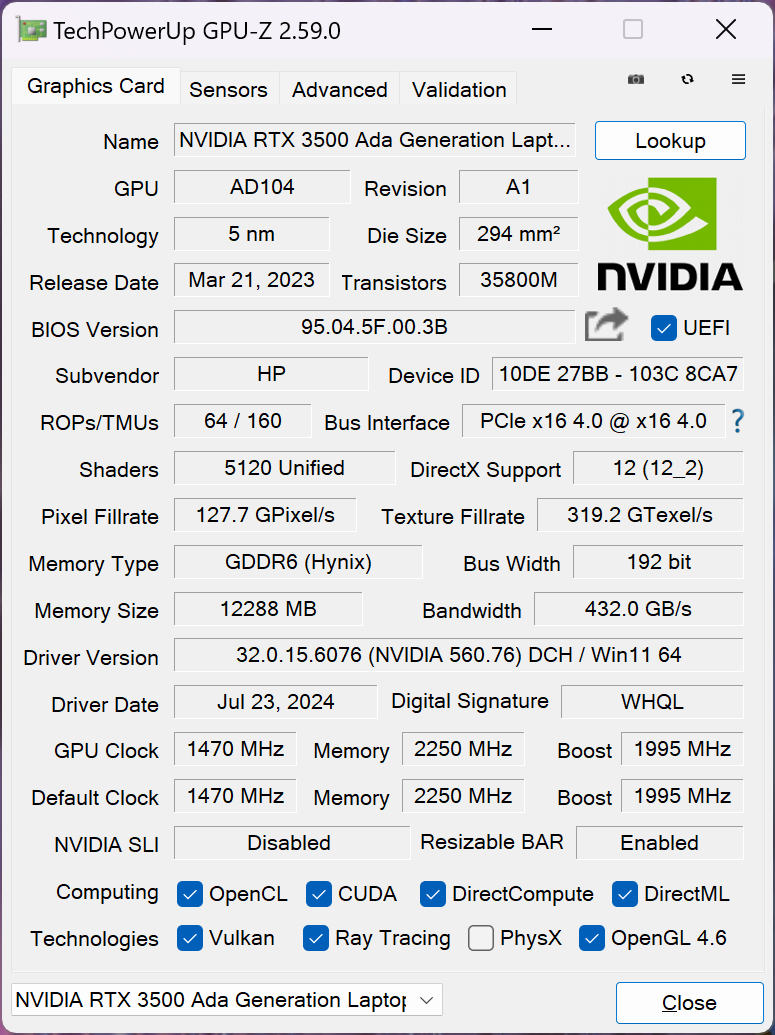
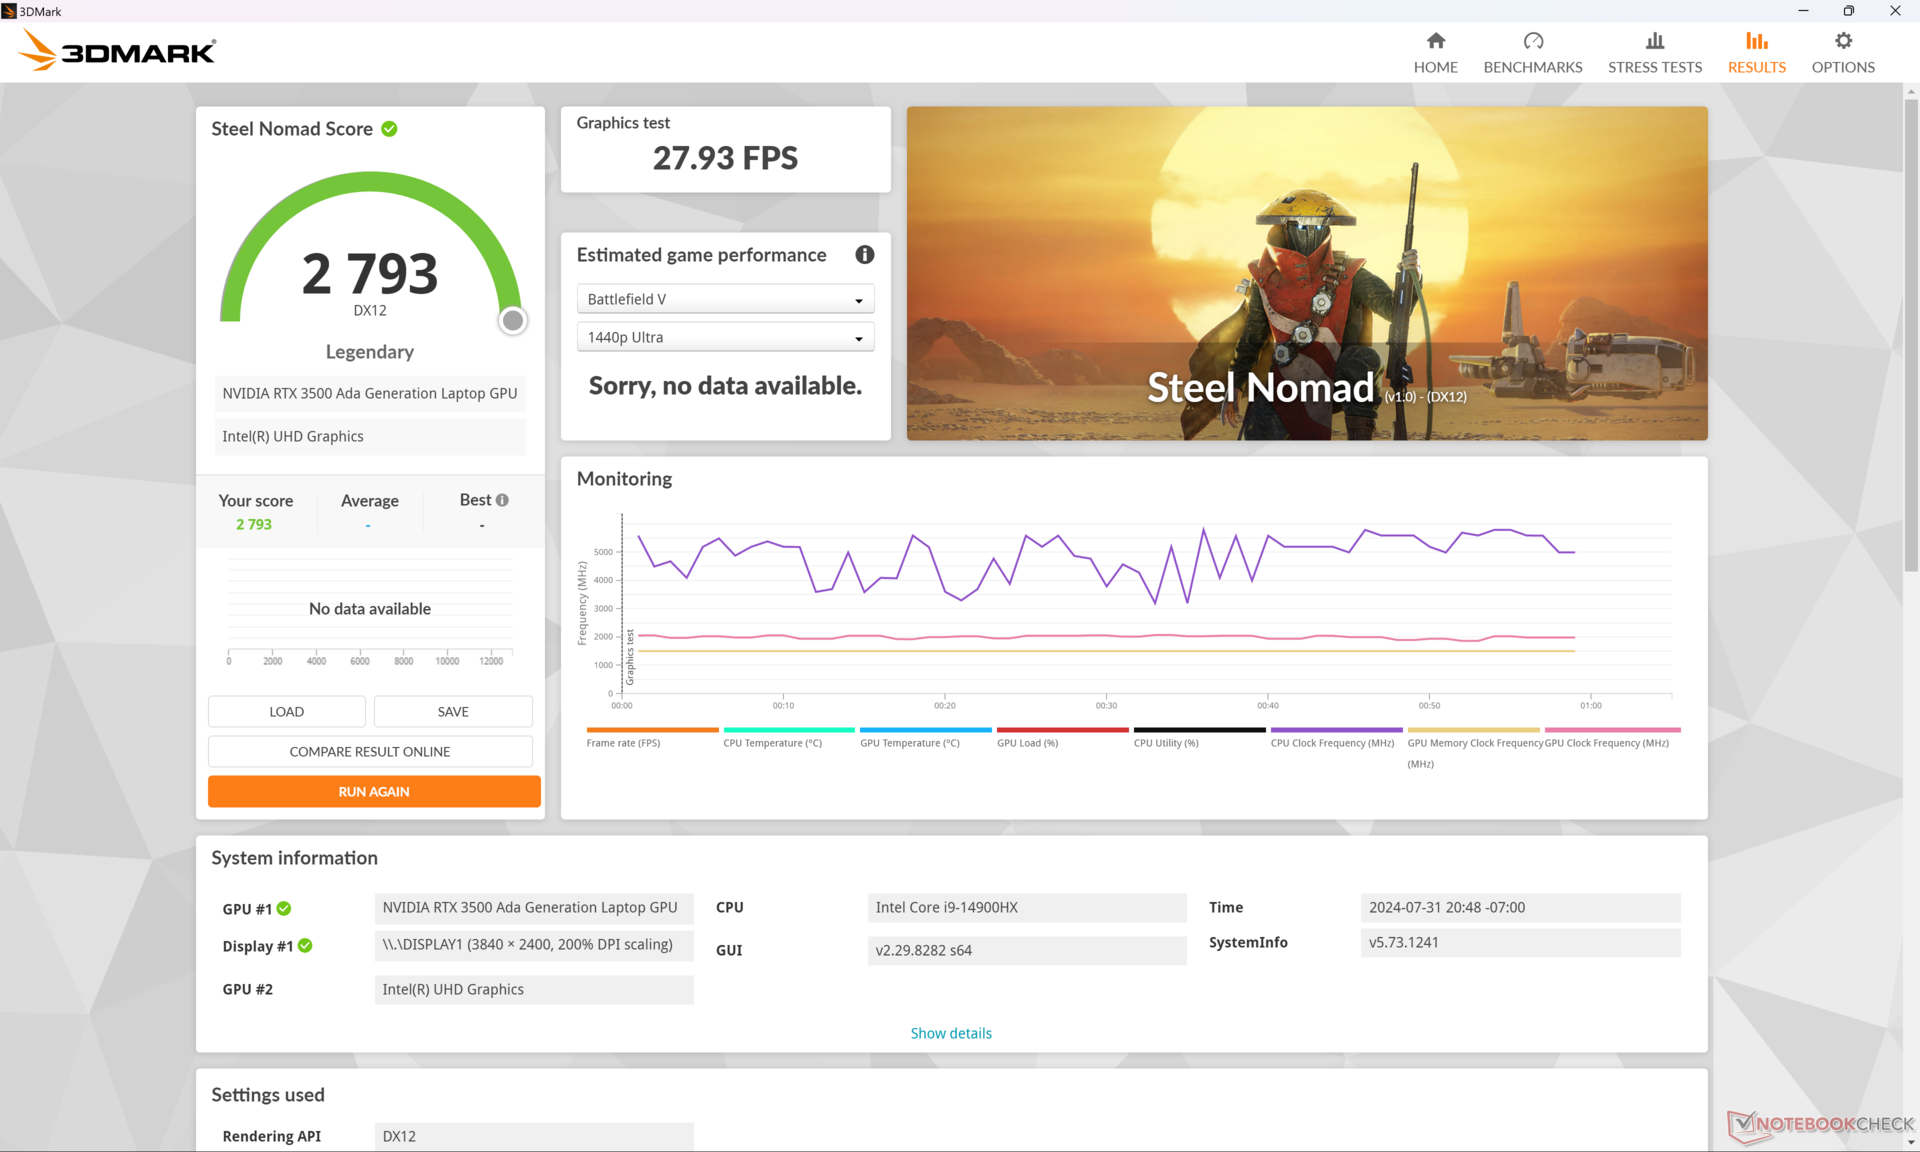
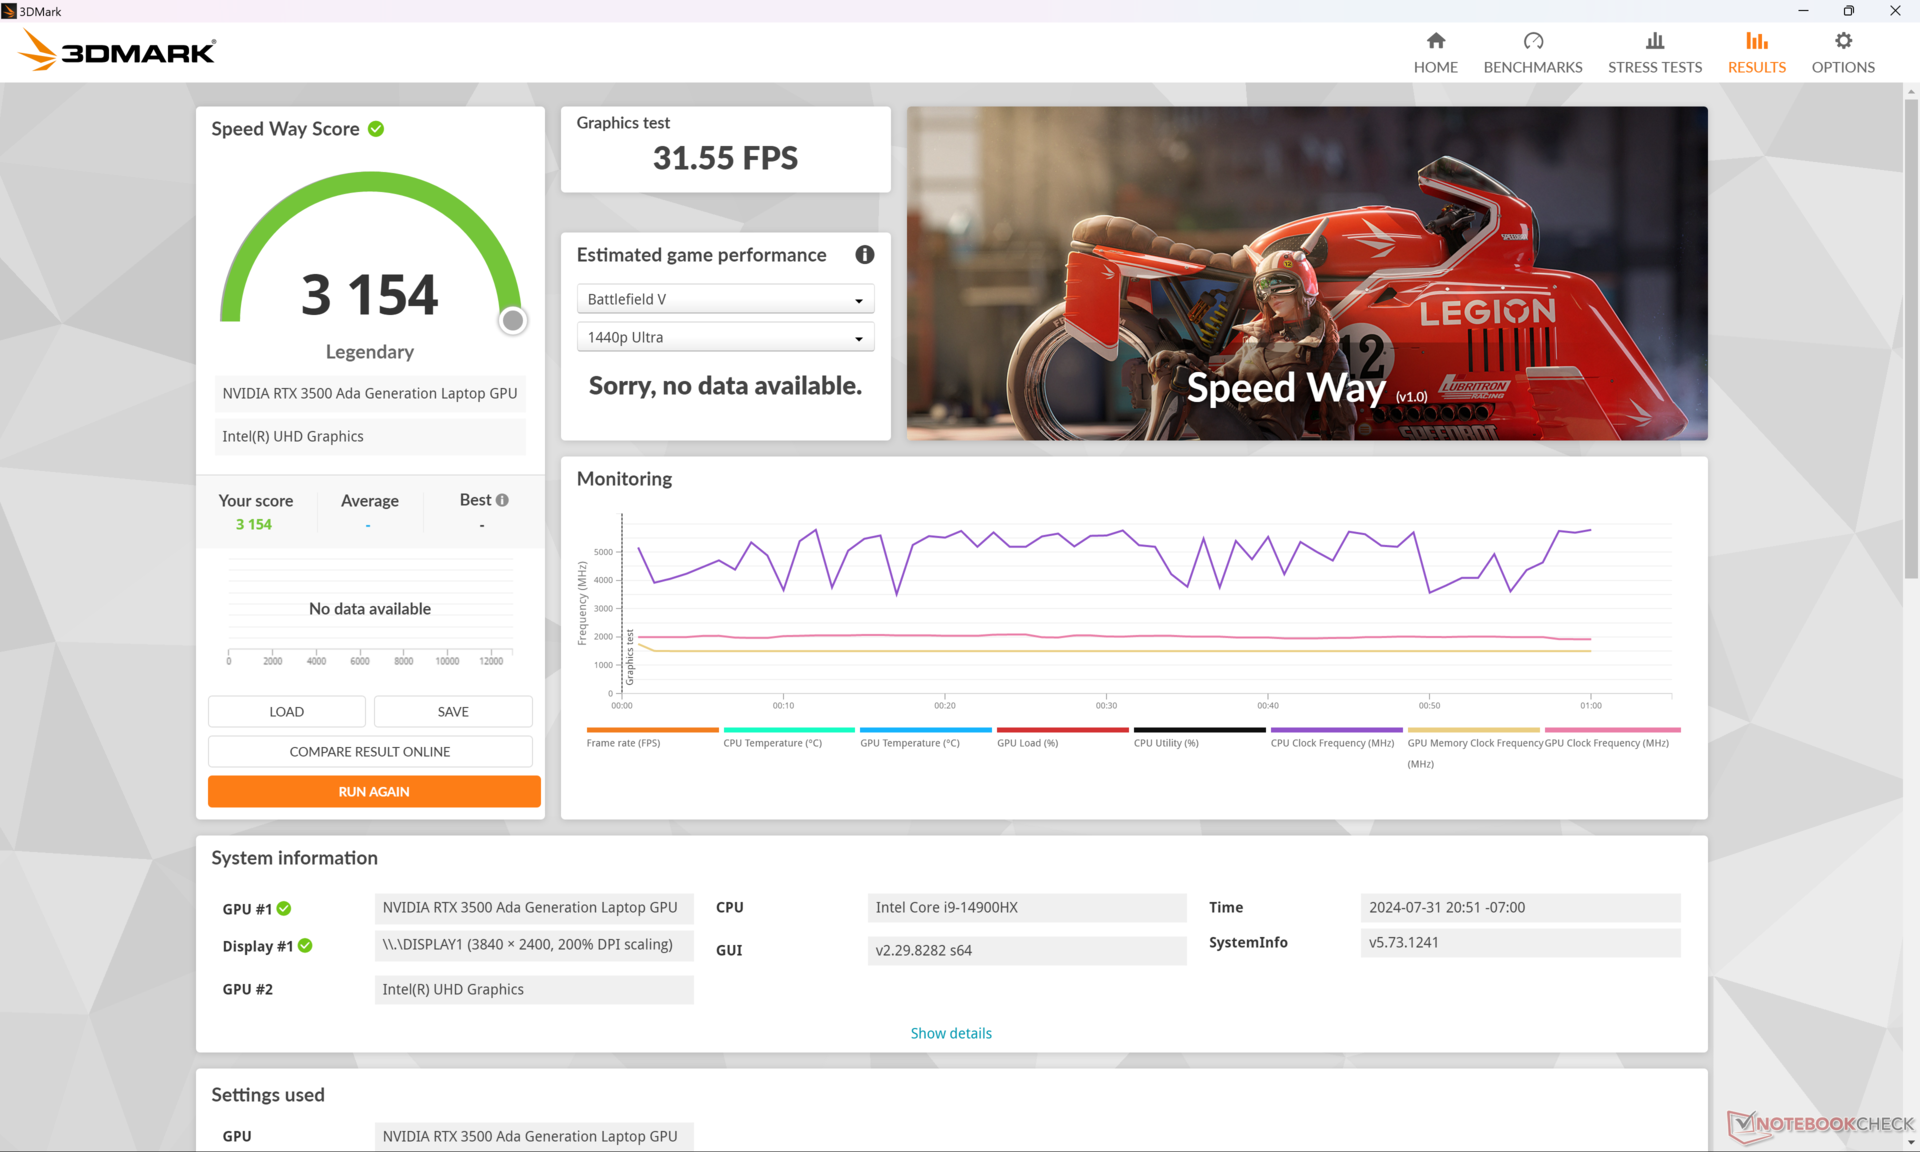
A felhasználók számíthatnak a RTX 3500 Ada nagyjából 20-30 százalékkal lassabb teljesítményt nyújt, mint a RTX 5000 Ada. Mivel az Nvidia még nem mutatta be a mobil GPU-k új generációját, a ZBook Fury 16 G11 ugyanazokkal a GPU-opciókkal kerül forgalomba, mint a tavalyi modellben, és nem tapasztalható említésre méltó teljesítménynövekedés. Az RTA 5000 Ada továbbra is a leggyorsabb mobil munkaállomás GPU marad.
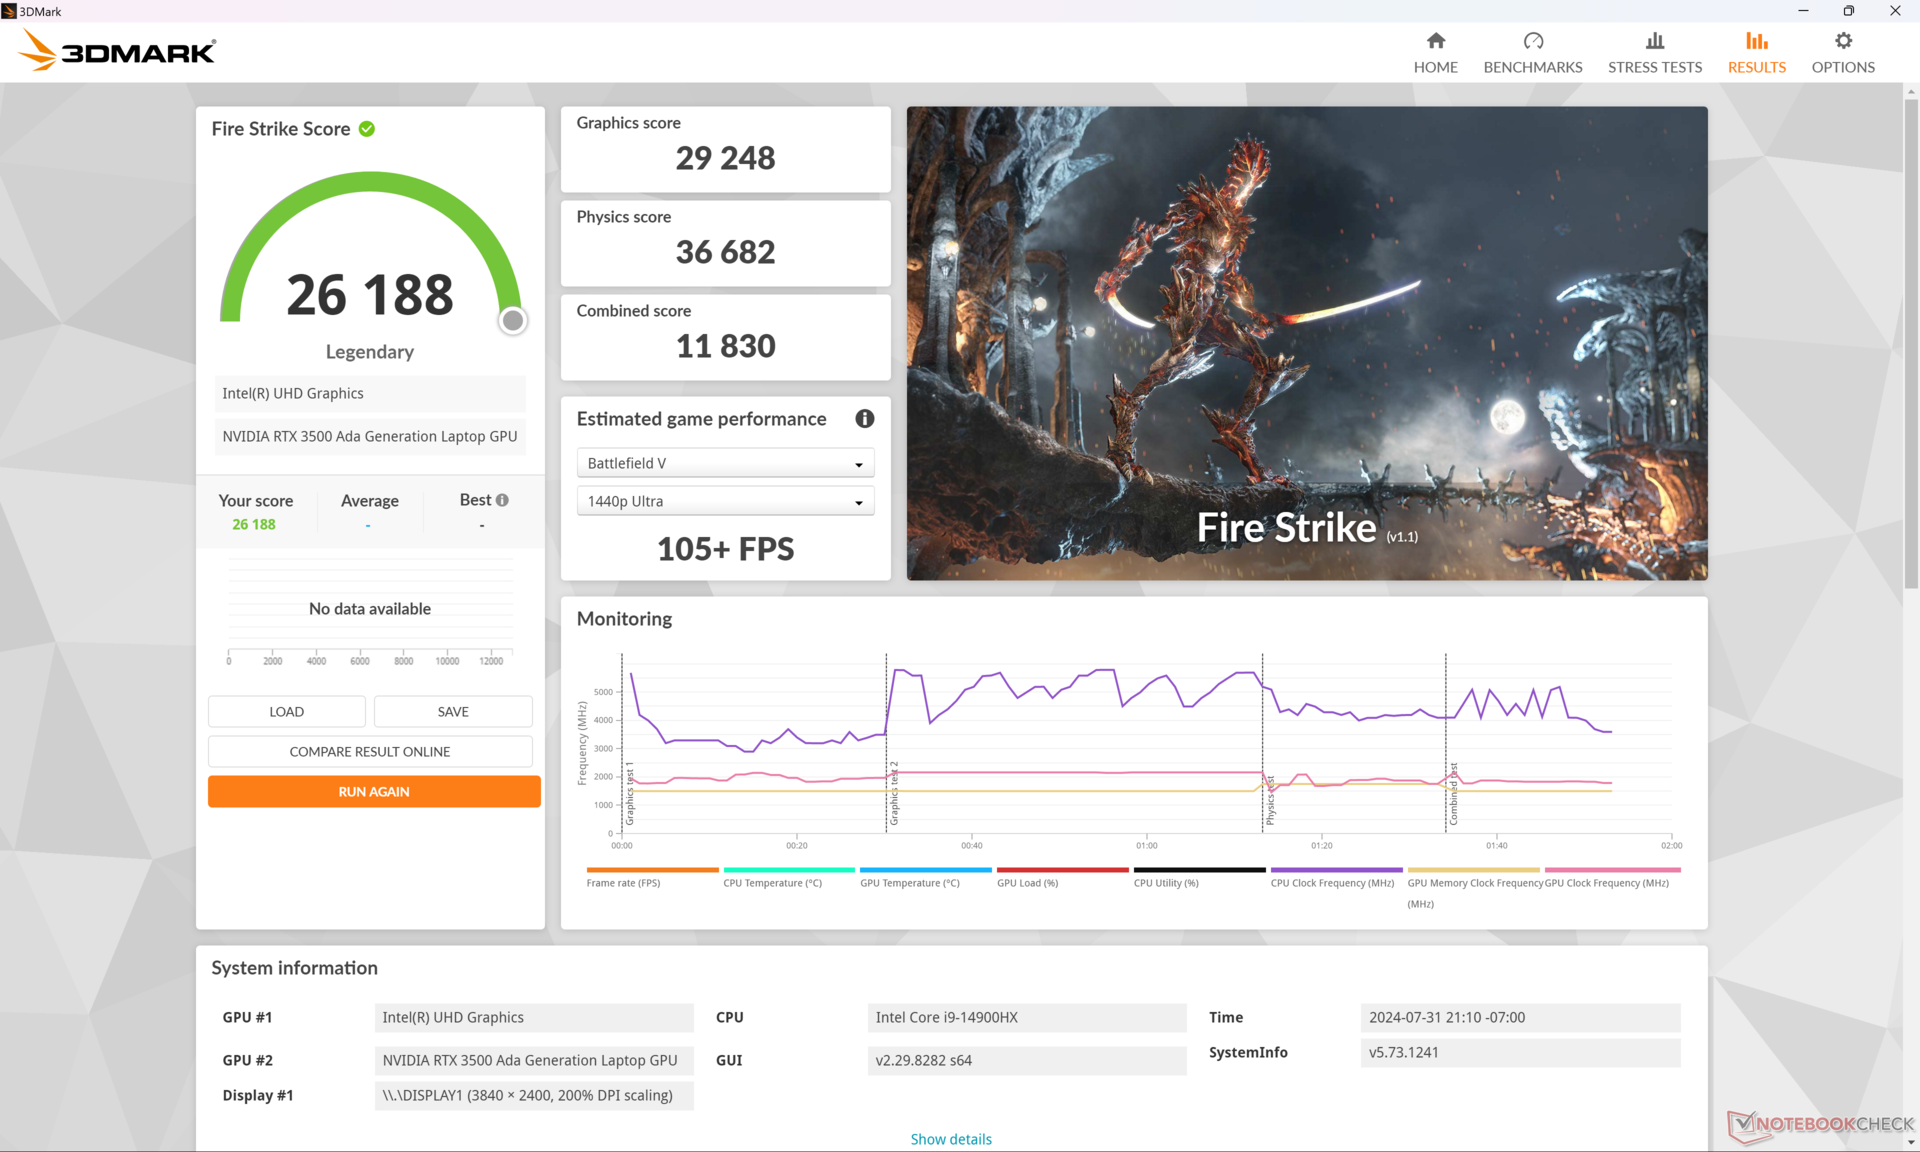
| Teljesítményprofil | Grafikai pontszám | Fizikai pontszám | Kombinált pontszám |
| Teljesítmény mód | 29248 | 36682 | 11830 |
| Kiegyensúlyozott mód | 28214 (-4%) | 33094 (-10%) | 10246 (-13%) |
| Akkumulátor teljesítmény | 16618 (-43%) | 25118 (-32%) | 4101 (-65%) |
A Teljesítmény üzemmód helyett a Kiegyensúlyozott üzemmódban történő futtatás 10-15 százalékkal befolyásolná a teljesítményt, amint azt a fenti Fire Strike táblázatunk is mutatja. A teljesítményhiány még nagyobb lesz, ha akkumulátorról működik, ami a legtöbb nagy teljesítményű laptop esetében várható.
| 3DMark Performance rating - Percent | |
| HP ZBook Fury 16 G10 -2! | |
| Dell Precision 5690 -2! | |
| Dell Precision 5000 5680 -2! | |
| HP ZBook Fury 16 G11 | |
| Átlagos NVIDIA RTX 3500 Ada Generation Laptop | |
| Lenovo ThinkPad P1 G6 21FV001KUS -2! | |
| Lenovo ThinkPad P1 G6-21FV000DGE -17! | |
| HP ZBook Fury 16 G9 -2! | |
| Lenovo ThinkPad P16 G2 21FA000FGE -17! | |
| MSI CreatorPro Z16P B12UKST -17! | |
| Asus ProArt Studiobook 16 OLED H7604 -17! | |
| Asus ExpertBook B6 Flip B6602FC2 -17! | |
| Lenovo ThinkPad P1 G4-20Y4S0KS00 -10! | |
| Lenovo ThinkPad P16v G1 AMD -17! | |
| 3DMark 11 - 1280x720 Performance GPU | |
| HP ZBook Fury 16 G10 | |
| Dell Precision 5000 5680 | |
| Dell Precision 5690 | |
| Lenovo ThinkPad P1 G6 21FV001KUS | |
| HP ZBook Fury 16 G11 | |
| Átlagos NVIDIA RTX 3500 Ada Generation Laptop (n=1) | |
| Asus ProArt Studiobook 16 OLED H7604 | |
| HP ZBook Fury 16 G9 | |
| Lenovo ThinkPad P16 G2 21FA000FGE | |
| Lenovo ThinkPad P1 G6-21FV000DGE | |
| Lenovo ThinkPad P1 G4-20Y4S0KS00 | |
| MSI CreatorPro Z16P B12UKST | |
| Asus ExpertBook B6 Flip B6602FC2 | |
| Lenovo ThinkPad P16v G1 AMD | |
| 3DMark | |
| 1920x1080 Fire Strike Graphics | |
| HP ZBook Fury 16 G10 | |
| Lenovo ThinkPad P1 G6 21FV001KUS | |
| Dell Precision 5000 5680 | |
| Dell Precision 5690 | |
| HP ZBook Fury 16 G11 | |
| Átlagos NVIDIA RTX 3500 Ada Generation Laptop (n=1) | |
| Asus ProArt Studiobook 16 OLED H7604 | |
| HP ZBook Fury 16 G9 | |
| Lenovo ThinkPad P16 G2 21FA000FGE | |
| Lenovo ThinkPad P1 G4-20Y4S0KS00 | |
| Lenovo ThinkPad P1 G6-21FV000DGE | |
| MSI CreatorPro Z16P B12UKST | |
| Asus ExpertBook B6 Flip B6602FC2 | |
| Lenovo ThinkPad P16v G1 AMD | |
| 2560x1440 Time Spy Graphics | |
| HP ZBook Fury 16 G10 | |
| Dell Precision 5000 5680 | |
| Dell Precision 5690 | |
| Lenovo ThinkPad P1 G6 21FV001KUS | |
| HP ZBook Fury 16 G11 | |
| Átlagos NVIDIA RTX 3500 Ada Generation Laptop (n=1) | |
| Asus ProArt Studiobook 16 OLED H7604 | |
| Lenovo ThinkPad P16 G2 21FA000FGE | |
| HP ZBook Fury 16 G9 | |
| Lenovo ThinkPad P1 G6-21FV000DGE | |
| Lenovo ThinkPad P1 G4-20Y4S0KS00 | |
| MSI CreatorPro Z16P B12UKST | |
| Asus ExpertBook B6 Flip B6602FC2 | |
| Lenovo ThinkPad P16v G1 AMD | |
| 3DMark 11 Performance | 34779 pontok | |
| 3DMark Fire Strike Score | 26188 pontok | |
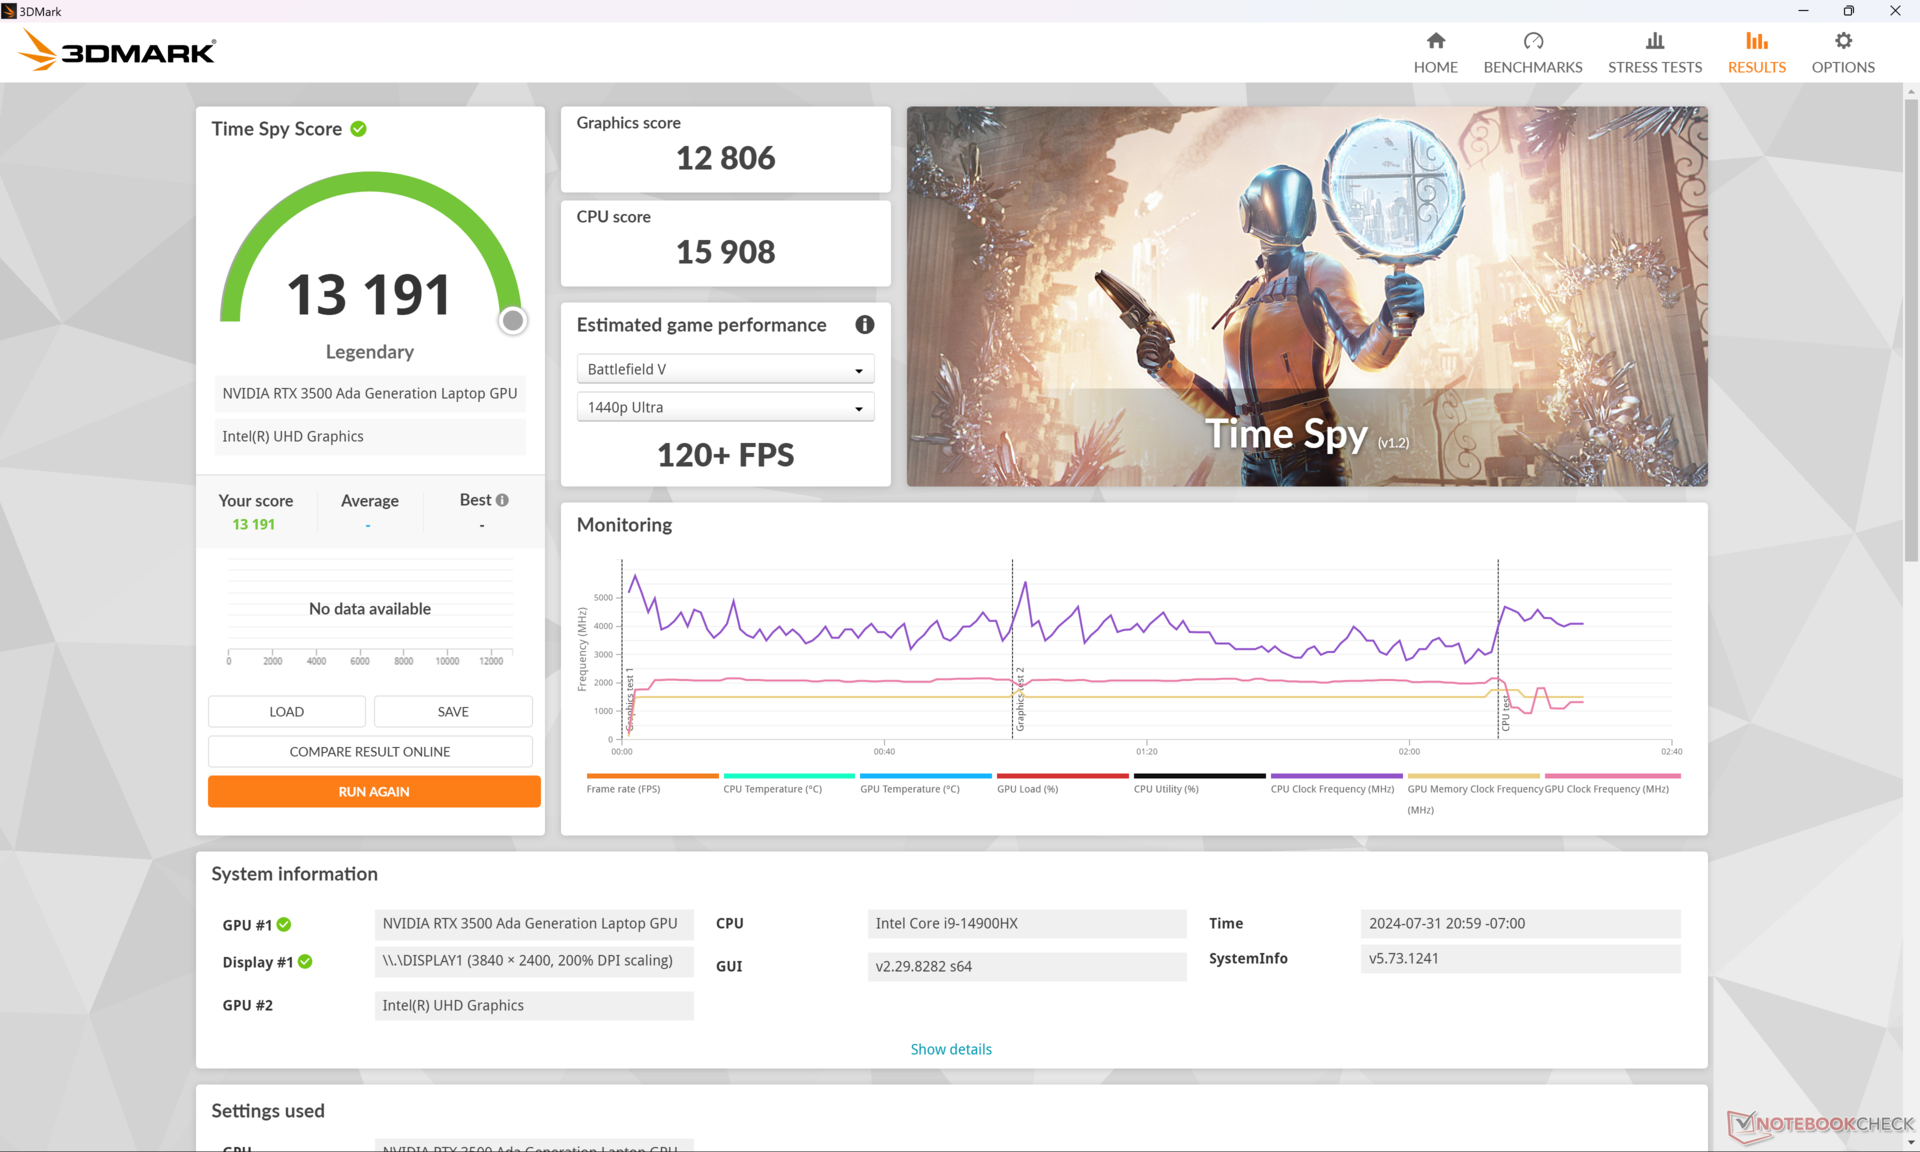
| 3DMark Time Spy Score | 13191 pontok | |
| 3DMark Steel Nomad Score | 2793 pontok | |
Segítség | ||
* ... a kisebb jobb
Játékteljesítmény
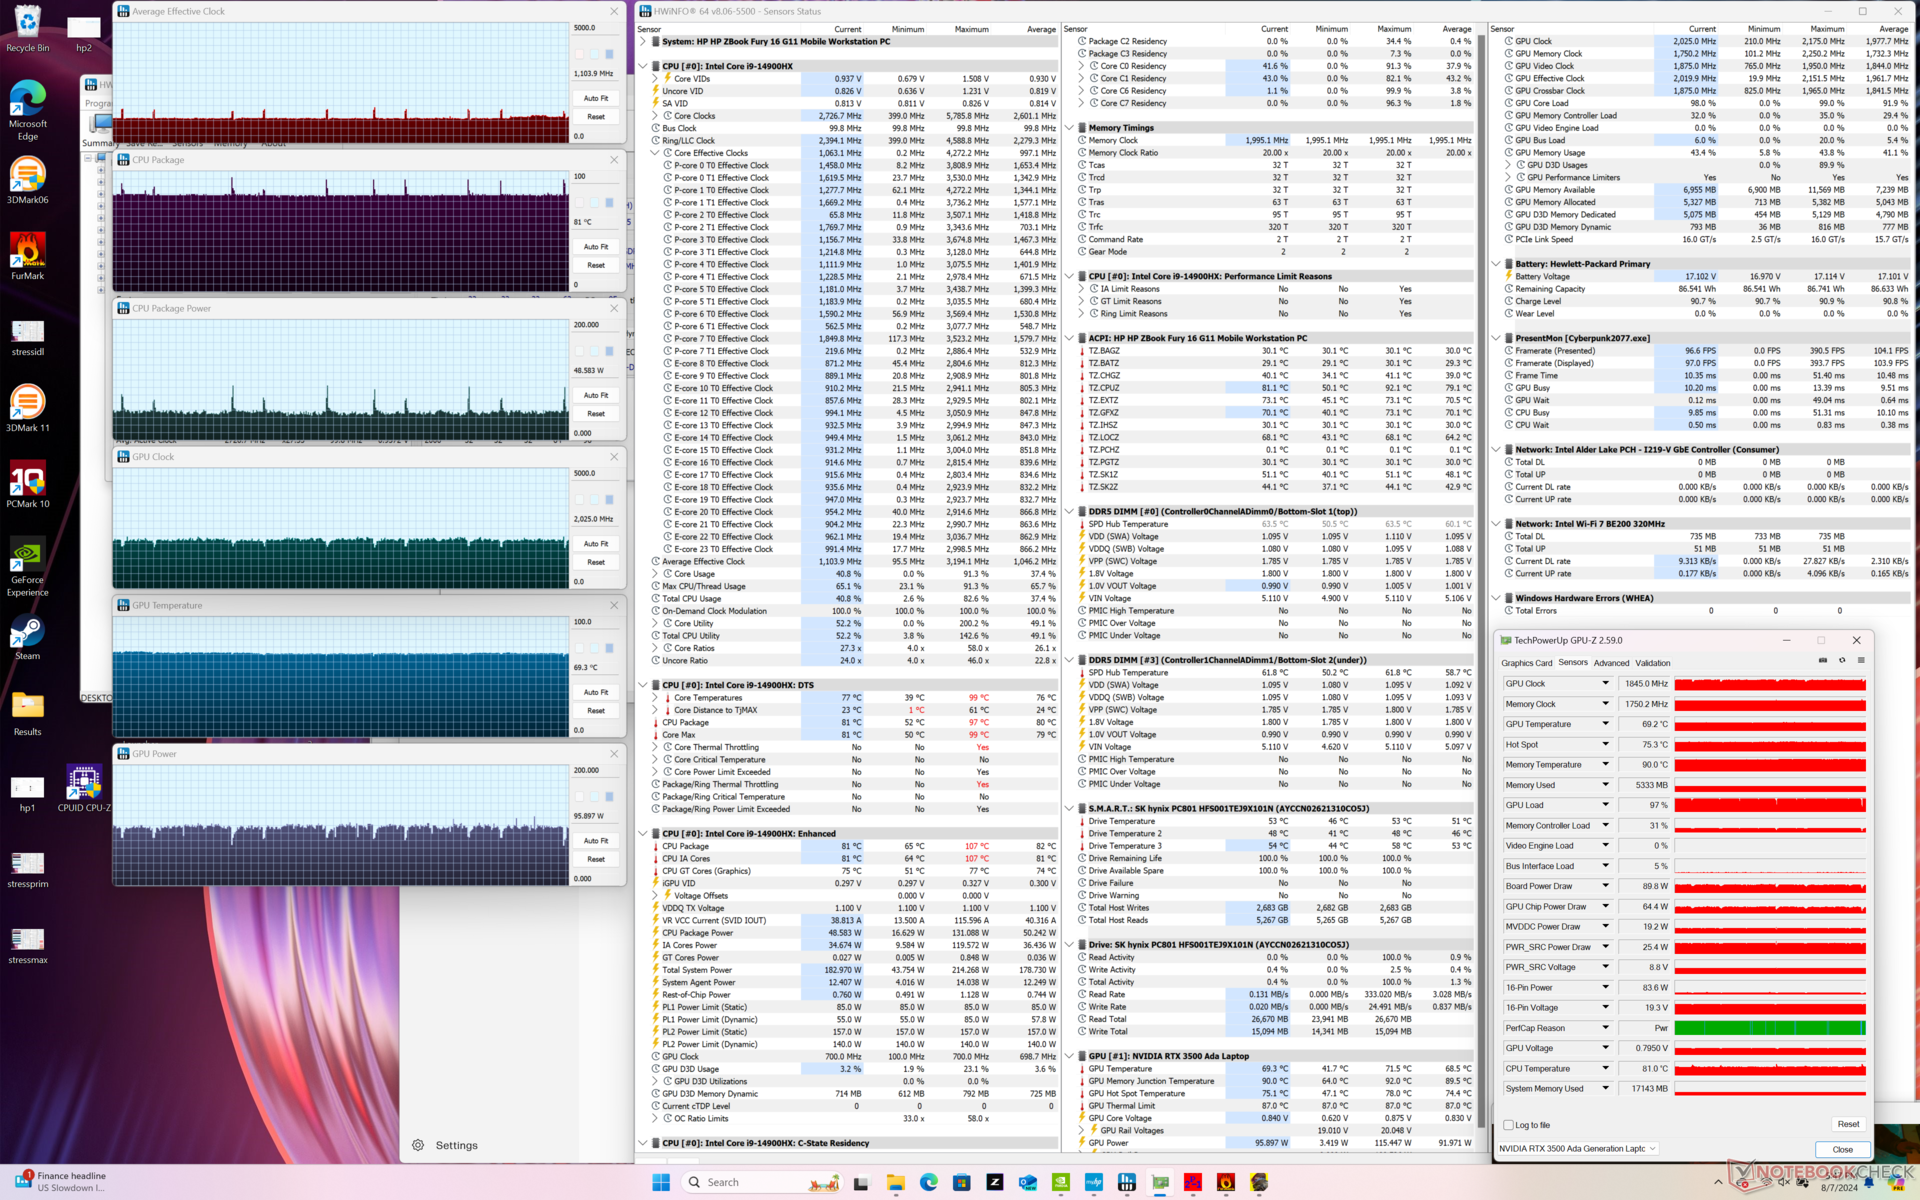
Bár nem játékra tervezték, az RTX 3500 Ada teljesítménye kissé meghaladja a mobil GeForce RTX 4070 de a mobil RTX 4080 alatt, különösen, ha az egyesített csővezetékek számát, a tenzormagokat és a memória-sávszélességet nézzük. A teljesítmény mindazonáltal idővel fokozatosan lassulhat, ha terhelésnek van kitéve, mivel a GPU boost sebessége nem korlátlan. A Cyberpunk 2077-en 1080p Ultra beállításokkal történő üresjáratban például a teljesítmény valamivel több mint 70 FPS-sel indul, majd 30 perc elteltével fokozatosan csökken az alacsony 60 FPS tartományba, ahogy az alábbi grafikonon is látható.
| Performance rating - Percent | |
| HP ZBook Fury 16 G10 -2! | |
| Lenovo ThinkPad P1 G6 21FV001KUS -1! | |
| HP ZBook Fury 16 G11 | |
| Asus ProArt Studiobook 16 OLED H7604 -1! | |
| Dell Precision 5690 -1! | |
| HP ZBook Fury 16 G9 -1! | |
| Lenovo ThinkPad P16 G2 21FA000FGE -1! | |
| GTA V - 1920x1080 Highest AA:4xMSAA + FX AF:16x | |
| Asus ProArt Studiobook 16 OLED H7604 | |
| Lenovo ThinkPad P1 G6 21FV001KUS | |
| HP ZBook Fury 16 G9 | |
| HP ZBook Fury 16 G11 | |
| Lenovo ThinkPad P16 G2 21FA000FGE | |
| Final Fantasy XV Benchmark - 1920x1080 High Quality | |
| HP ZBook Fury 16 G10 | |
| Lenovo ThinkPad P1 G6 21FV001KUS | |
| Dell Precision 5690 | |
| HP ZBook Fury 16 G11 | |
| Asus ProArt Studiobook 16 OLED H7604 | |
| HP ZBook Fury 16 G9 | |
| Lenovo ThinkPad P16 G2 21FA000FGE | |
| Strange Brigade - 1920x1080 ultra AA:ultra AF:16 | |
| HP ZBook Fury 16 G10 | |
| Dell Precision 5690 | |
| HP ZBook Fury 16 G11 | |
| HP ZBook Fury 16 G9 | |
| Lenovo ThinkPad P16 G2 21FA000FGE | |
| Asus ProArt Studiobook 16 OLED H7604 | |
| Dota 2 Reborn - 1920x1080 ultra (3/3) best looking | |
| Asus ProArt Studiobook 16 OLED H7604 | |
| HP ZBook Fury 16 G10 | |
| HP ZBook Fury 16 G11 | |
| HP ZBook Fury 16 G9 | |
| Lenovo ThinkPad P16 G2 21FA000FGE | |
| Lenovo ThinkPad P1 G6 21FV001KUS | |
| Dell Precision 5690 | |
| X-Plane 11.11 - 1920x1080 high (fps_test=3) | |
| Asus ProArt Studiobook 16 OLED H7604 | |
| HP ZBook Fury 16 G10 | |
| Lenovo ThinkPad P1 G6 21FV001KUS | |
| HP ZBook Fury 16 G11 | |
| HP ZBook Fury 16 G9 | |
| Lenovo ThinkPad P16 G2 21FA000FGE | |
| Dell Precision 5690 | |
| Cyberpunk 2077 - 1920x1080 Ultra Preset (FSR off) | |
| Dell Precision 5690 | |
| Lenovo ThinkPad P1 G6 21FV001KUS | |
| HP ZBook Fury 16 G11 | |
| Final Fantasy XV Benchmark | |
| 1920x1080 High Quality | |
| HP ZBook Fury 16 G10 | |
| Lenovo ThinkPad P1 G6 21FV001KUS | |
| Dell Precision 5690 | |
| HP ZBook Fury 16 G11 | |
| Átlagos NVIDIA RTX 3500 Ada Generation Laptop (n=1) | |
| Dell Precision 5000 5680 | |
| Asus ProArt Studiobook 16 OLED H7604 | |
| HP ZBook Fury 16 G9 | |
| Lenovo ThinkPad P16 G2 21FA000FGE | |
| Lenovo ThinkPad P1 G6-21FV000DGE | |
| MSI CreatorPro Z16P B12UKST | |
| Asus ExpertBook B6 Flip B6602FC2 | |
| Lenovo ThinkPad P16v G1 AMD | |
| 2560x1440 High Quality | |
| HP ZBook Fury 16 G10 | |
| Dell Precision 5690 | |
| Lenovo ThinkPad P1 G6 21FV001KUS | |
| Dell Precision 5000 5680 | |
| HP ZBook Fury 16 G11 | |
| Átlagos NVIDIA RTX 3500 Ada Generation Laptop (n=1) | |
| Asus ProArt Studiobook 16 OLED H7604 | |
| HP ZBook Fury 16 G9 | |
| Lenovo ThinkPad P1 G6-21FV000DGE | |
| Lenovo ThinkPad P16 G2 21FA000FGE | |
| Asus ExpertBook B6 Flip B6602FC2 | |
| MSI CreatorPro Z16P B12UKST | |
| 3840x2160 High Quality | |
| HP ZBook Fury 16 G10 | |
| Dell Precision 5690 | |
| Lenovo ThinkPad P1 G6 21FV001KUS | |
| Dell Precision 5000 5680 | |
| HP ZBook Fury 16 G11 | |
| Átlagos NVIDIA RTX 3500 Ada Generation Laptop (n=1) | |
| HP ZBook Fury 16 G9 | |
| X-Plane 11.11 | |
| 1920x1080 high (fps_test=3) | |
| Asus ProArt Studiobook 16 OLED H7604 | |
| HP ZBook Fury 16 G10 | |
| Lenovo ThinkPad P1 G6 21FV001KUS | |
| HP ZBook Fury 16 G11 | |
| Átlagos NVIDIA RTX 3500 Ada Generation Laptop (n=1) | |
| Lenovo ThinkPad P1 G6-21FV000DGE | |
| Asus ExpertBook B6 Flip B6602FC2 | |
| HP ZBook Fury 16 G9 | |
| Lenovo ThinkPad P16 G2 21FA000FGE | |
| Dell Precision 5000 5680 | |
| MSI CreatorPro Z16P B12UKST | |
| Dell Precision 5690 | |
| Lenovo ThinkPad P1 G4-20Y4S0KS00 | |
| Lenovo ThinkPad P16v G1 AMD | |
| 3840x2160 high (fps_test=3) | |
| Lenovo ThinkPad P1 G6 21FV001KUS | |
| HP ZBook Fury 16 G10 | |
| Asus ExpertBook B6 Flip B6602FC2 | |
| HP ZBook Fury 16 G11 | |
| Átlagos NVIDIA RTX 3500 Ada Generation Laptop (n=1) | |
| Dell Precision 5000 5680 | |
| HP ZBook Fury 16 G9 | |
| Dell Precision 5690 | |
| Lenovo ThinkPad P1 G4-20Y4S0KS00 | |
| Strange Brigade | |
| 1920x1080 ultra AA:ultra AF:16 | |
| HP ZBook Fury 16 G10 | |
| Dell Precision 5690 | |
| HP ZBook Fury 16 G11 | |
| Átlagos NVIDIA RTX 3500 Ada Generation Laptop (n=1) | |
| HP ZBook Fury 16 G9 | |
| Lenovo ThinkPad P16 G2 21FA000FGE | |
| Lenovo ThinkPad P1 G6-21FV000DGE | |
| Lenovo ThinkPad P1 G4-20Y4S0KS00 | |
| Asus ProArt Studiobook 16 OLED H7604 | |
| Asus ExpertBook B6 Flip B6602FC2 | |
| MSI CreatorPro Z16P B12UKST | |
| Lenovo ThinkPad P16v G1 AMD | |
| 2560x1440 ultra AA:ultra AF:16 | |
| HP ZBook Fury 16 G10 | |
| Dell Precision 5690 | |
| HP ZBook Fury 16 G11 | |
| Átlagos NVIDIA RTX 3500 Ada Generation Laptop (n=1) | |
| HP ZBook Fury 16 G9 | |
| Lenovo ThinkPad P1 G4-20Y4S0KS00 | |
| Lenovo ThinkPad P1 G6-21FV000DGE | |
| Lenovo ThinkPad P16 G2 21FA000FGE | |
| Asus ProArt Studiobook 16 OLED H7604 | |
| MSI CreatorPro Z16P B12UKST | |
| 3840x2160 ultra AA:ultra AF:16 | |
| Dell Precision 5690 | |
| HP ZBook Fury 16 G10 | |
| HP ZBook Fury 16 G11 | |
| Átlagos NVIDIA RTX 3500 Ada Generation Laptop (n=1) | |
| HP ZBook Fury 16 G9 | |
| Lenovo ThinkPad P1 G4-20Y4S0KS00 | |
| Tiny Tina's Wonderlands | |
| 1920x1080 High Preset (DX12) | |
| HP ZBook Fury 16 G10 | |
| Dell Precision 5000 5680 | |
| Dell Precision 5690 | |
| HP ZBook Fury 16 G11 | |
| Átlagos NVIDIA RTX 3500 Ada Generation Laptop (n=1) | |
| HP ZBook Fury 16 G9 | |
| Asus ExpertBook B6 Flip B6602FC2 | |
| 1920x1080 Badass Preset (DX12) | |
| HP ZBook Fury 16 G10 | |
| Dell Precision 5000 5680 | |
| Dell Precision 5690 | |
| Lenovo ThinkPad P1 G6 21FV001KUS | |
| HP ZBook Fury 16 G11 | |
| Átlagos NVIDIA RTX 3500 Ada Generation Laptop (n=1) | |
| HP ZBook Fury 16 G9 | |
| Asus ExpertBook B6 Flip B6602FC2 | |
| 2560x1440 Badass Preset (DX12) | |
| HP ZBook Fury 16 G10 | |
| Dell Precision 5000 5680 | |
| Dell Precision 5690 | |
| Lenovo ThinkPad P1 G6 21FV001KUS | |
| HP ZBook Fury 16 G11 | |
| Átlagos NVIDIA RTX 3500 Ada Generation Laptop (n=1) | |
| HP ZBook Fury 16 G9 | |
| Asus ExpertBook B6 Flip B6602FC2 | |
| 3840x2160 Badass Preset (DX12) | |
| HP ZBook Fury 16 G10 | |
| Dell Precision 5000 5680 | |
| Dell Precision 5690 | |
| Lenovo ThinkPad P1 G6 21FV001KUS | |
| HP ZBook Fury 16 G11 | |
| Átlagos NVIDIA RTX 3500 Ada Generation Laptop (n=1) | |
| HP ZBook Fury 16 G9 | |
| Baldur's Gate 3 | |
| 1920x1080 Ultra Preset AA:T | |
| Dell Precision 5690 | |
| Lenovo ThinkPad P1 G6 21FV001KUS | |
| HP ZBook Fury 16 G11 | |
| Átlagos NVIDIA RTX 3500 Ada Generation Laptop (n=1) | |
| 2560x1440 Ultra Preset AA:T | |
| Dell Precision 5690 | |
| Lenovo ThinkPad P1 G6 21FV001KUS | |
| HP ZBook Fury 16 G11 | |
| Átlagos NVIDIA RTX 3500 Ada Generation Laptop (n=1) | |
| 3840x2160 Ultra Preset AA:T | |
| Dell Precision 5690 | |
| Lenovo ThinkPad P1 G6 21FV001KUS | |
| HP ZBook Fury 16 G11 | |
| Átlagos NVIDIA RTX 3500 Ada Generation Laptop (n=1) | |
Cyberpunk 2077 ultra FPS Chart
| alacsony | közepes | magas | ultra | QHD | 4K | |
|---|---|---|---|---|---|---|
| GTA V (2015) | 184.3 | 181 | 170.1 | 115.5 | 97.5 | 59.6 |
| Dota 2 Reborn (2015) | 201 | 177.7 | 162.1 | 153.9 | 134.4 | |
| Final Fantasy XV Benchmark (2018) | 200 | 167.6 | 128.9 | 97.5 | 54.2 | |
| X-Plane 11.11 (2018) | 144.6 | 137.8 | 110.9 | 92.7 | ||
| Far Cry 5 (2018) | 133 | 135 | 127 | 109 | 62 | |
| Strange Brigade (2018) | 411 | 296 | 235 | 223 | 159.2 | 78.6 |
| Tiny Tina's Wonderlands (2022) | 232.5 | 195.4 | 137.9 | 109.3 | 74.4 | 41.6 |
| F1 22 (2022) | 228 | 223 | 182.8 | 72.9 | 48.3 | 24 |
| Baldur's Gate 3 (2023) | 164.8 | 136.2 | 118.6 | 117.3 | 80.2 | 41.2 |
| Cyberpunk 2077 (2023) | 121.2 | 113.1 | 101.8 | 90.3 | 60.2 | 21.3 |
Kibocsátás
Rendszerzaj
A ventilátor zaja és viselkedése nagyjából megegyezik azzal, amit a tavalyi modellnél rögzítettünk, ha nem is kissé hangosabb nagyobb terhelésnél. A ventilátorok időnként még akkor is pulzáltak, amikor az asztali gépen üresjáratban voltak, még akkor is, ha kiegyensúlyozott üzemmódba voltak állítva, és nem futott alkalmazás. Ami még rosszabb, hogy a mi konkrét készülékünk a tekercs érezhető nyöszörgésétől szenved, amely a teljes tesztidőszak alatt fennállt.
Zajszint
| Üresjárat |
| 23.2 / 23.2 / 29.5 dB(A) |
| Terhelés |
| 43 / 48.2 dB(A) |
 | ||
30 dB csendes 40 dB(A) hallható 50 dB(A) hangos |
||
min: | ||
| HP ZBook Fury 16 G11 RTX 3500 Ada Generation Laptop, i9-14900HX, SK hynix PC801 HFS001TEJ9X101N | HP ZBook Fury 16 G10 RTX 5000 Ada Generation Laptop, i9-13950HX, SK hynix PC801 HFS001TEJ9X101N | HP ZBook Fury 16 G9 RTX A5500 Laptop GPU, i9-12950HX, Micron 3400 1TB MTFDKBA1T0TFH | Dell Precision 5690 RTX 5000 Ada Generation Laptop, Ultra 9 185H, 2x Samsung PM9A1 1TB (RAID 0) | Lenovo ThinkPad P16 G2 21FA000FGE RTX 2000 Ada Generation Laptop, i7-13700HX, SK hynix PC801 HFS001TEJ9X162N | Lenovo ThinkPad P1 G6 21FV001KUS GeForce RTX 4080 Laptop GPU, i7-13800H, Kioxia XG8 KXG8AZNV1T02 | Asus ProArt Studiobook 16 OLED H7604 GeForce RTX 4070 Laptop GPU, i9-13980HX, Phison EM2804TBMTCB47 | |
|---|---|---|---|---|---|---|---|
| Noise | 3% | 4% | -3% | -4% | 9% | -5% | |
| off / környezet * (dB) | 23.2 | 22.9 1% | 22.6 3% | 23.4 -1% | 23.5 -1% | 22.5 3% | 24.5 -6% |
| Idle Minimum * (dB) | 23.2 | 22.9 1% | 22.7 2% | 23.6 -2% | 23.5 -1% | 22.5 3% | 24.5 -6% |
| Idle Average * (dB) | 23.2 | 22.9 1% | 22.7 2% | 24.9 -7% | 29.2 -26% | 22.5 3% | 24.5 -6% |
| Idle Maximum * (dB) | 29.5 | 28.5 3% | 28.8 2% | 30.9 -5% | 29.5 -0% | 22.5 24% | 24.5 17% |
| Load Average * (dB) | 43 | 40.6 6% | 36.2 16% | 40.4 6% | 32.7 24% | 28.7 33% | 47.6 -11% |
| Cyberpunk 2077 ultra * (dB) | 48.2 | ||||||
| Load Maximum * (dB) | 48.2 | 45.8 5% | 49.3 -2% | 51.9 -8% | 56.6 -17% | 54.4 -13% | 56.7 -18% |
| Witcher 3 ultra * (dB) | 44.1 | 49.5 | 48.3 | 50.6 | 47.5 | 55.9 |
* ... a kisebb jobb
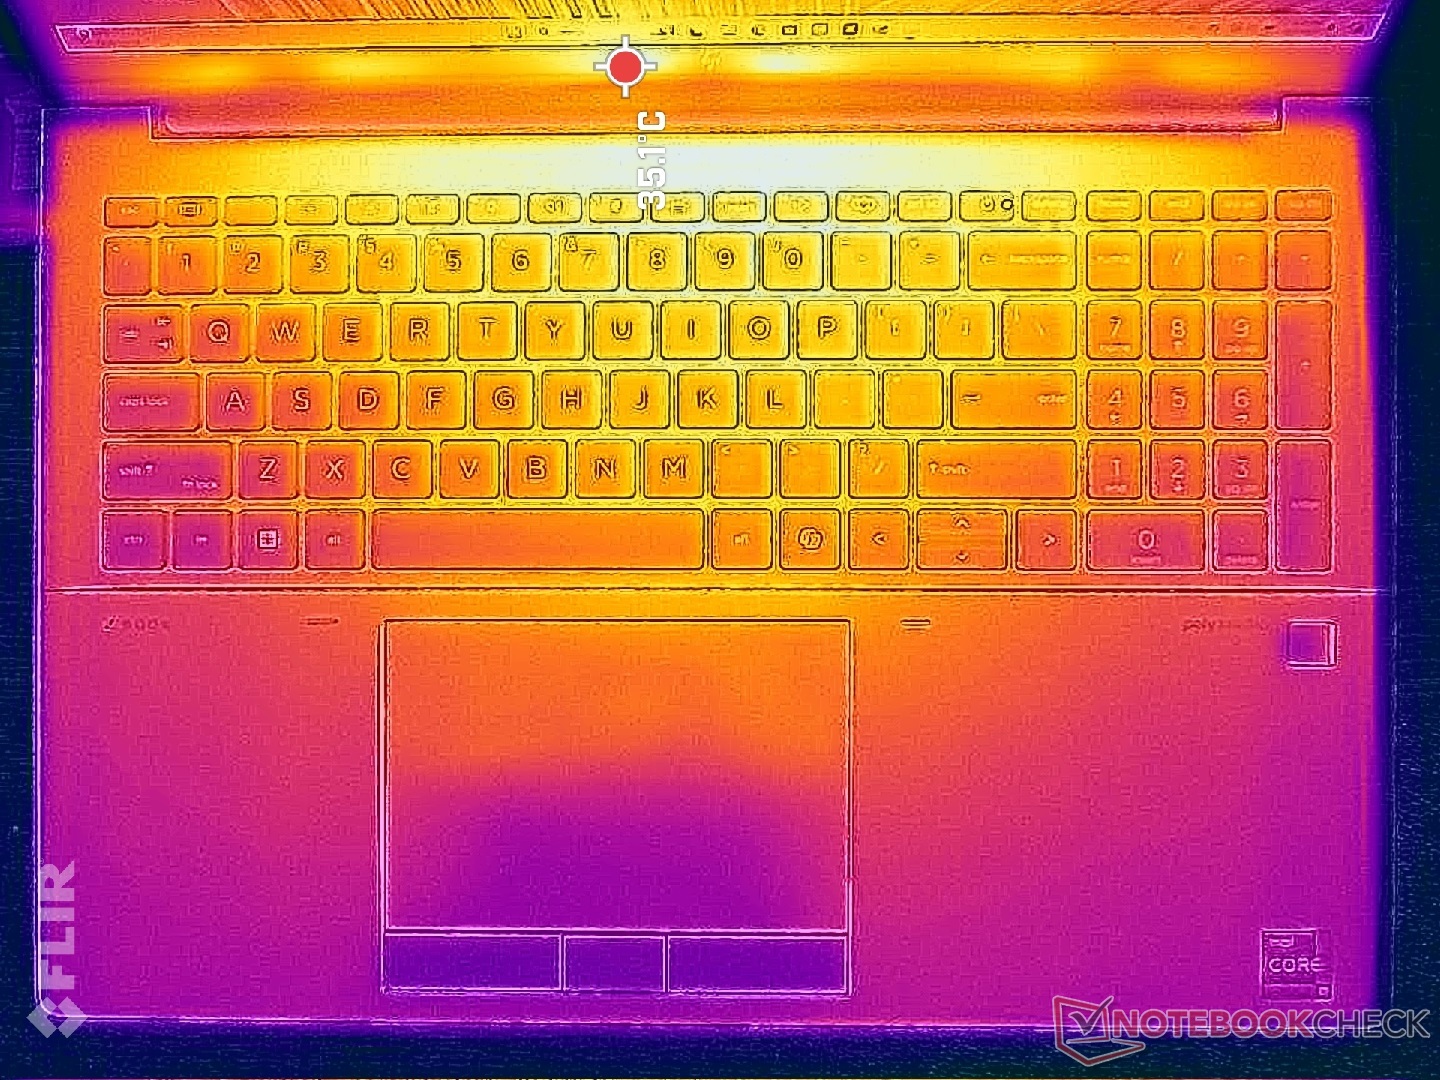
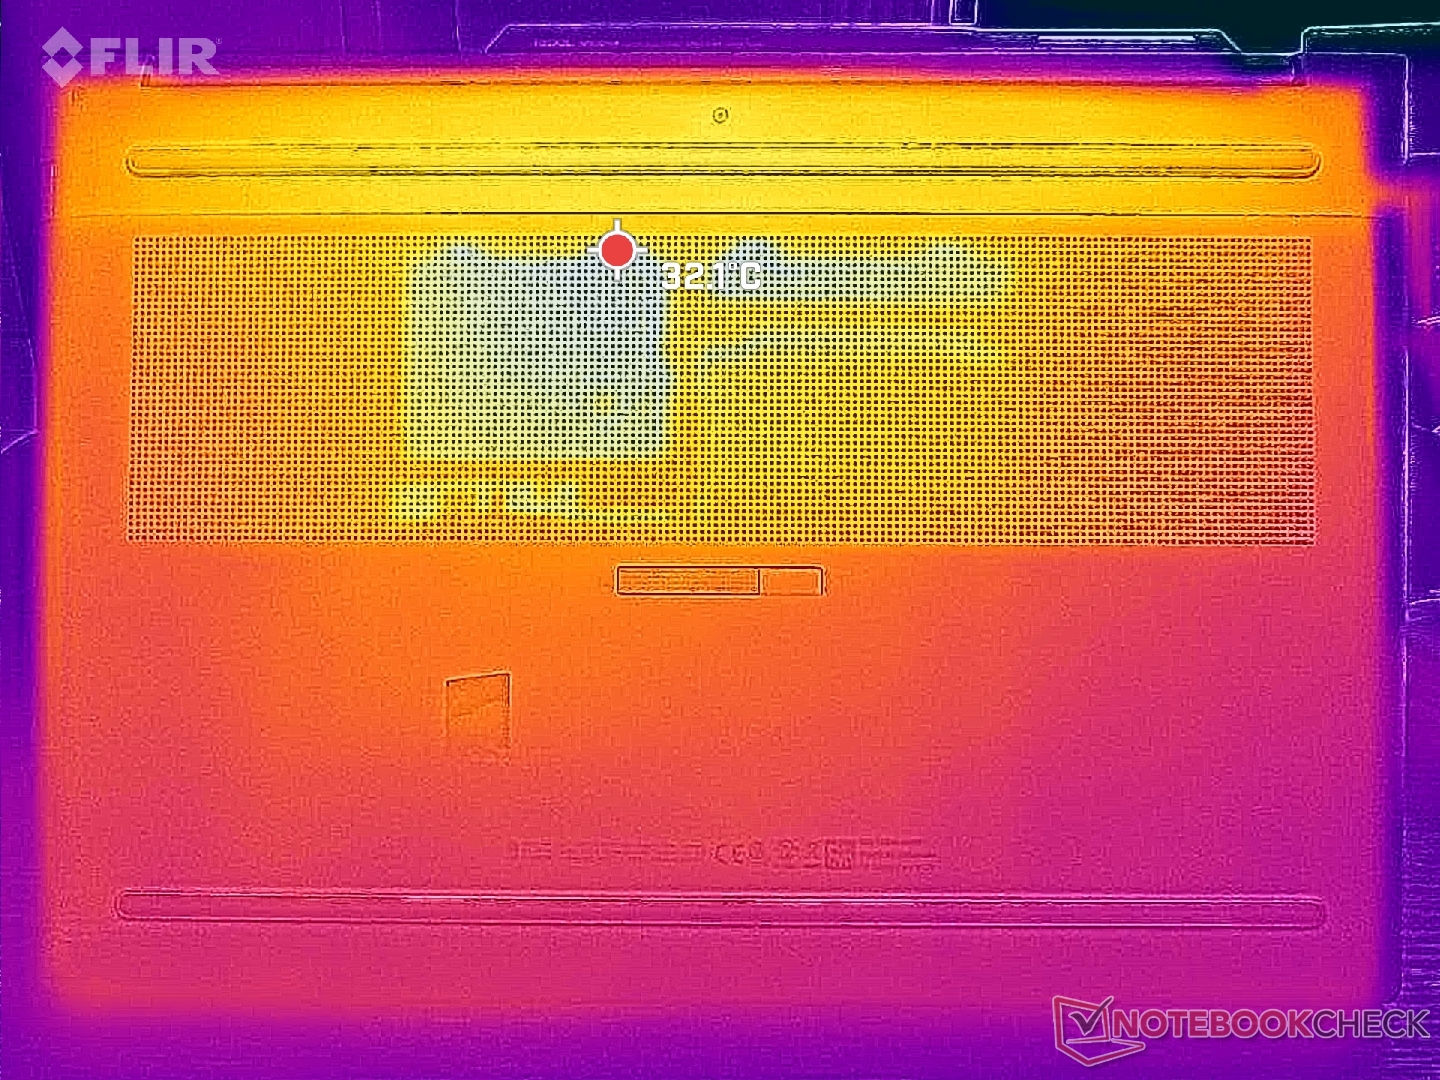
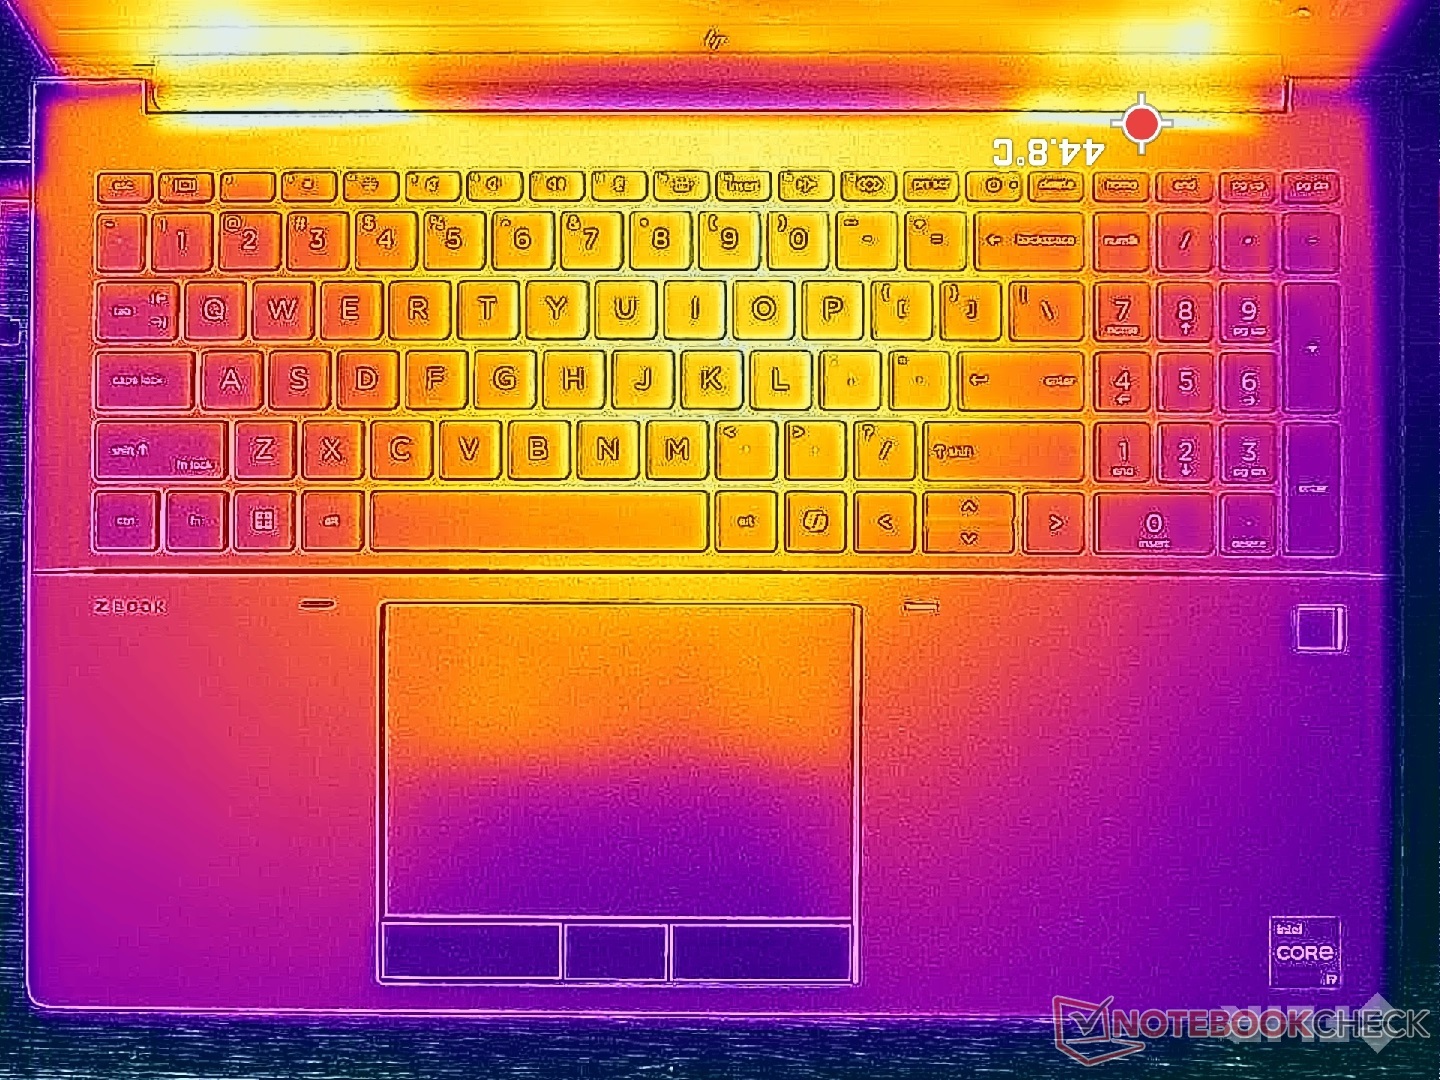
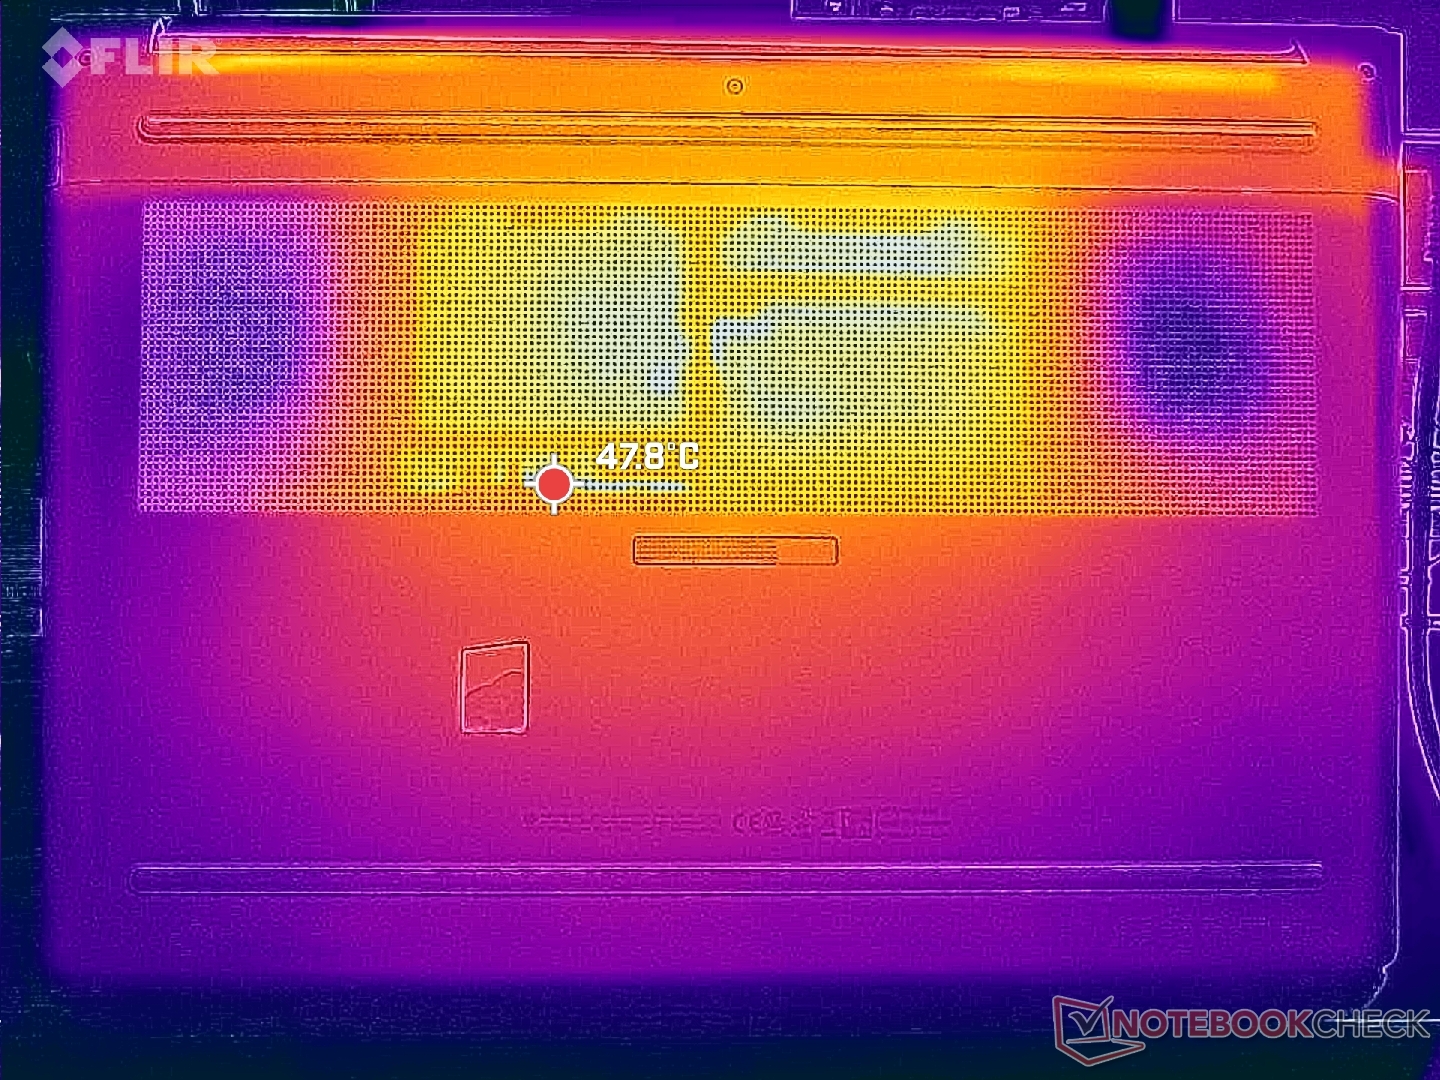
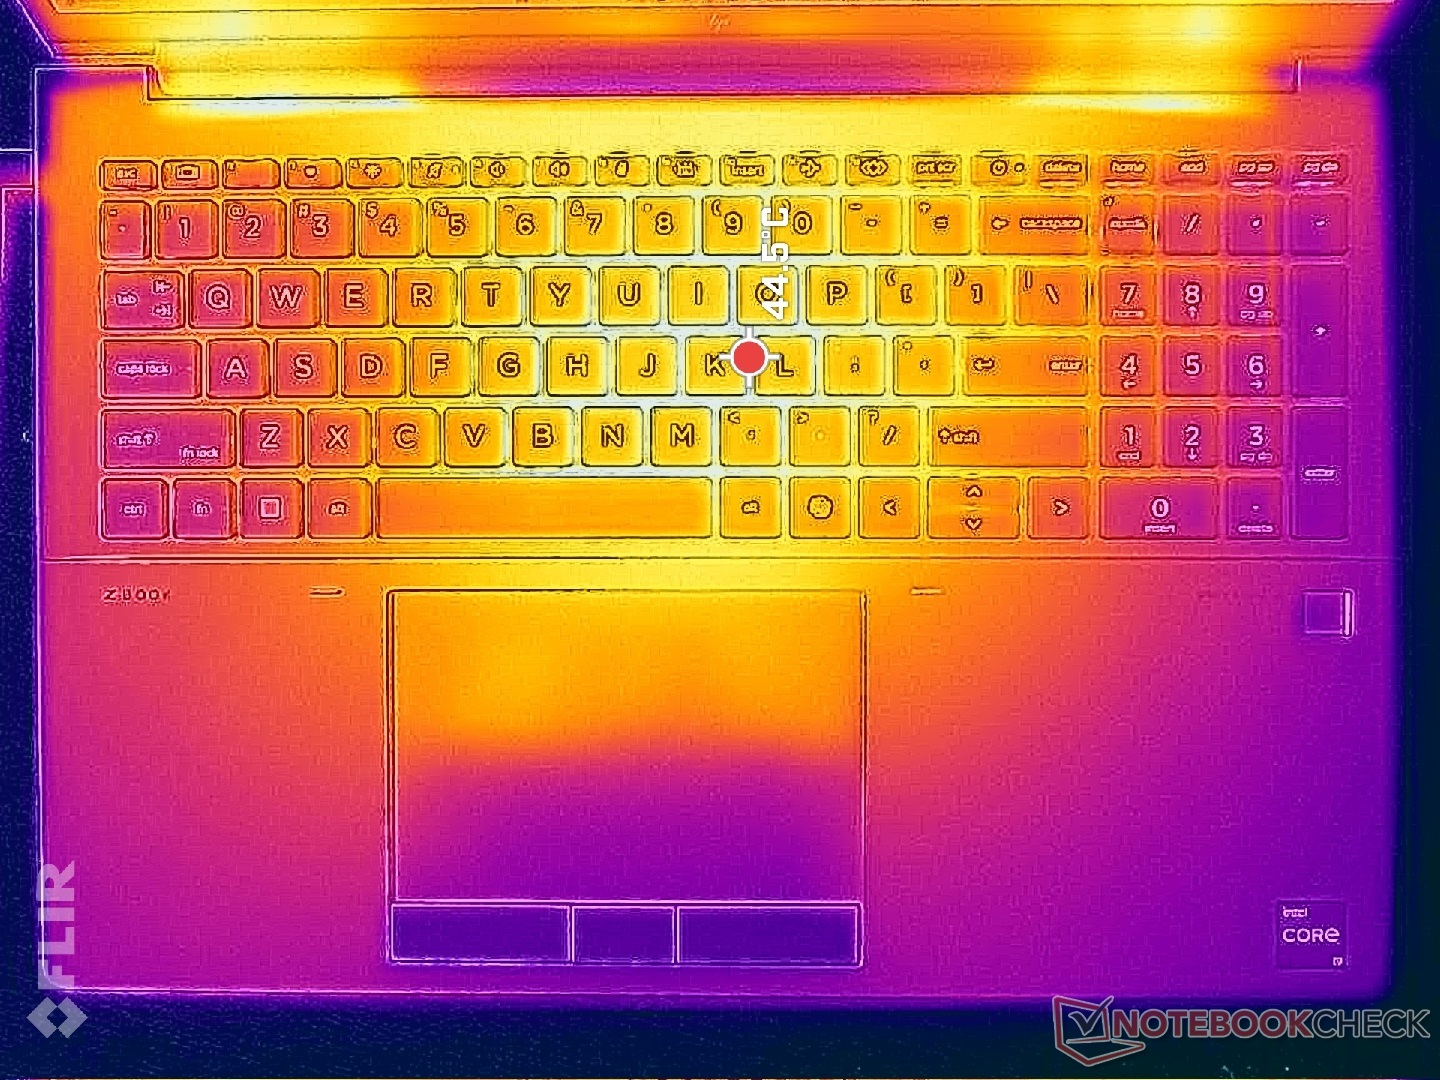
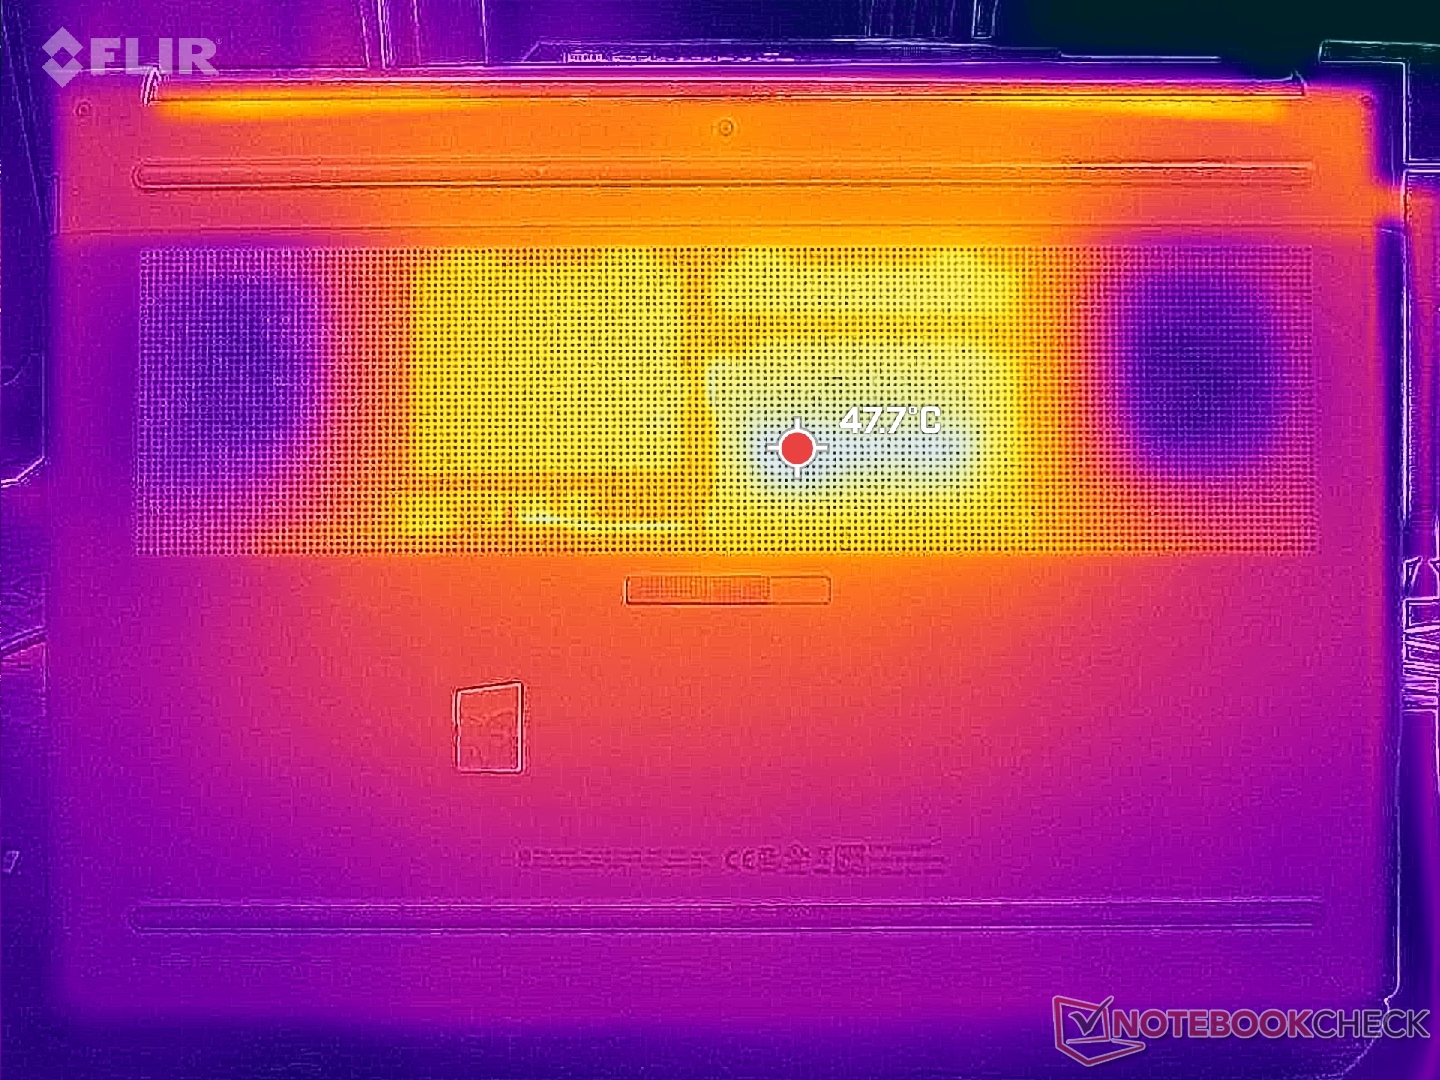
Hőmérséklet
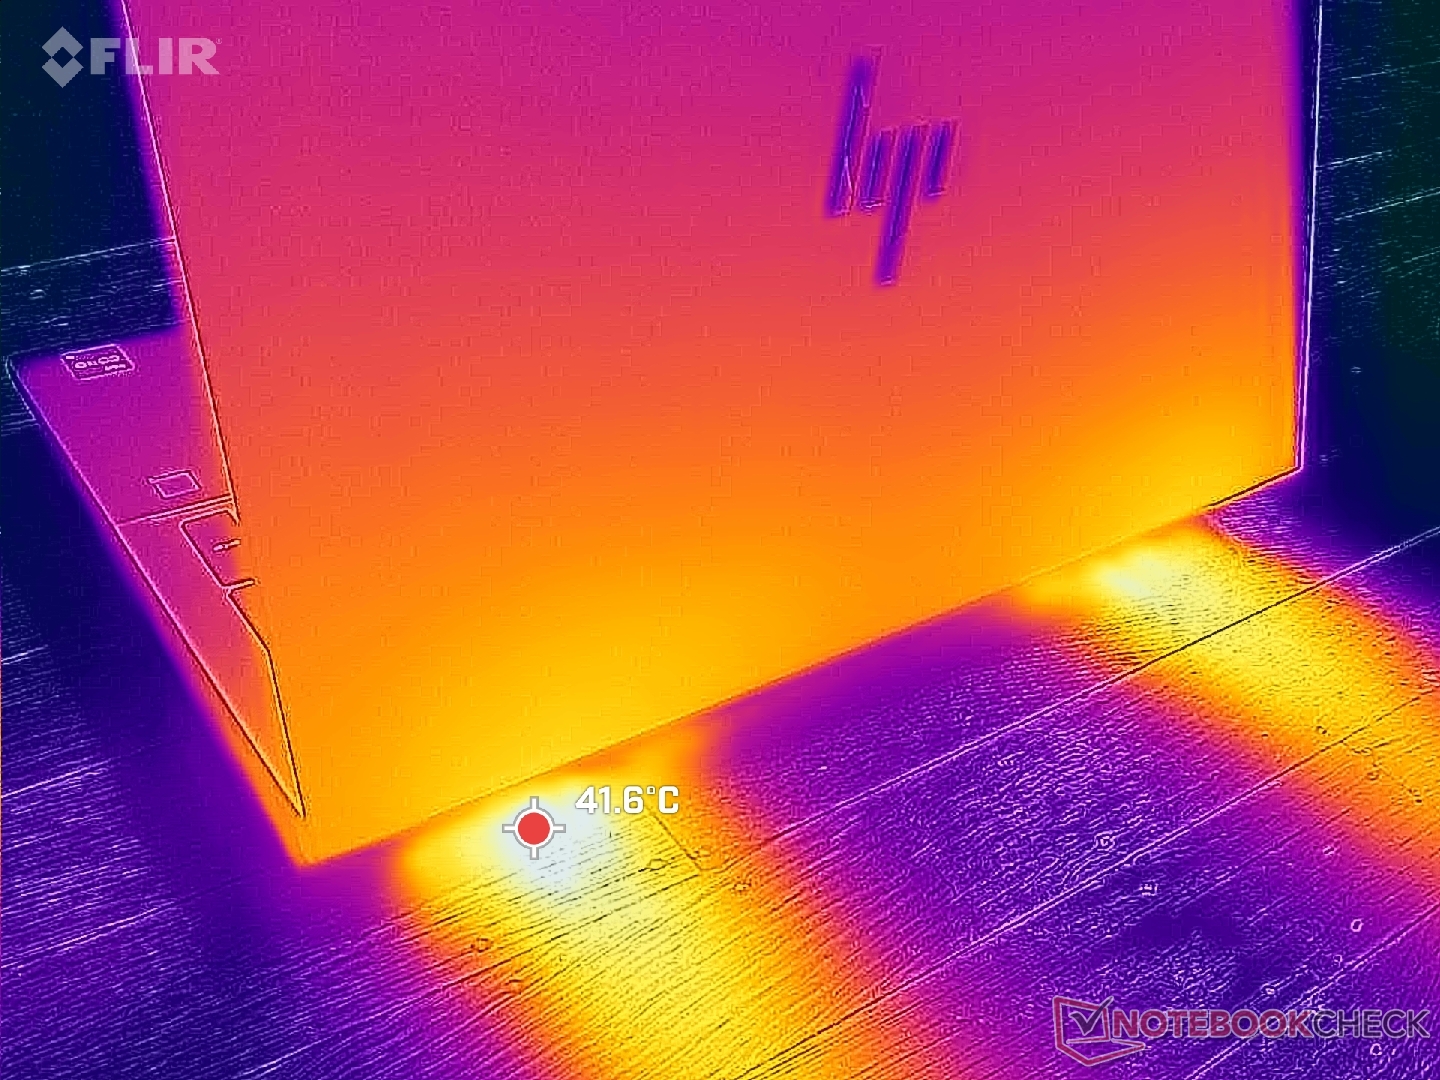
(±) A felső oldalon a maximális hőmérséklet 42.2 °C / 108 F, összehasonlítva a 38.2 °C / 101 F átlagával , 22.2 és 69.8 °C között a Workstation osztálynál.
(-) Az alsó maximum 48 °C / 118 F-ig melegszik fel, összehasonlítva a 41.1 °C / 106 F átlagával
(±) Üresjáratban a felső oldal átlagos hőmérséklete 33.8 °C / 93 F, összehasonlítva a 32 °C / ### eszközátlaggal class_avg_f### F.
(-) 3: The average temperature for the upper side is 38.5 °C / 101 F, compared to the average of 32 °C / 90 F for the class Workstation.
(±) A csuklótámasz és az érintőpad tapintásra nagyon felforrósodhat, maximum 37.6 °C / 99.7 F.
(-) A hasonló eszközök csuklótámasz területének átlagos hőmérséklete 27.8 °C / 82 F volt (-9.8 °C / -17.7 F).
| HP ZBook Fury 16 G11 Intel Core i9-14900HX, NVIDIA RTX 3500 Ada Generation Laptop | HP ZBook Fury 16 G10 Intel Core i9-13950HX, NVIDIA RTX 5000 Ada Generation Laptop | HP ZBook Fury 16 G9 Intel Core i9-12950HX, NVIDIA RTX A5500 Laptop GPU | Dell Precision 5690 Intel Core Ultra 9 185H, NVIDIA RTX 5000 Ada Generation Laptop | Lenovo ThinkPad P16 G2 21FA000FGE Intel Core i7-13700HX, NVIDIA RTX 2000 Ada Generation Laptop | Lenovo ThinkPad P1 G6 21FV001KUS Intel Core i7-13800H, NVIDIA GeForce RTX 4080 Laptop GPU | Asus ProArt Studiobook 16 OLED H7604 Intel Core i9-13980HX, NVIDIA GeForce RTX 4070 Laptop GPU | |
|---|---|---|---|---|---|---|---|
| Heat | 3% | 10% | 13% | 15% | 4% | 3% | |
| Maximum Upper Side * (°C) | 42.2 | 44.8 -6% | 43.2 -2% | 46.6 -10% | 47.2 -12% | 42 -0% | 44.1 -5% |
| Maximum Bottom * (°C) | 48 | 50 -4% | 50.4 -5% | 33 31% | 39.5 18% | 45.2 6% | 48 -0% |
| Idle Upper Side * (°C) | 37 | 34.4 7% | 28.6 23% | 32.4 12% | 28.1 24% | 33 11% | 32.7 12% |
| Idle Bottom * (°C) | 36.8 | 31.8 14% | 28.2 23% | 29.4 20% | 25.3 31% | 37 -1% | 34.9 5% |
* ... a kisebb jobb
Hangszórók
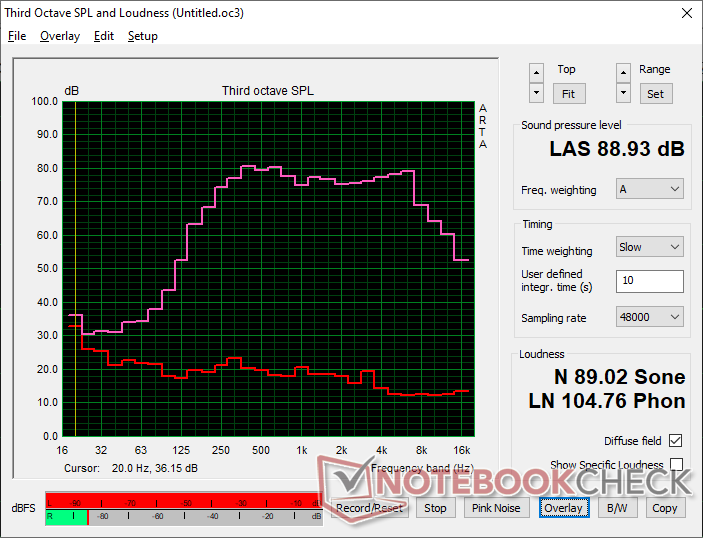
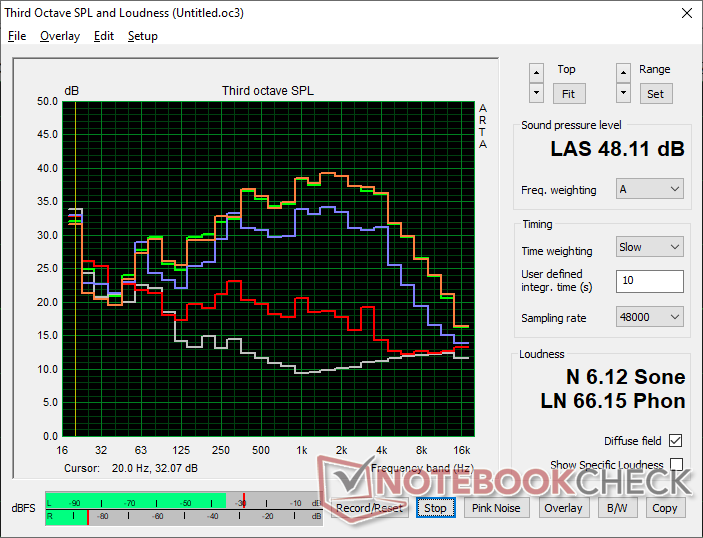
HP ZBook Fury 16 G11 hangelemzés
(+) | a hangszórók viszonylag hangosan tudnak játszani (88.9 dB)
Basszus 100 - 315 Hz
(±) | csökkentett basszus – átlagosan 13.3%-kal alacsonyabb, mint a medián
(±) | a basszus linearitása átlagos (11.2% delta az előző frekvenciához)
Közepes 400-2000 Hz
(+) | kiegyensúlyozott középpontok – csak 2.2% választja el a mediántól
(+) | a középpontok lineárisak (3.2% delta az előző frekvenciához)
Maximum 2-16 kHz
(+) | kiegyensúlyozott csúcsok – csak 3.7% választja el a mediántól
(+) | a csúcsok lineárisak (4.6% delta az előző frekvenciához képest)
Összességében 100 - 16.000 Hz
(+) | általános hangzás lineáris (12.9% eltérés a mediánhoz képest)
Ugyanazon osztályhoz képest
» 21%Ebben az osztályban az összes tesztelt eszköz %-a jobb volt, 6% hasonló, 72%-kal rosszabb
» A legjobb delta értéke 7%, az átlag 17%, a legrosszabb 35% volt
Az összes tesztelt eszközzel összehasonlítva
» 12% az összes tesztelt eszköz jobb volt, 3% hasonló, 85%-kal rosszabb
» A legjobb delta értéke 4%, az átlag 24%, a legrosszabb 134% volt
Apple MacBook Pro 16 2021 M1 Pro hangelemzés
(+) | a hangszórók viszonylag hangosan tudnak játszani (84.7 dB)
Basszus 100 - 315 Hz
(+) | jó basszus – csak 3.8% választja el a mediántól
(+) | a basszus lineáris (5.2% delta az előző frekvenciához)
Közepes 400-2000 Hz
(+) | kiegyensúlyozott középpontok – csak 1.3% választja el a mediántól
(+) | a középpontok lineárisak (2.1% delta az előző frekvenciához)
Maximum 2-16 kHz
(+) | kiegyensúlyozott csúcsok – csak 1.9% választja el a mediántól
(+) | a csúcsok lineárisak (2.7% delta az előző frekvenciához képest)
Összességében 100 - 16.000 Hz
(+) | általános hangzás lineáris (4.6% eltérés a mediánhoz képest)
Ugyanazon osztályhoz képest
» 0%Ebben az osztályban az összes tesztelt eszköz %-a jobb volt, 0% hasonló, 100%-kal rosszabb
» A legjobb delta értéke 5%, az átlag 17%, a legrosszabb 45% volt
Az összes tesztelt eszközzel összehasonlítva
» 0% az összes tesztelt eszköz jobb volt, 0% hasonló, 100%-kal rosszabb
» A legjobb delta értéke 4%, az átlag 24%, a legrosszabb 134% volt
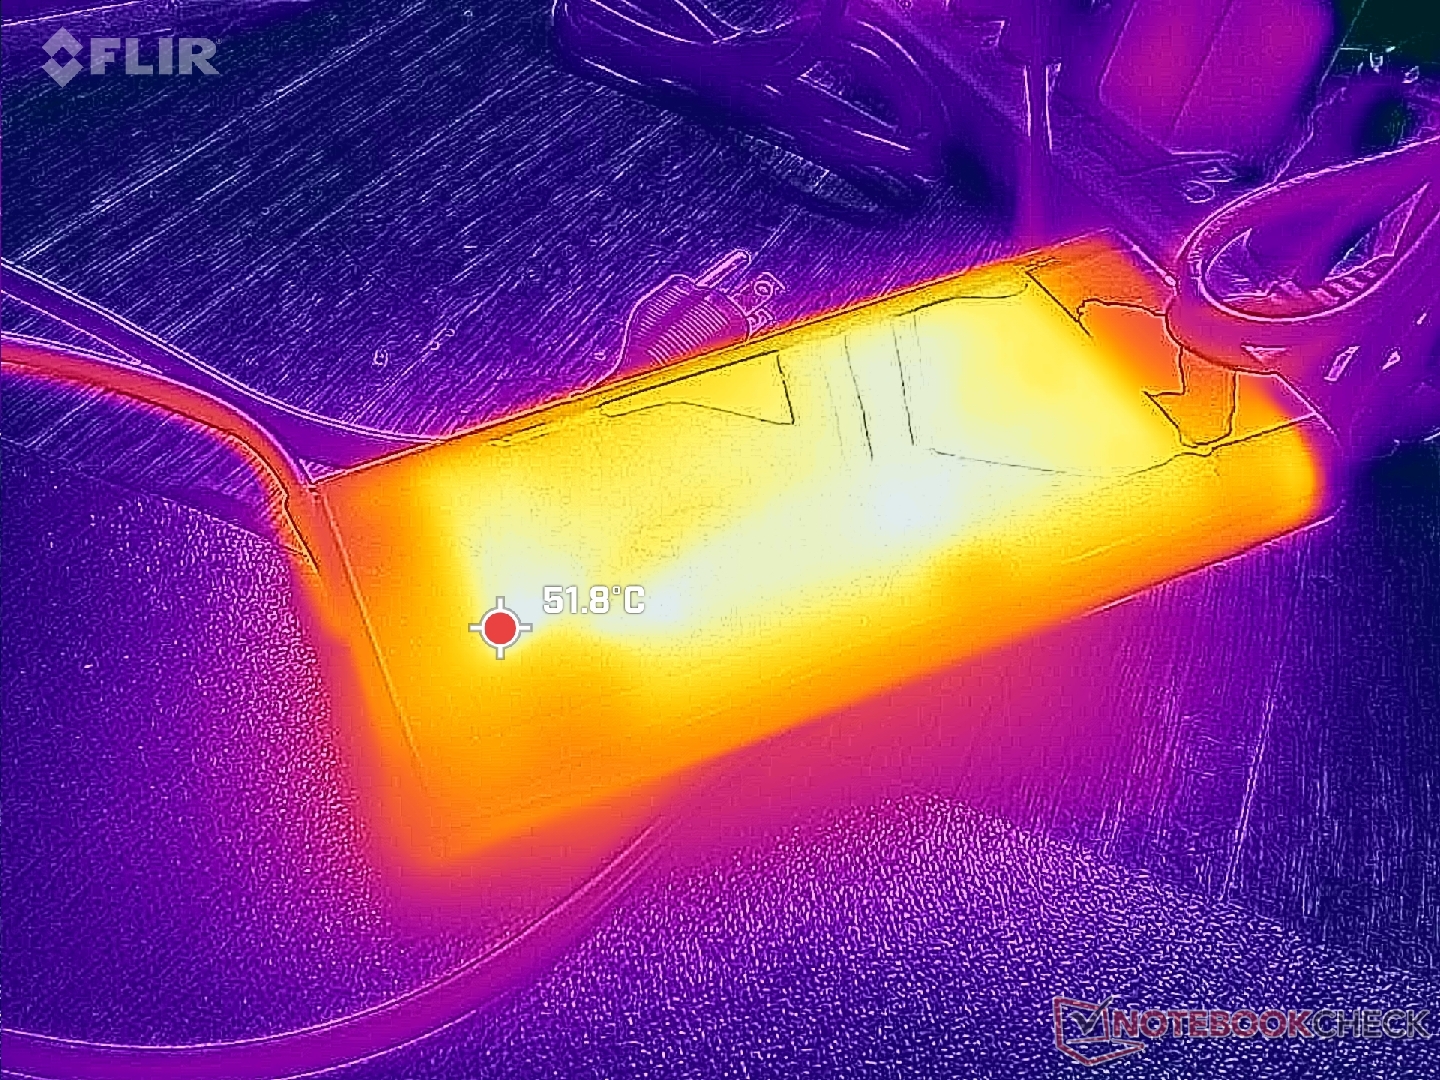
Energiagazdálkodás
Energiafogyasztás
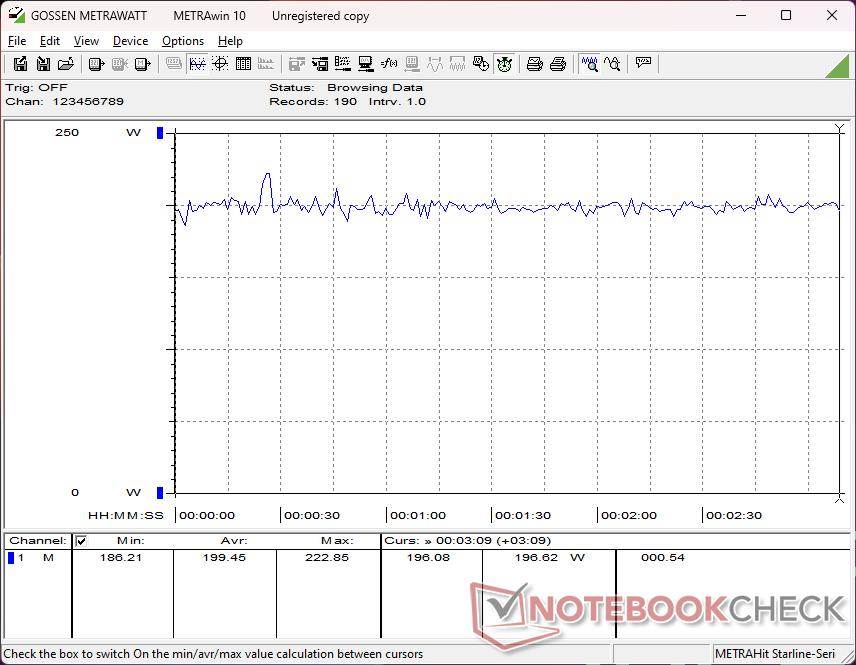
A rendszer hatékonyabb, amikor az asztali számítógépen üresjáratban van, mint a mi ZBook Fury 16 G10 konfigurációnkkal. Egyébként a fogyasztás közel azonos lesz, amikor nagyobb igénybevételt jelentő terhelést, például játékokat futtatunk, annak ellenére, hogy a konfigurált GPU-k különböznek a két példánk között. Az egy wattra jutó teljesítmény tehát növekszik, ha a magasabb kategóriájú GPU-konfigurációkat választjuk a középkategóriás RTX 3500 Ada-hoz képest.
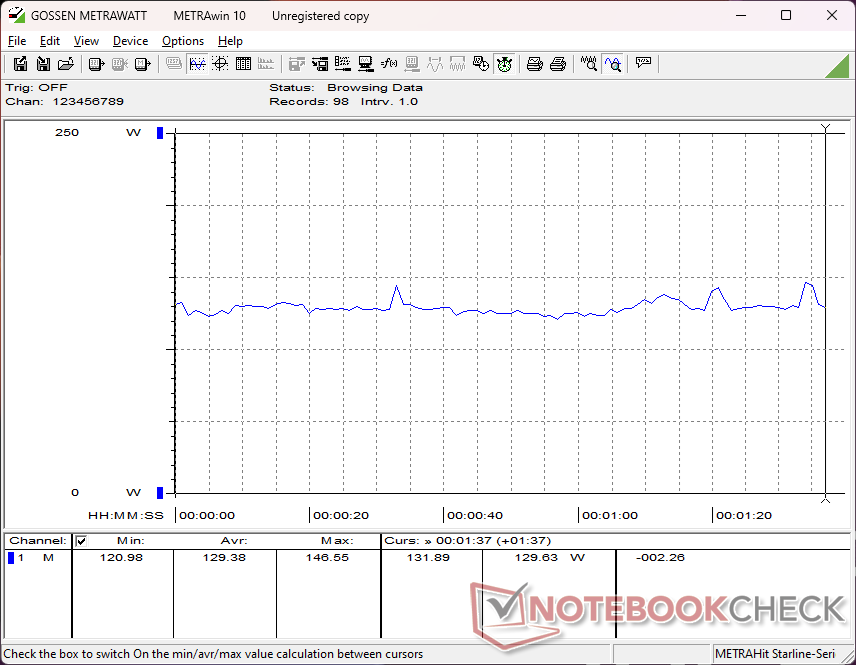
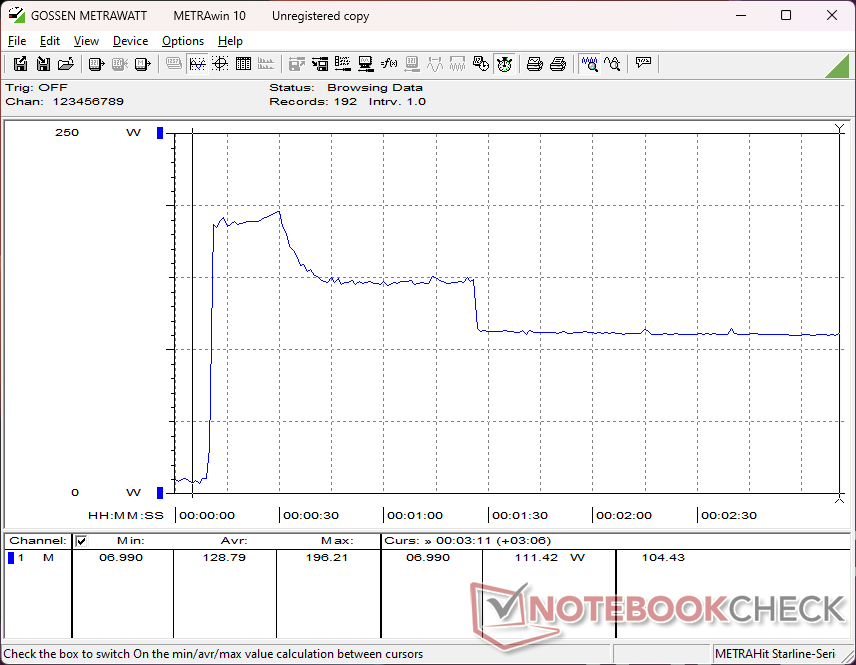
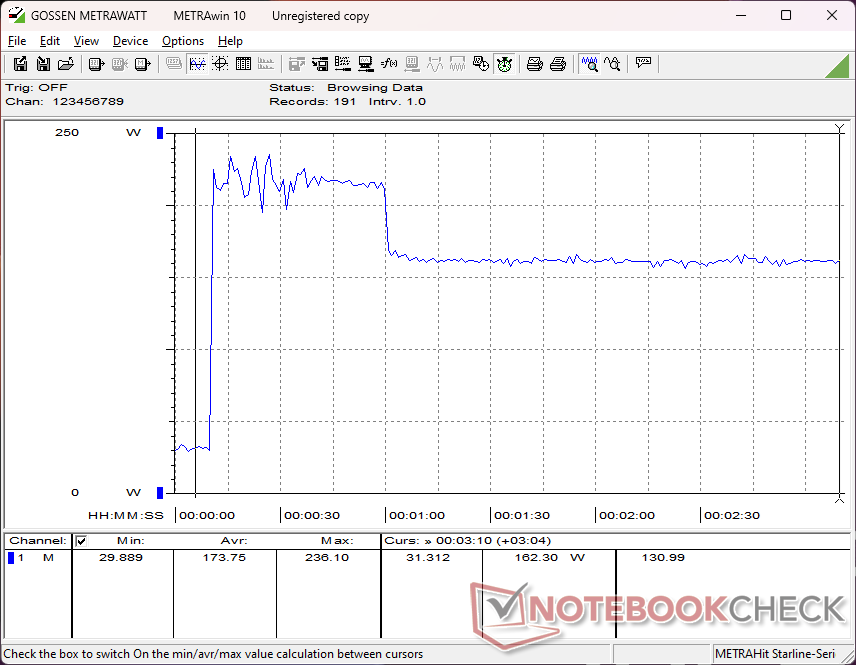
A Prime95 vagy a CineBench R15 xT futtatása során a fogyasztás a mi készülékünkön érezhetően magasabb lenne a tavalyi modellhez képest, a Core i9-14900HX processzorunk nagyobb Turbo Boost potenciálja miatt. Körülbelül egy perc elteltével azonban a fogyasztás lecsökken, és majdnem megegyezik a tavalyi modellen mért értékkel, amint azt az alábbi összehasonlító grafikon is mutatja, amely összhangban van a CineBench R15 xT ciklus fenti megfigyeléseivel. A magasabb kezdeti Turbo Boost-potenciálunk tehát a legfontosabb előny az újabb Core i9-14900HX és a régebbi Core i9-13950HX között.
A nagyméretű (~18 x 8,8 x 2,5 cm) 230 W-os hálózati adapterrel 236 W-os maximális fogyasztást tudunk rögzíteni, amikor a CPU és a GPU egyenként 100 százalékos kihasználtságon van.
| Kikapcsolt állapot / Készenlét | |
| Üresjárat | |
| Terhelés |
|
Kulcs:
min: | |
| HP ZBook Fury 16 G11 i9-14900HX, RTX 3500 Ada Generation Laptop, SK hynix PC801 HFS001TEJ9X101N, IPS, 3840x2400, 16" | HP ZBook Fury 16 G10 i9-13950HX, RTX 5000 Ada Generation Laptop, SK hynix PC801 HFS001TEJ9X101N, IPS, 3840x2400, 16" | HP ZBook Fury 16 G9 i9-12950HX, RTX A5500 Laptop GPU, Micron 3400 1TB MTFDKBA1T0TFH, IPS, 3840x2400, 16" | Dell Precision 5690 Ultra 9 185H, RTX 5000 Ada Generation Laptop, 2x Samsung PM9A1 1TB (RAID 0), OLED, 3840x2400, 16" | Lenovo ThinkPad P16 G2 21FA000FGE i7-13700HX, RTX 2000 Ada Generation Laptop, SK hynix PC801 HFS001TEJ9X162N, IPS LED, 2560x1600, 16" | Lenovo ThinkPad P1 G6 21FV001KUS i7-13800H, GeForce RTX 4080 Laptop GPU, Kioxia XG8 KXG8AZNV1T02, OLED, 3480x2400, 16" | Asus ProArt Studiobook 16 OLED H7604 i9-13980HX, GeForce RTX 4070 Laptop GPU, Phison EM2804TBMTCB47, OLED, 3200x2000, 16" | |
|---|---|---|---|---|---|---|---|
| Power Consumption | -34% | -77% | -1% | 4% | 7% | -24% | |
| Idle Minimum * (Watt) | 8.6 | 15.3 -78% | 19.5 -127% | 7.9 8% | 9.3 -8% | 8 7% | 12.8 -49% |
| Idle Average * (Watt) | 14.8 | 18.2 -23% | 29 -96% | 12 19% | 14.1 5% | 9.5 36% | 19.9 -34% |
| Idle Maximum * (Watt) | 15.7 | 28 -78% | 40.7 -159% | 28.6 -82% | 15.5 1% | 23.7 -51% | 20.3 -29% |
| Load Average * (Watt) | 129.4 | 137.9 -7% | 142.1 -10% | 98.8 24% | 133.6 -3% | 97.2 25% | 131.4 -2% |
| Cyberpunk 2077 ultra external monitor * (Watt) | 192.6 | ||||||
| Cyberpunk 2077 ultra * (Watt) | 199.4 | ||||||
| Load Maximum * (Watt) | 236.1 | 202 14% | 224.4 5% | 174.8 26% | 179.6 24% | 197.2 16% | 246.8 -5% |
| Witcher 3 ultra * (Watt) | 189.4 | 188.6 | 144.5 | 144.9 | 144 | 196.5 |
* ... a kisebb jobb
Power Consumption Cyberpunk / Stress Test
Power Consumption external Monitor
Az akkumulátor élettartama
A futási idők nagyon hasonlóak a tavalyi ZBook Fury 16 G11-hez, ha nem is valamivel rövidebbek, valószínűleg a Raptor Lake-HX Refresh CPU magasabb Turbo Boost felső határa miatt. A konkurens modellek, például a Precision 5690 vagy a ThinkPad P16 G2 legalább egy órával tovább bírják az összehasonlítást.
A töltés üres állapotból a teljes kapacitásig a mellékelt hordozható hálózati adapterrel viszonylag gyorsan, alig több mint 60 perc alatt történik.
| HP ZBook Fury 16 G11 i9-14900HX, RTX 3500 Ada Generation Laptop, 95 Wh | HP ZBook Fury 16 G10 i9-13950HX, RTX 5000 Ada Generation Laptop, 95 Wh | HP ZBook Fury 16 G9 i9-12950HX, RTX A5500 Laptop GPU, 95 Wh | Dell Precision 5690 Ultra 9 185H, RTX 5000 Ada Generation Laptop, 98 Wh | Lenovo ThinkPad P16 G2 21FA000FGE i7-13700HX, RTX 2000 Ada Generation Laptop, 94 Wh | Lenovo ThinkPad P1 G6 21FV001KUS i7-13800H, GeForce RTX 4080 Laptop GPU, 90 Wh | Asus ProArt Studiobook 16 OLED H7604 i9-13980HX, GeForce RTX 4070 Laptop GPU, 90 Wh | |
|---|---|---|---|---|---|---|---|
| Akkumulátor üzemidő | 9% | -10% | 37% | 28% | -37% | -16% | |
| WiFi v1.3 (h) | 6.7 | 7.3 9% | 6 -10% | 9.2 37% | 8.6 28% | 4.2 -37% | 5.6 -16% |
| Reader / Idle (h) | 5.3 | ||||||
| Load (h) | 1.2 | 1.1 | |||||
| H.264 (h) | 6 |
Pro
Kontra
Ítélet - Erős dizájn, amit a korlátozott turbófeltöltés ront le
Nagyon tetszik a ZBook Fury 16 G11 kialakítása. Bár ugyanaz maradt, mint a Fury 16 G9, a könnyű szervizelhetőség, a széleskörű konfigurálhatóság, az ECC RAM-támogatás, valamint a kényelmes billentyűzet és érintőpad minden szempontból megfelel a munkaállomás-felhasználóknak.
Ehelyett a ZBook Fury 16 G11 fő problémái a teljesítményében rejlenek. Amikor egy másik laptop, mint a Lenovo Legion 9 16IRX9 pontosan ugyanazt a Core i9-14900HX CPU-t akár 20 százalékkal gyorsabban tudja futtatni, mint a mi ZBookunk, akkor a HP hűtési megoldására mindenképpen ráférne egy frissítés, hogy hosszabb ideig támogassa a magasabb Turbo Boost sebességet. Hasonlóképpen az M.2-es SSD-knek is jól jönnének a hőelosztók ugyanezen okból, hiszen terheléskor ők is gázt adnának. Ezek a korlátozások a Core i9 CPU és a PCIe4 SSD előnyeit csorbítják, mivel potenciálisan gyorsabban teljesíthetnek a Dell vagy a Lenovo konkurens gépeinél.
A ZBook Fury 16 G11 csak egy kisebb frissítés a tavalyi ZBook Fury G10-hez képest. Bár még mindig jól néz ki és jól érzi magát, a teljesítmény hajlamos a nehezebb használati forgatókönyvek esetén a gázadásra.
Végül pedig kissé sajnálatos, hogy a modell nem kínál Meteor Lake opciókat a helyi AI gyorsítás hiánya miatt. Igaz, egy ilyen funkció valószínűleg csak a munkaállomás-felhasználók egy kis részhalmazát szólítja meg, de segített volna még jobban megkülönböztetni a Fury 16 G11-et a Fury 16 G10-től. Lényegében ugyanazt a teljesítményt és funkciókat kaphatja az alig egyéves Fury 16 G10 mint a legújabb Fury 16 G11 esetében.
Ár és elérhetőség
A ZBook Fury 16 G11 jelenleg 3400 dollár körüli áron kerül szállításra Core i9-14900HX és RTX 3500 Ada konfigurációban, míg az RTX 5000 Ada teljes konfigurációban 5500 dollár fölé emelkedik.
Figyelmeztetés: Wir haben unser Rating-System kürzlich aktualizált és die Ergebnisse von Version 8 sind nicht mit den Ergebnissen von Version 7 vergleichbar. További információk ehhez sind hier elérhető.
Megjegyzés: Nemrégiben frissítettük a minősítési rendszerünket, és a 8-as verzió eredményei nem hasonlíthatók össze a 7-es verzió eredményeivel. További információk elérhetők itt .
HP ZBook Fury 16 G11
- 08/12/2024 v8
Allen Ngo
 Total Sustainability Score:
 Átláthatóság
A felülvizsgálandó készülékek kiválasztását szerkesztőségünk végzi. A tesztmintát a gyártó vagy a kiskereskedő kölcsönként bocsátotta a szerző rendelkezésére a felülvizsgálat céljából. A hitelezőnek nem volt befolyása erre a felülvizsgálatra, és a gyártó sem kapott másolatot erről a felülvizsgálatról a közzététel előtt. Nem volt kötelesség ezt az ismertetőt közzétenni. Független médiavállalatként a Notebookcheck nincs alávetve a gyártók, kiskereskedők vagy kiadók felhatalmazásának.
Így tesztel a Notebookcheck
A Notebookcheck minden évben független, laptopok és okostelefonok százait vizsgálja meg szabványosított eljárások alkalmazásával annak érdekében, hogy minden eredmény összehasonlítható legyen. Körülbelül 20 éve folyamatosan fejlesztjük vizsgálati módszereinket, és ennek során iparági szabványokat állítottunk fel. Tesztlaboratóriumainkban kiváló minőségű mérőberendezéseket használnak tapasztalt technikusok és szerkesztők. Ezek a tesztek többlépcsős validációs folyamatot foglalnak magukban. Komplex minősítési rendszerünk több száz megalapozott mérésen és benchmarkon alapul, ami megőrzi az objektivitást.Price comparison

