MSI Raider 18 HX A14V felülvizsgálat: Titan teljesítmény Titan ár nélkül
")
A nagyobb, 18 hüvelykes gamer laptopok egyfajta visszatérésnek örvendenek, mivel a kínálat folyamatosan bővül. Az MSI már kínálja az "ultimate" 18 hüvelykes játékélményt a Titan 18 HX, de ez a legújabb Raider 18 HX modell egy szinttel lejjebb van a funkciók tekintetében, hogy csökkentse a belépési korlátot.
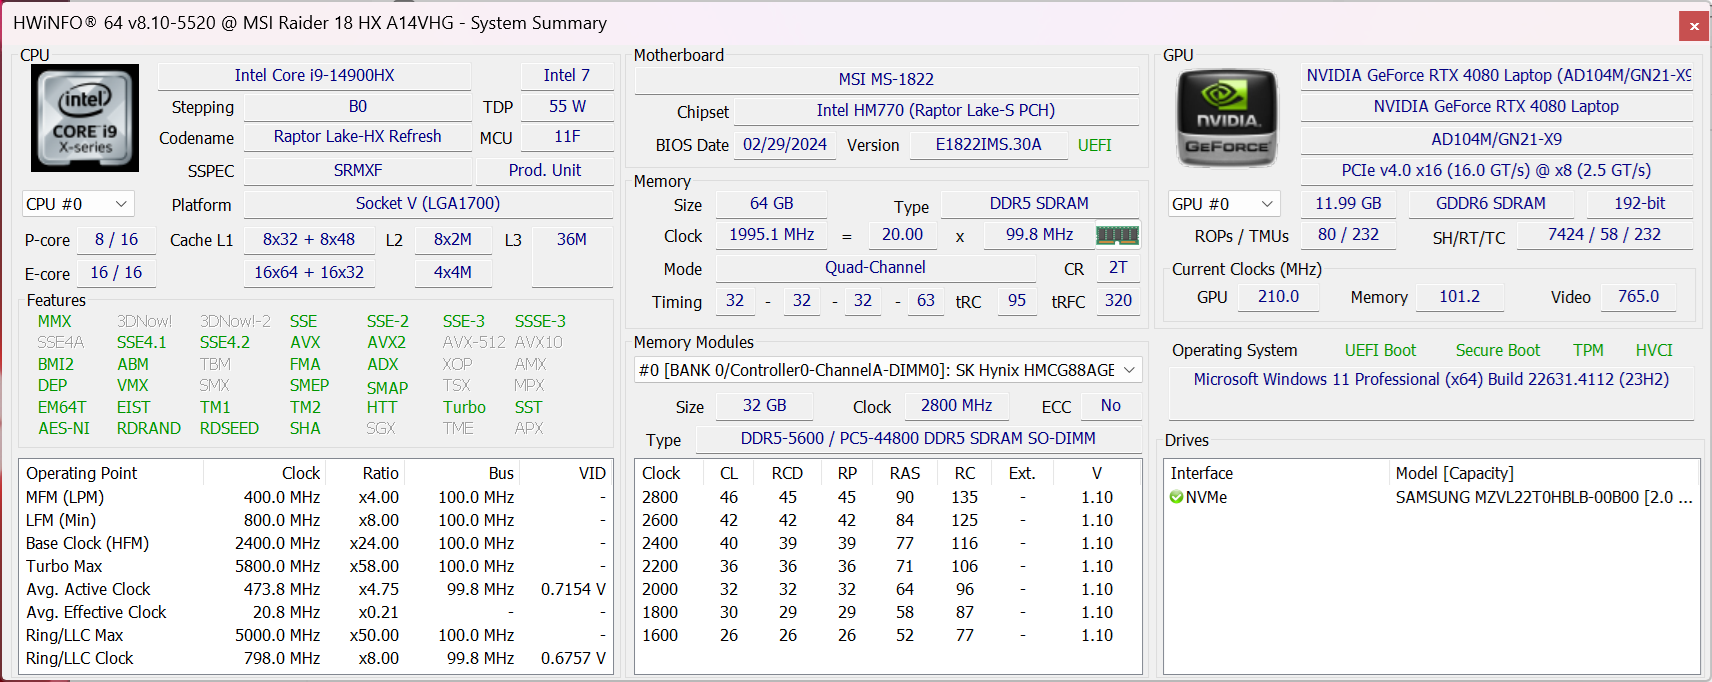
Tesztkészülékünk egy középső konfiguráció a Raptor Lake-R Core i9-14900HX CPU-val, 175 W-os GeForce RTX 4080 GPU-val és 3840 x 2400 120 Hz-es Mini-LED kijelzővel, körülbelül 3200 dolláros kiskereskedelmi áron. A többi SKU a Zen 4 Ryzen 9 7945HX, RTX 4070, RTX 4090 vagy QHD+ 2560 x 1600 240 Hz-es IPS kijelző helyett.
A Raider 18 HX versenytársai közé tartoznak más 18 hüvelykes gamer laptopok, mint például a Razer Blade 18, Alienware m18 R2, vagy Asus ROG Strix G18.
További MSI értékelések:
Lehetséges versenytársak összehasonlítása
Értékelés | Változat | Dátum | Modell | Súly | Magasság | Méret | Felbontás | Legjobb ár |
|---|---|---|---|---|---|---|---|---|
| 84.7 % | v8 | 09/2024 | MSI Raider 18 HX A14V i9-14900HX, GeForce RTX 4080 Laptop GPU | 3.6 kg | 32 mm | 18.00" | 3840x2400 | |
| 90.5 % v7 (old) | v7 (old) | 05/2024 | Razer Blade 18 2024 RZ09-0509 i9-14900HX, GeForce RTX 4090 Laptop GPU | 3.1 kg | 21.9 mm | 18.00" | 2560x1600 | |
| 89.5 % v7 (old) | v7 (old) | 04/2024 | Alienware m18 R2 i9-14900HX, GeForce RTX 4090 Laptop GPU | 4 kg | 26.7 mm | 18.00" | 2560x1600 | |
| 88.8 % v7 (old) | v7 (old) | 03/2024 | MSI Titan 18 HX A14VIG i9-14900HX, GeForce RTX 4090 Laptop GPU | 3.6 kg | 32.1 mm | 18.00" | 3840x2400 | |
| 87.4 % v7 (old) | v7 (old) | 07/2023 | Asus ROG Strix G18 G814JI i7-13650HX, GeForce RTX 4070 Laptop GPU | 3 kg | 31 mm | 18.00" | 2560x1600 | |
| 87.1 % v7 (old) | v7 (old) | 03/2024 | Acer Predator Helios 18 PH18-72-98MW i9-14900HX, GeForce RTX 4090 Laptop GPU | 3.3 kg | 29.5 mm | 18.00" | 2560x1600 |
Megjegyzés: Nemrégiben frissítettük a minősítési rendszerünket, és a 8-as verzió eredményei nem hasonlíthatók össze a 7-es verzió eredményeivel. További információk elérhetők itt .
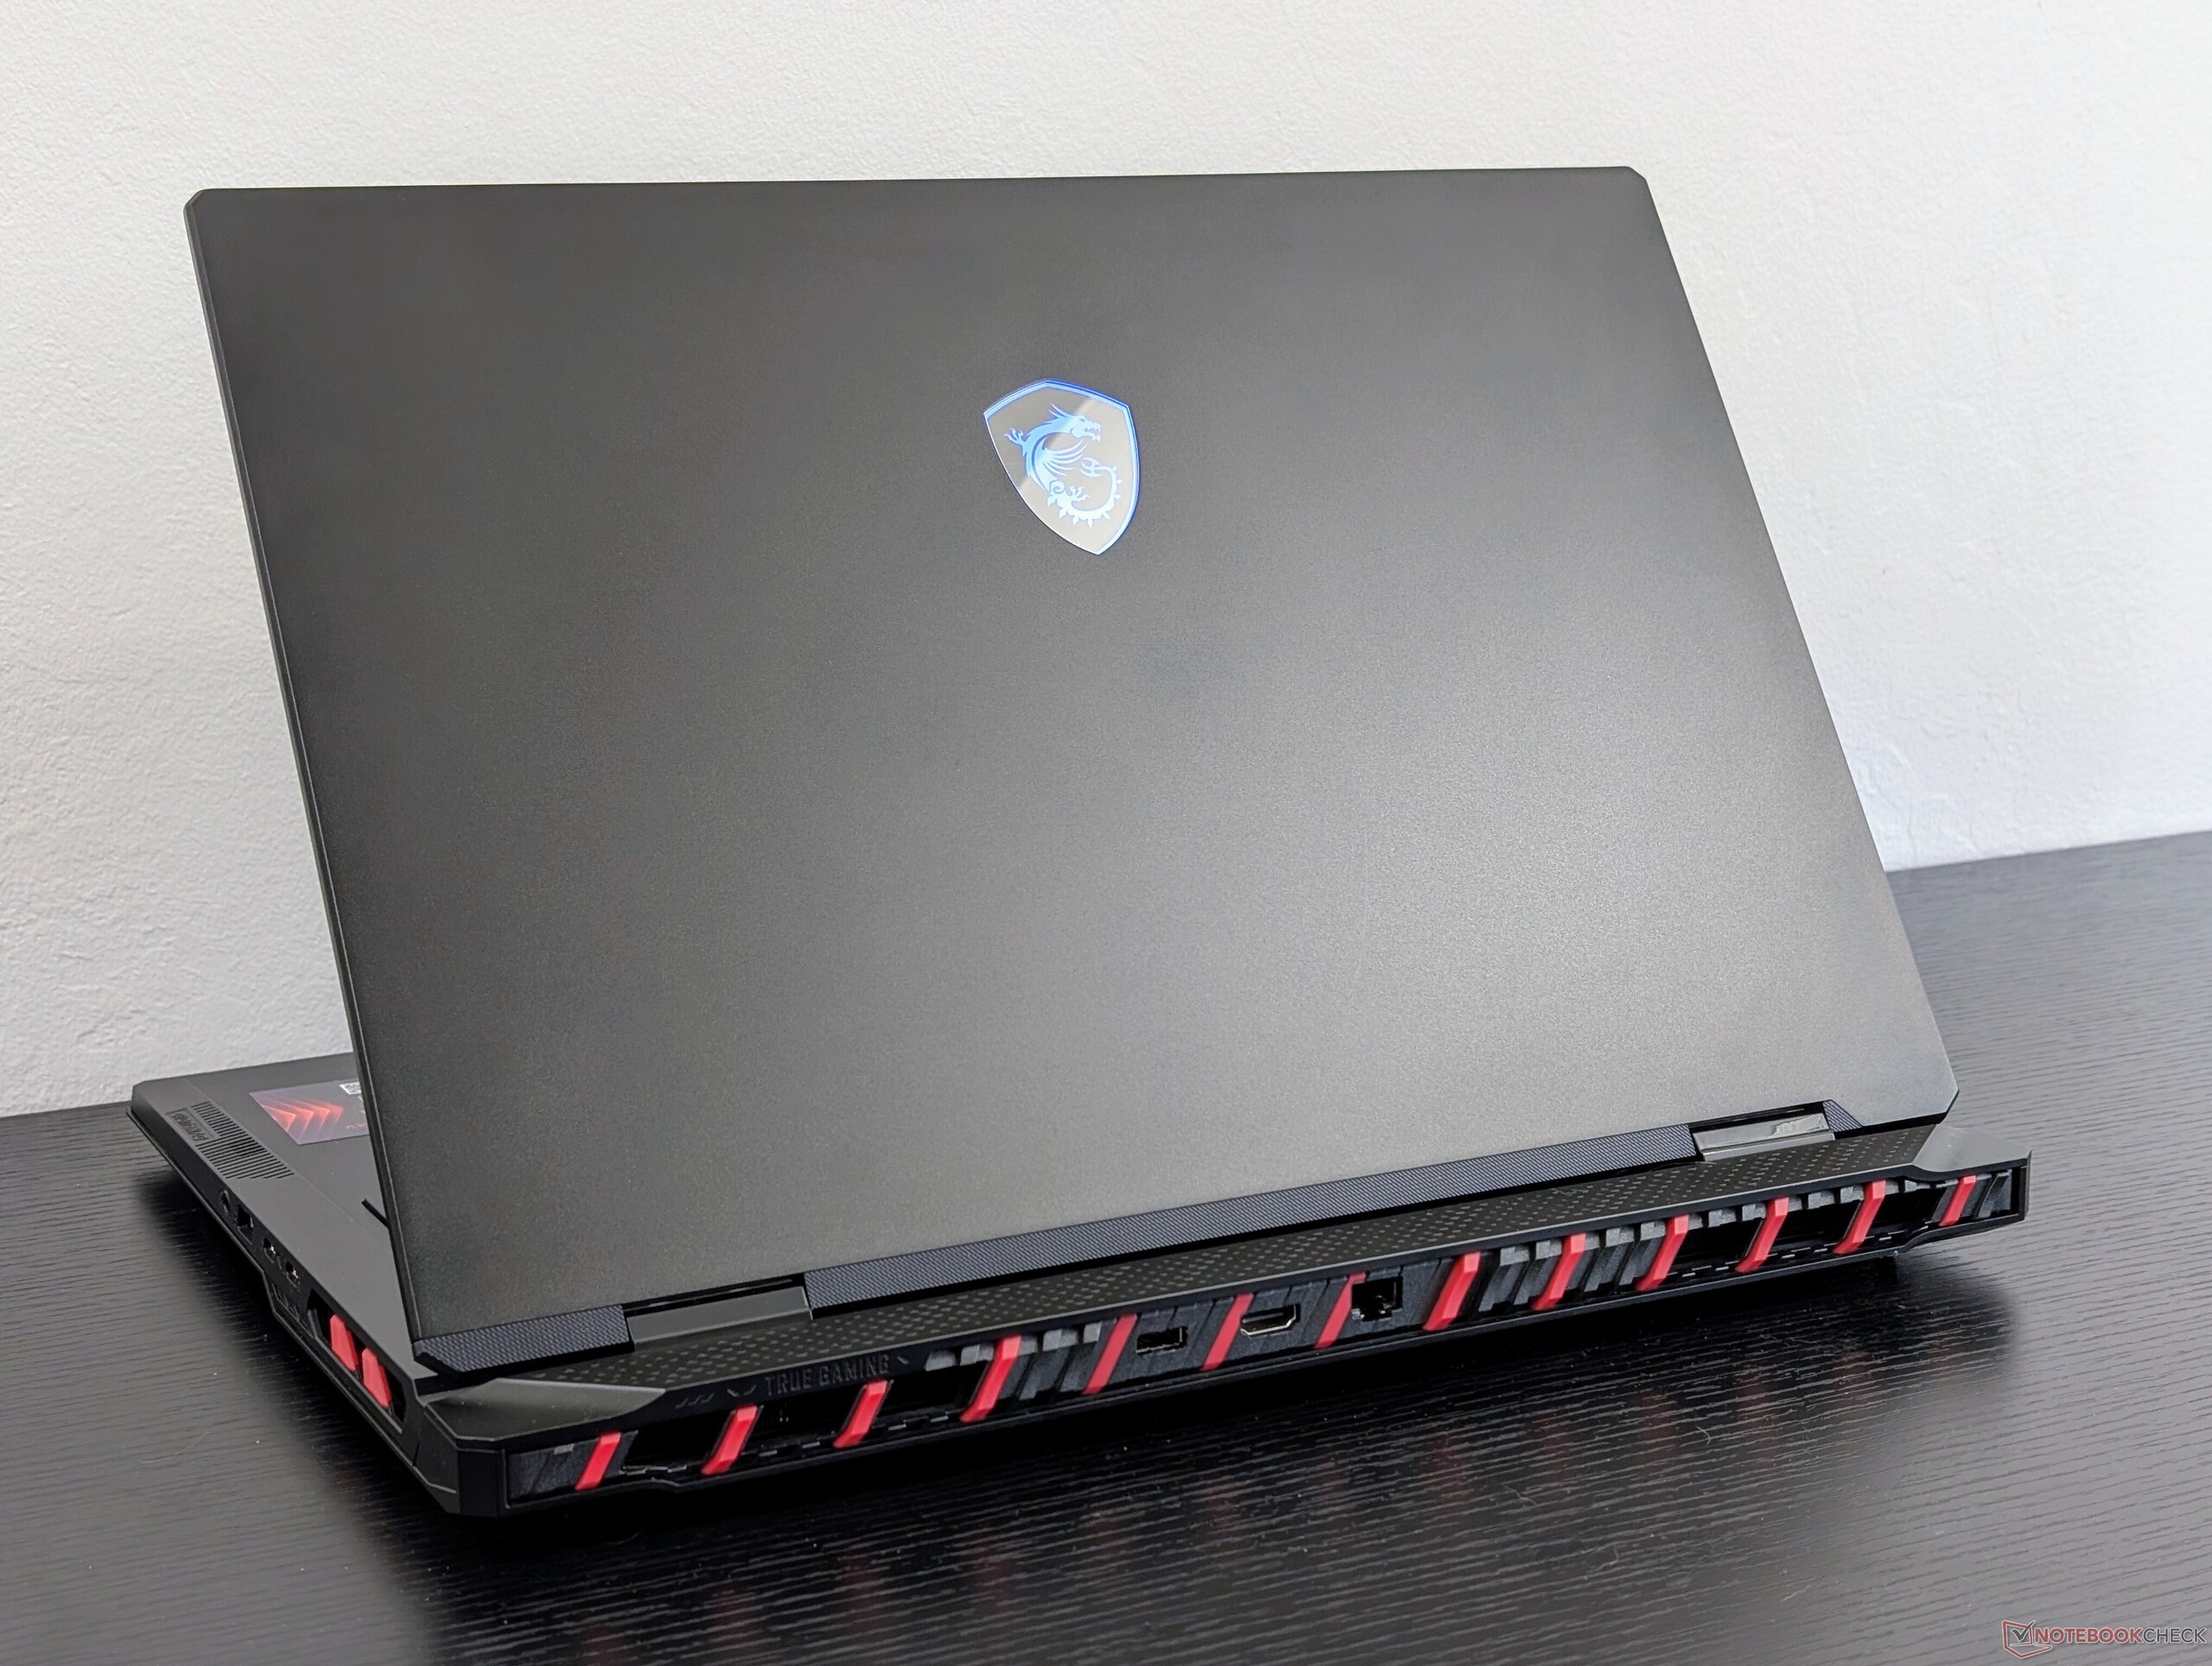
Ügy - A kék sárkánytól a vörösig
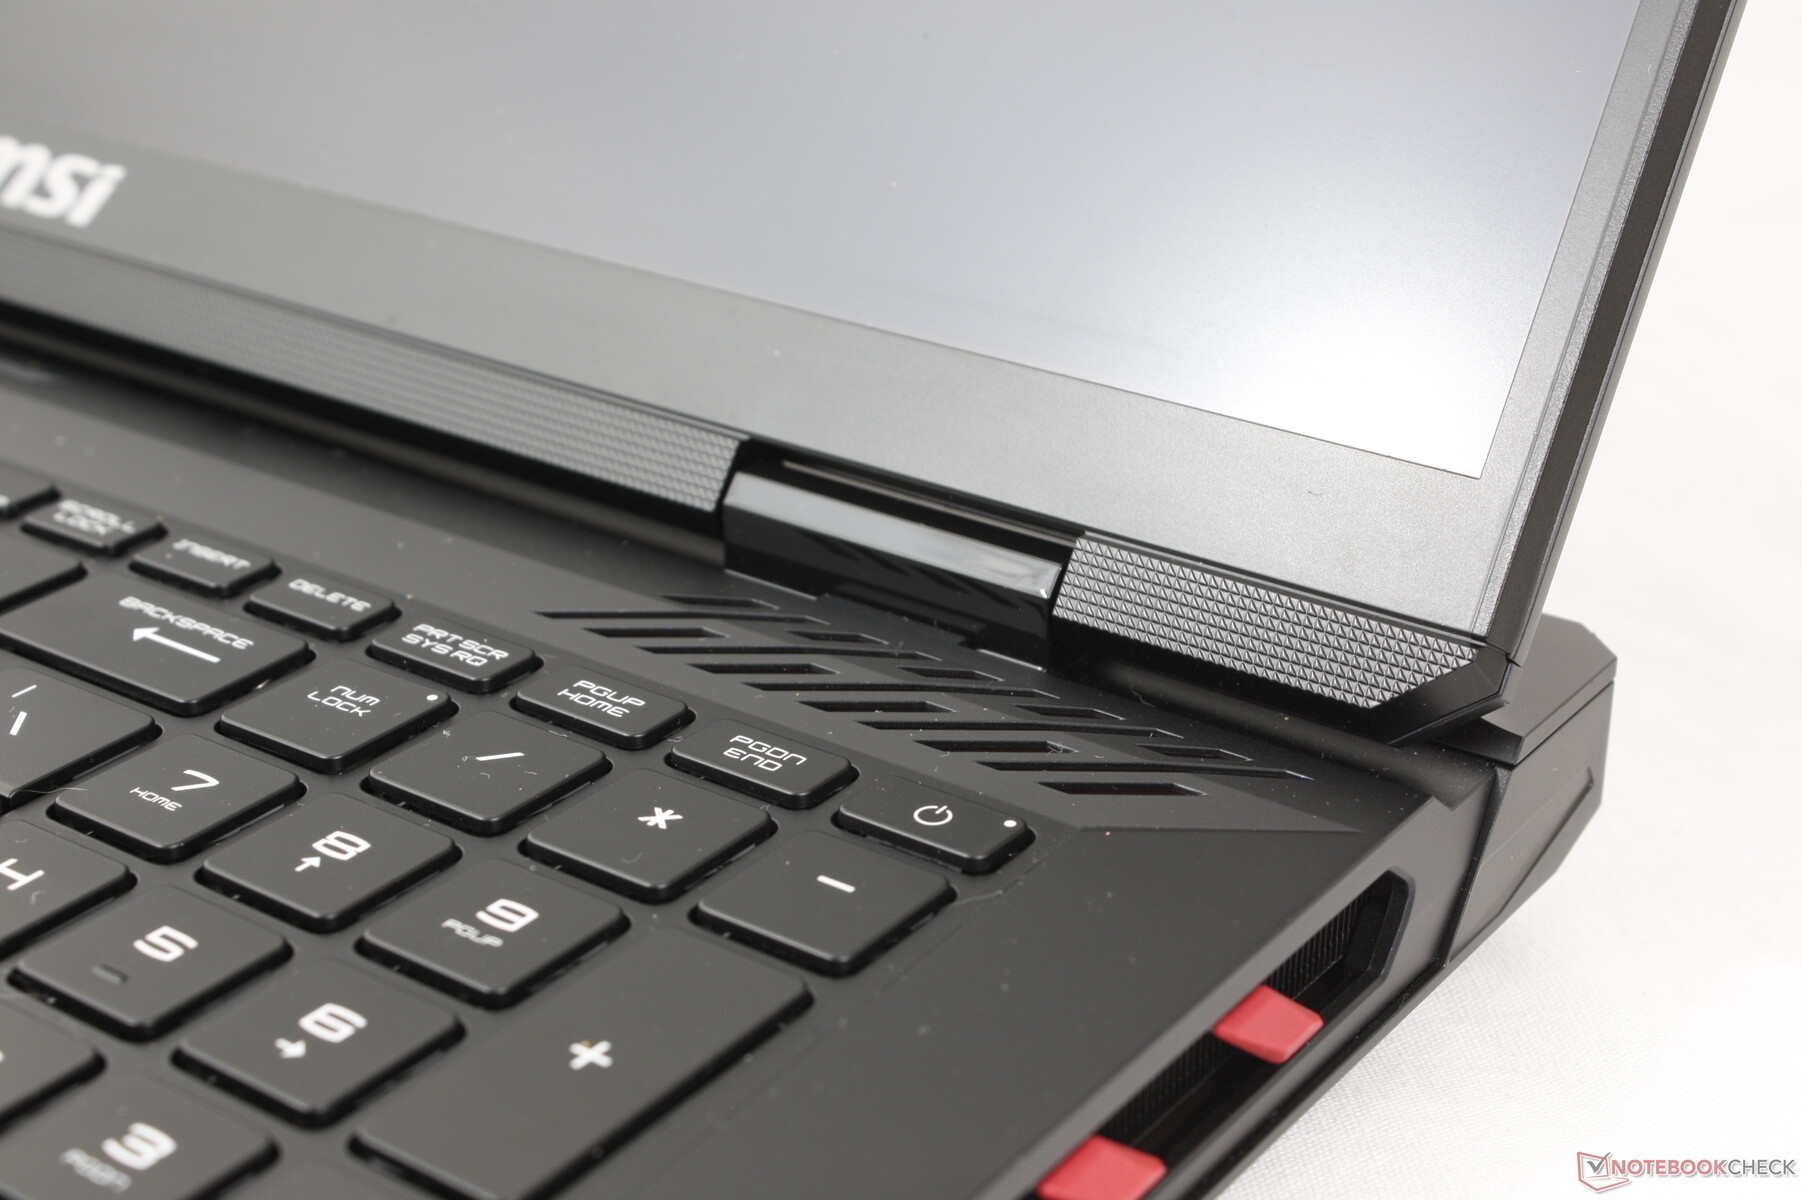
Az alváz a Titan 18 HX származéka. A Titan piros hangsúlyai helyett kék színűek az új Raiderben, és a legtöbb felület szürke vagy ezüst helyett koromfekete, ami összességében sötétebb megjelenést eredményez. Az MSI a rendszer elülső széle mentén egy LED-sávot is elhelyezett, míg ez a Titanról hiányzott. A változások nagyrészt esztétikaiak, így a Raider még mindig ugyanolyan erősnek tűnik, mint drágább testvére, mivel az alapanyagok és a váz ugyanazok.
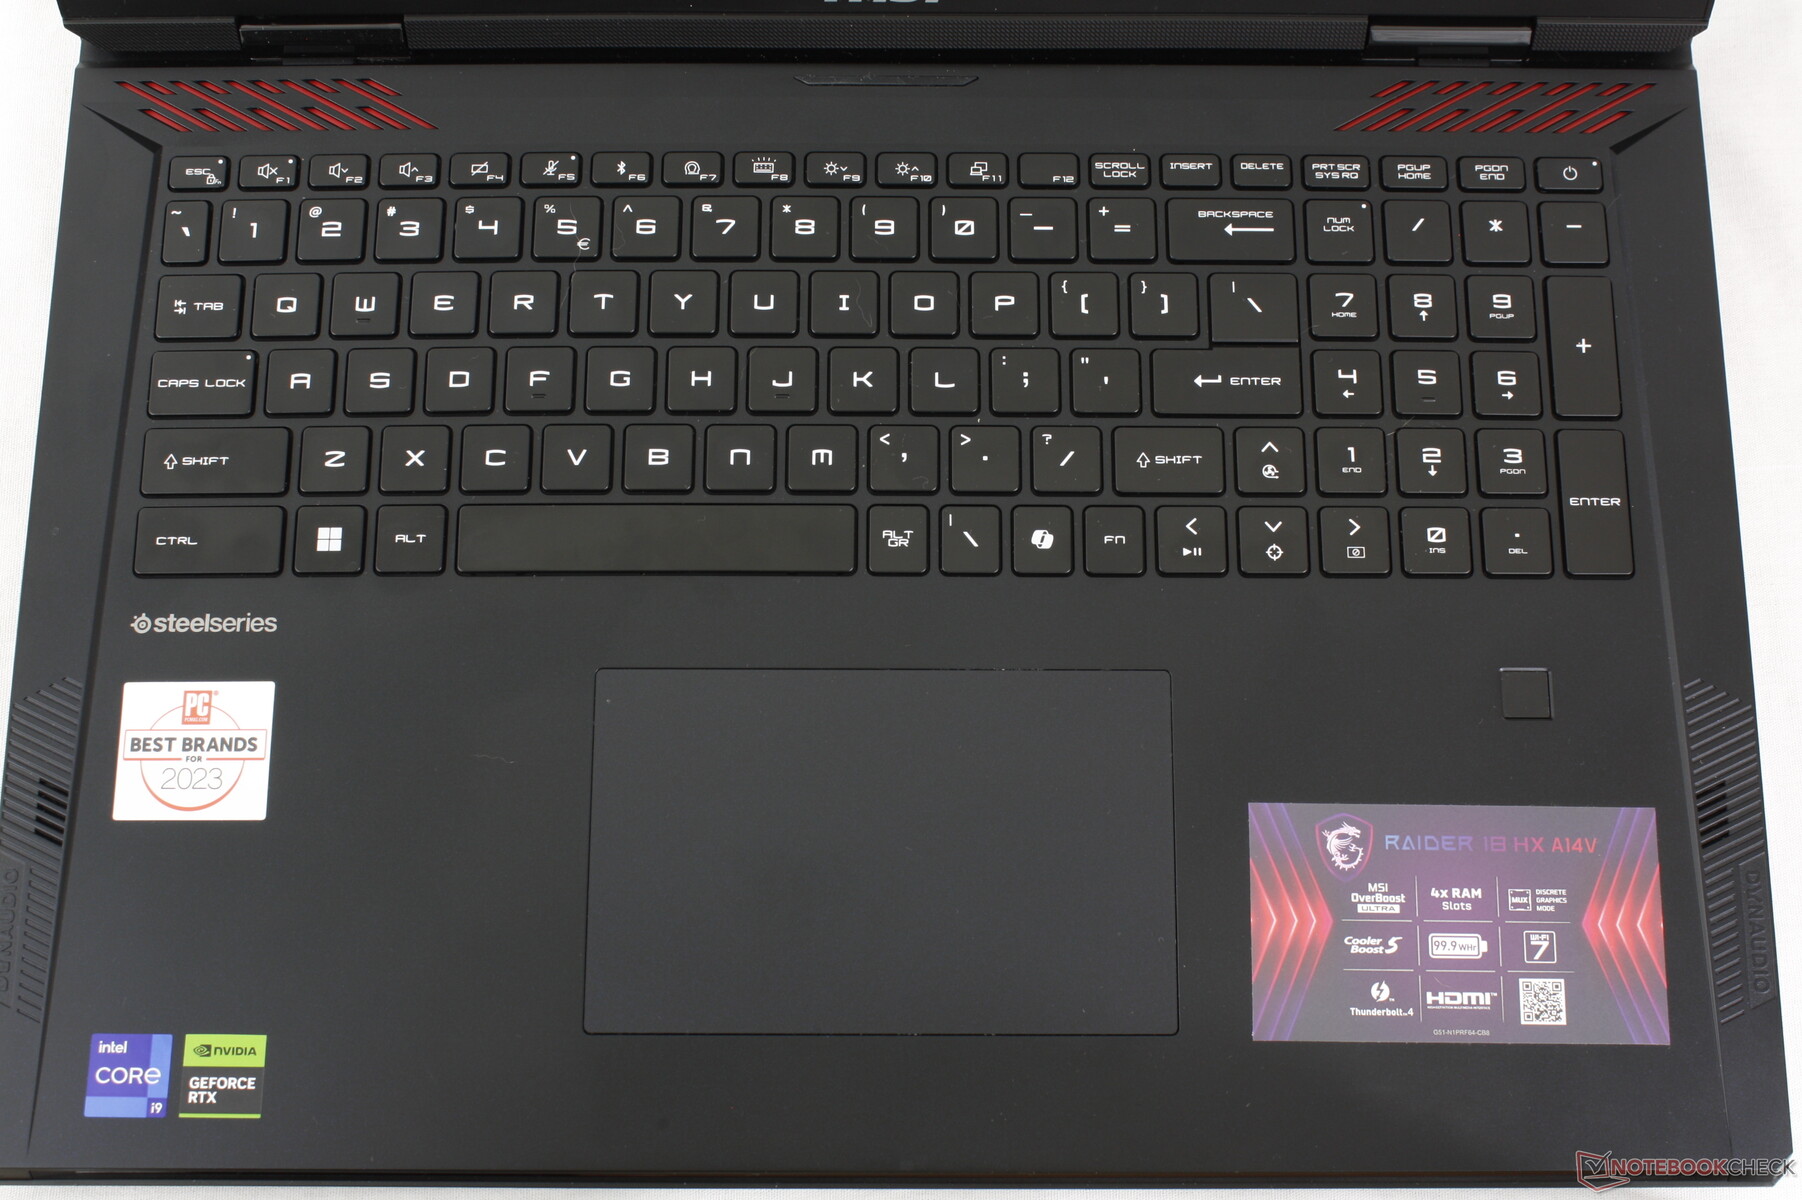
A Raider 18 HX és a Titan 18 HX között talán a legszembetűnőbb vizuális különbség az újratervezett billentyűzetfedélzet. Míg a Titan 18 HX laposabb fedélzettel rendelkezik, a tenyértámaszon és a kattintópadon átívelő díszes üvegpanellel, addig a Raider hagyományosabb megközelítést alkalmaz, üveg nélkül és csak egy egyszerű kattintópaddal.
Méretei és súlya lényegében megegyezik a Titan 18 HX-ével a köztük lévő külső különbségek ellenére. A modell ezért a hordozhatóság tekintetében a csomag közepén helyezkedik el, mivel az olyan alternatívák, mint a Alienware m18 R2 nehezebbek és nagyobbak, míg a ROG Strix G18 vagy a Blade 18 egyenként sokkal könnyebbek.
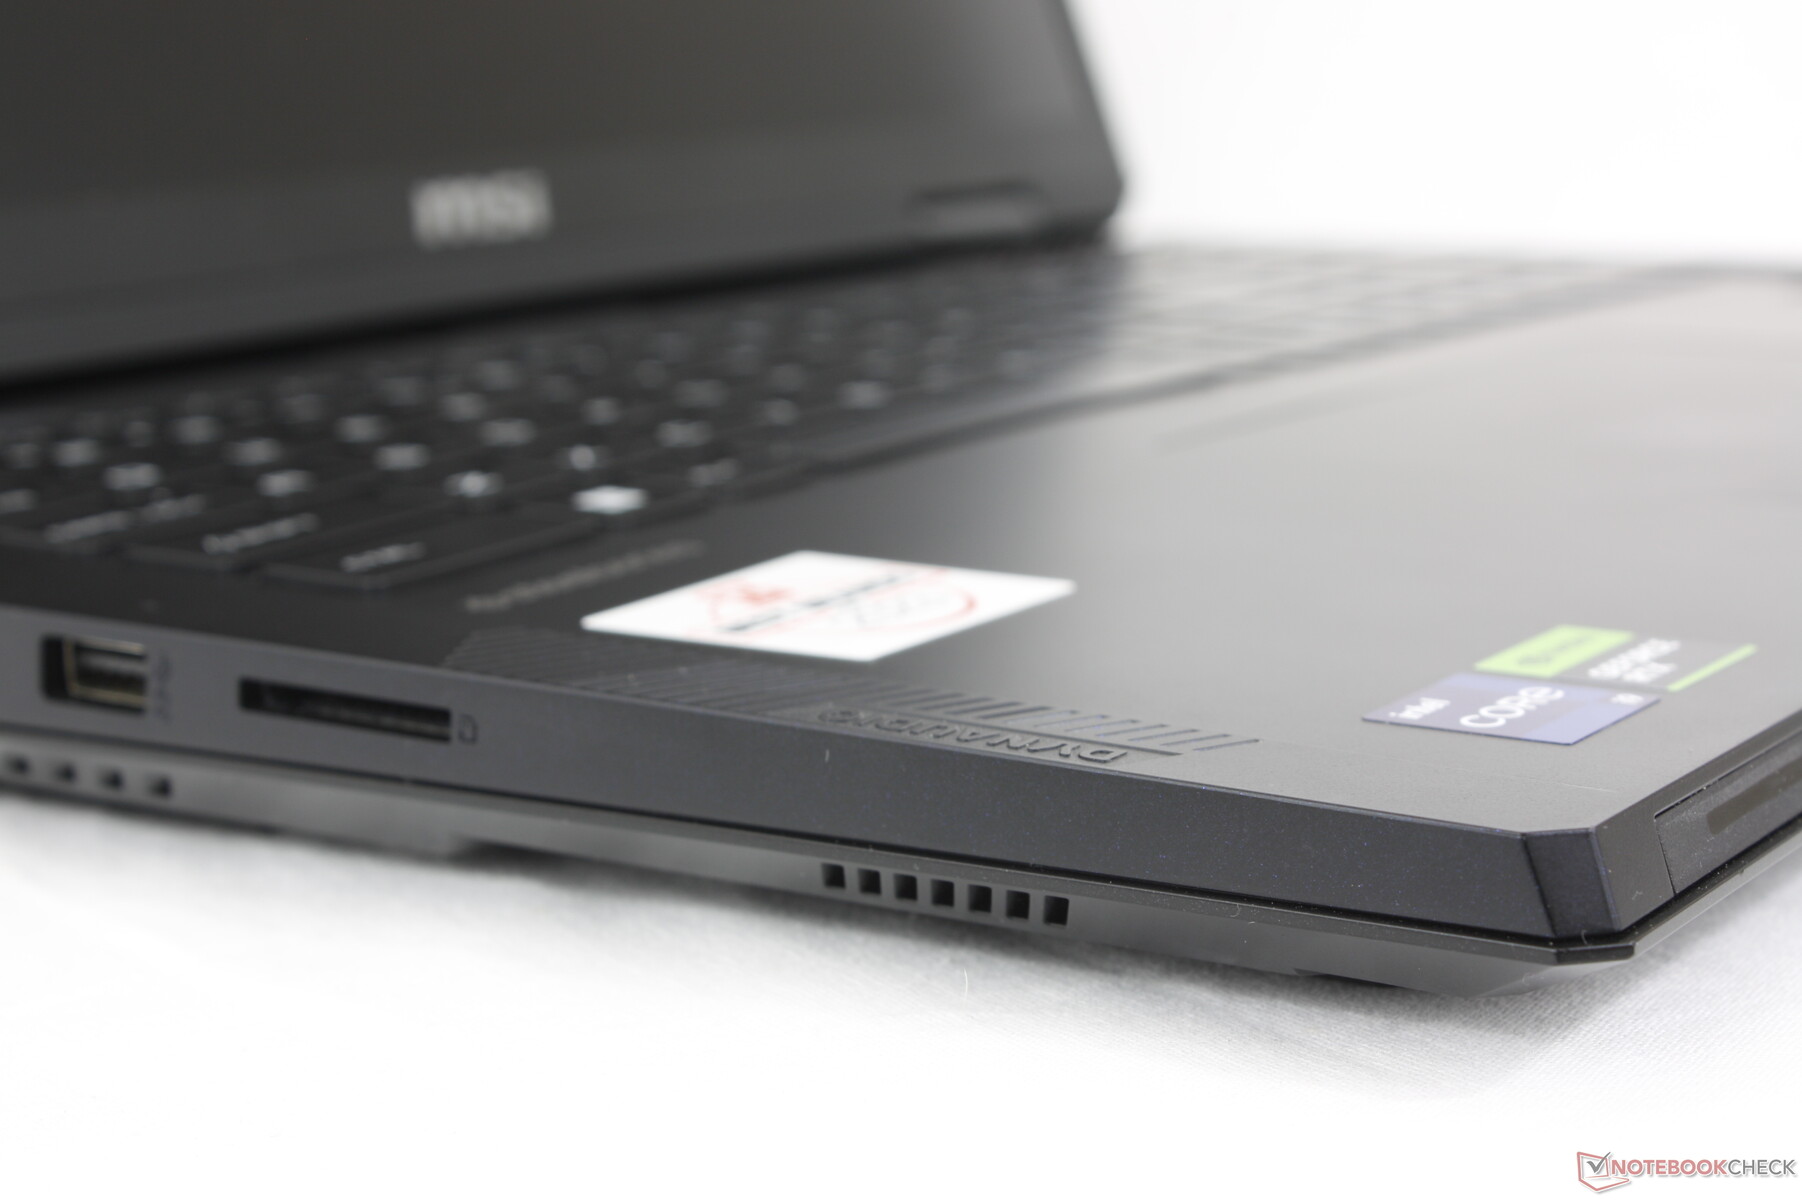
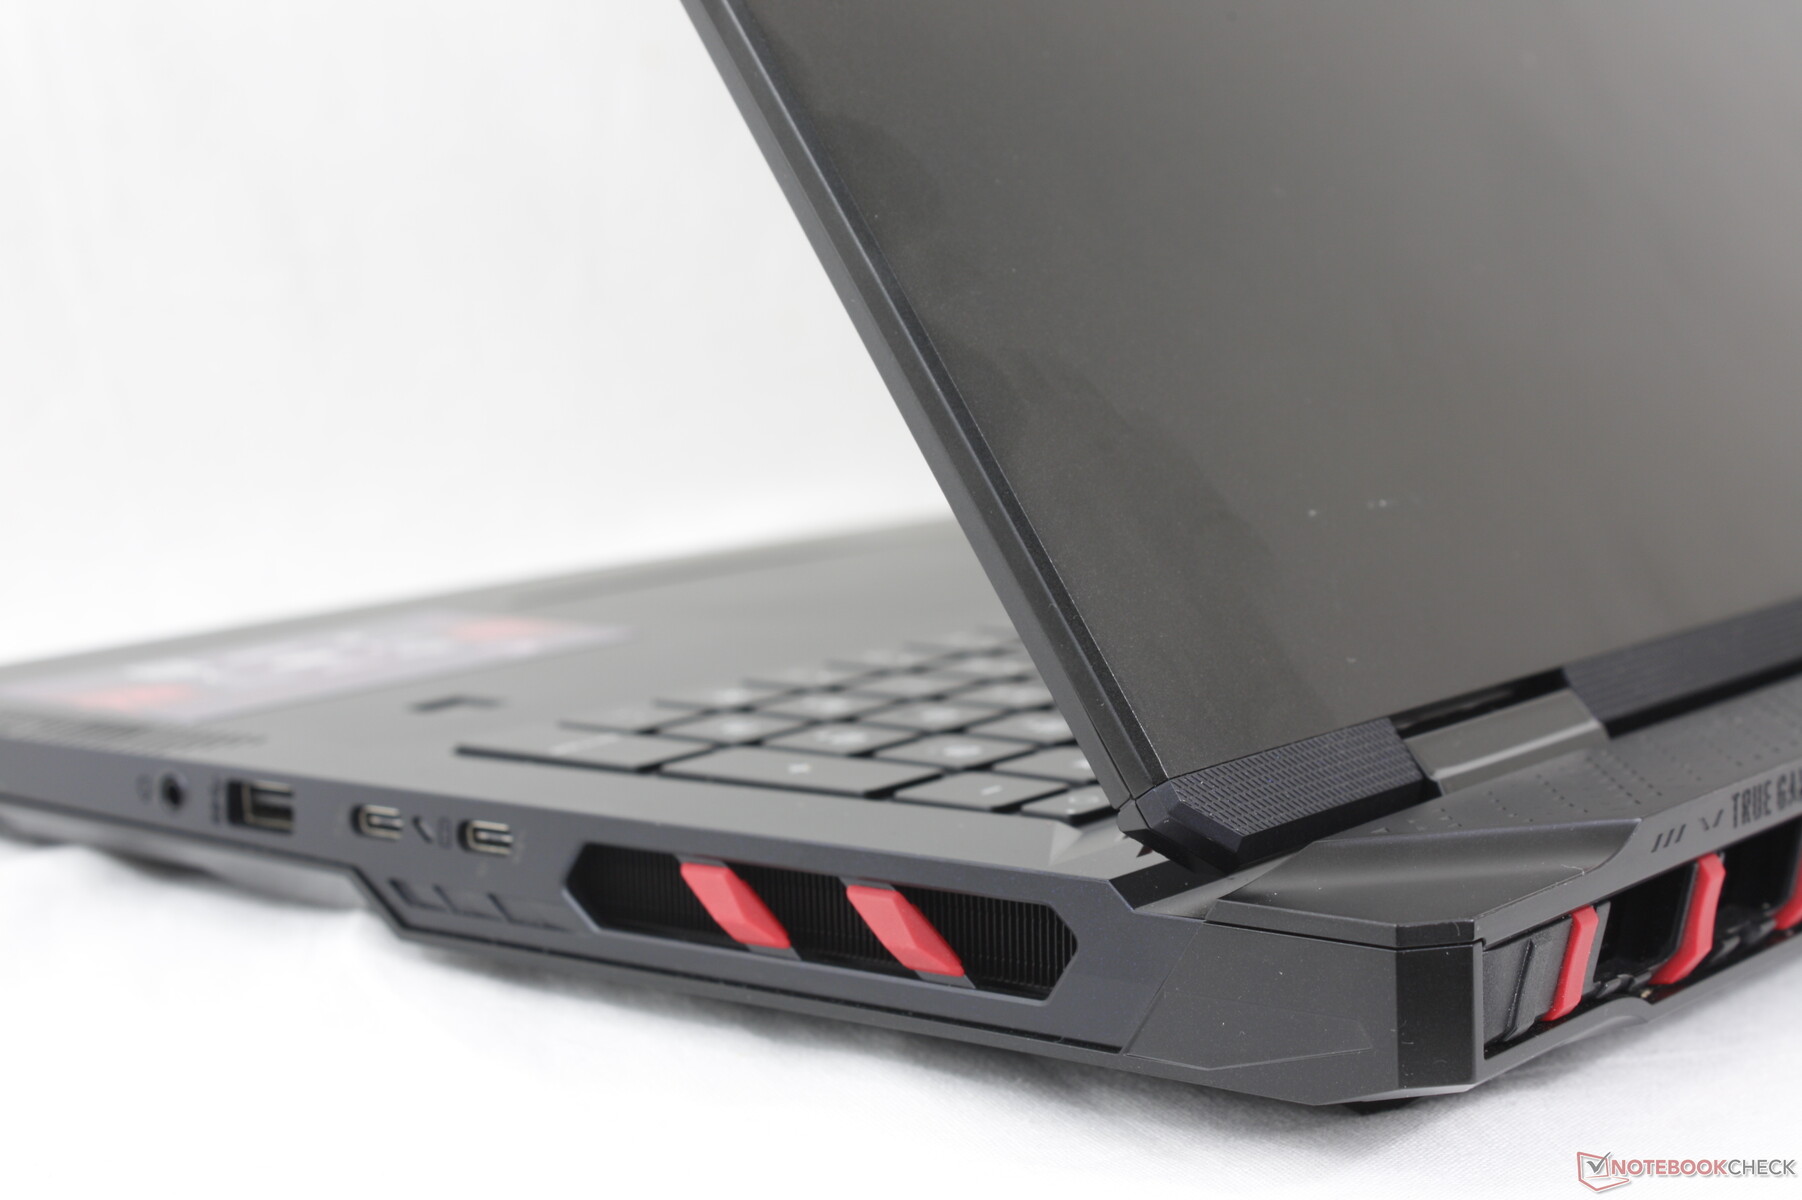
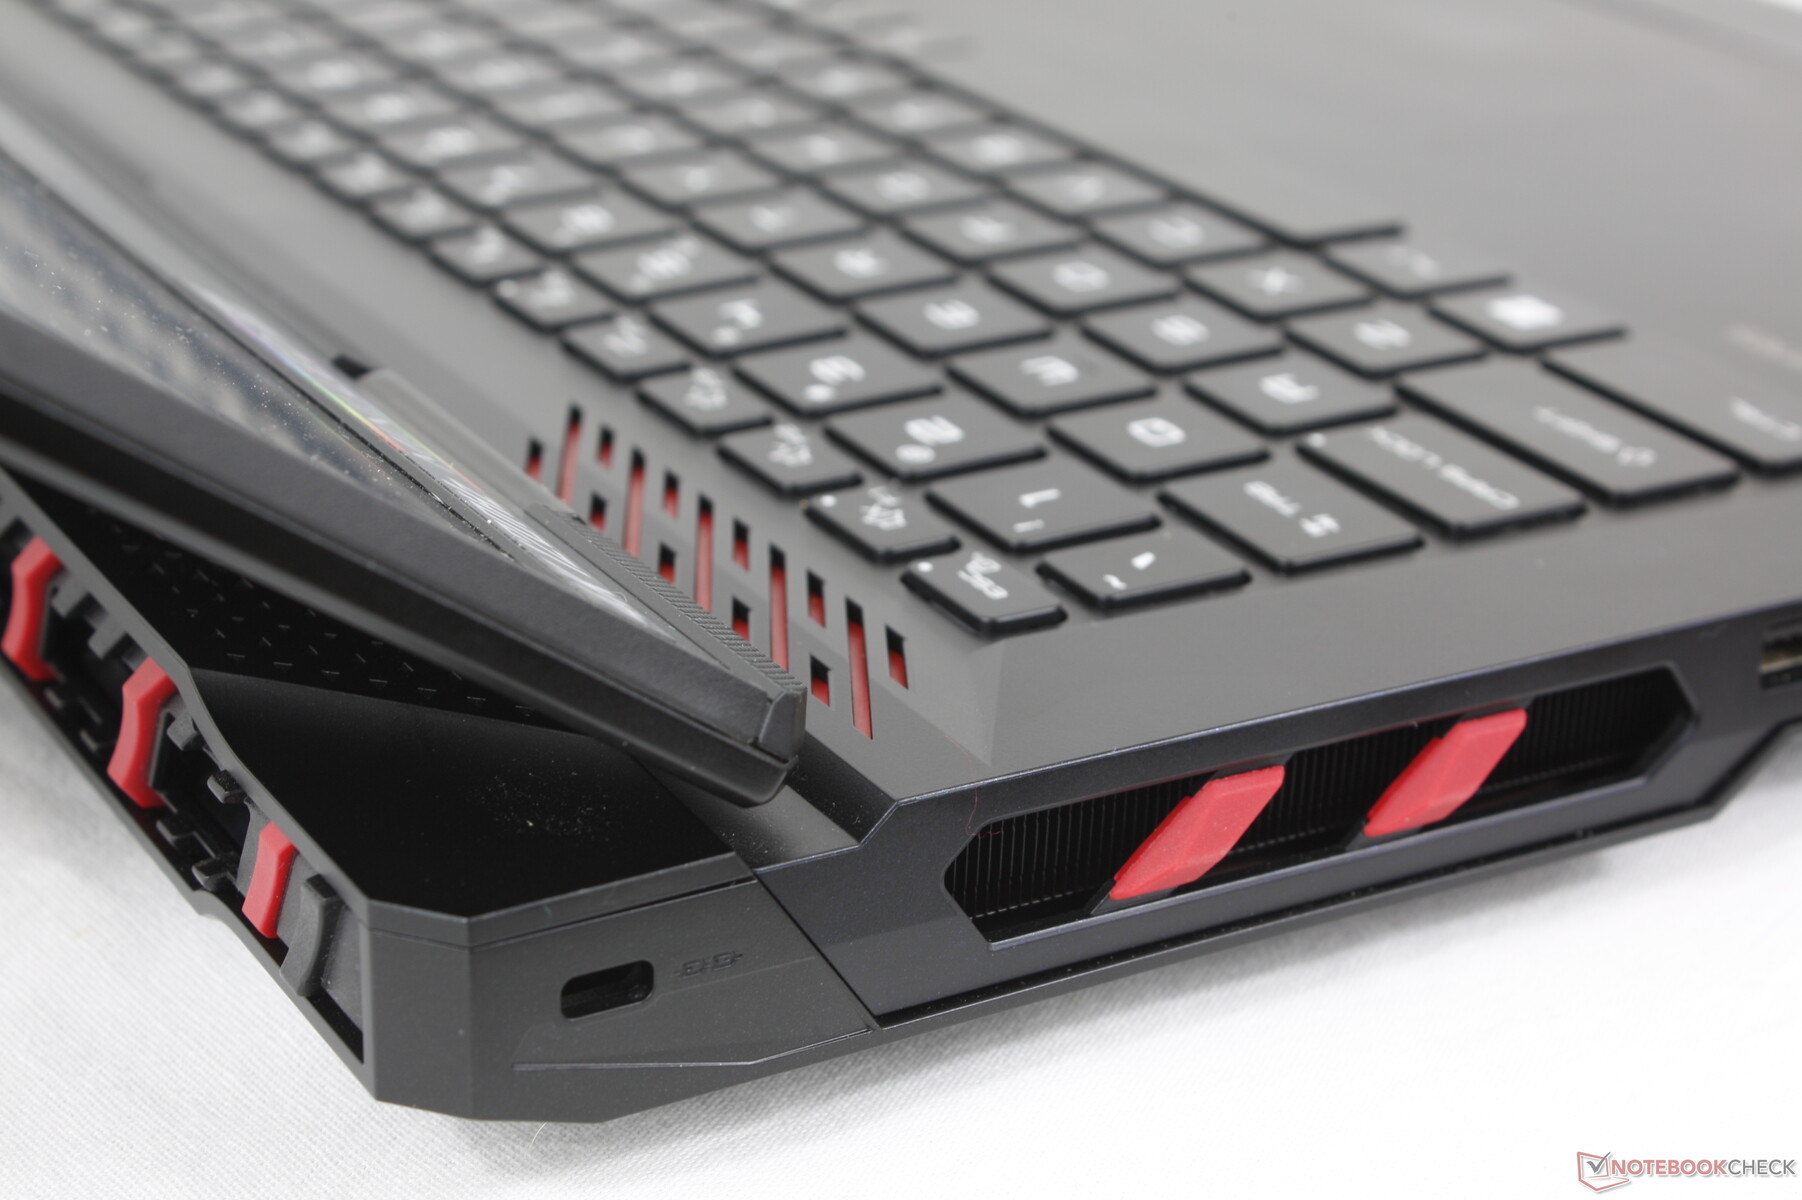
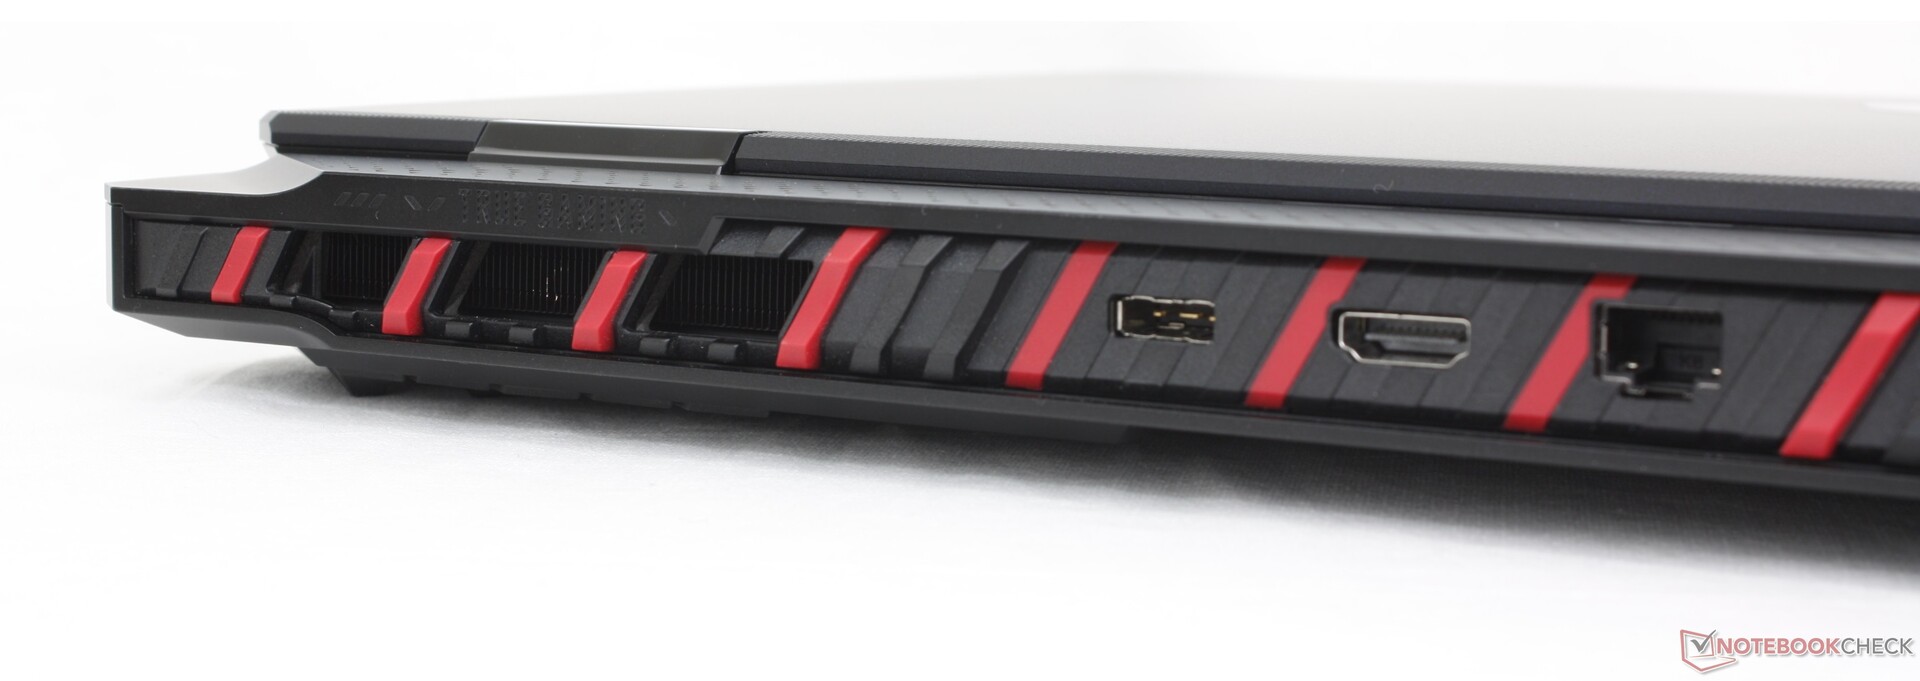
Csatlakoztathatóság
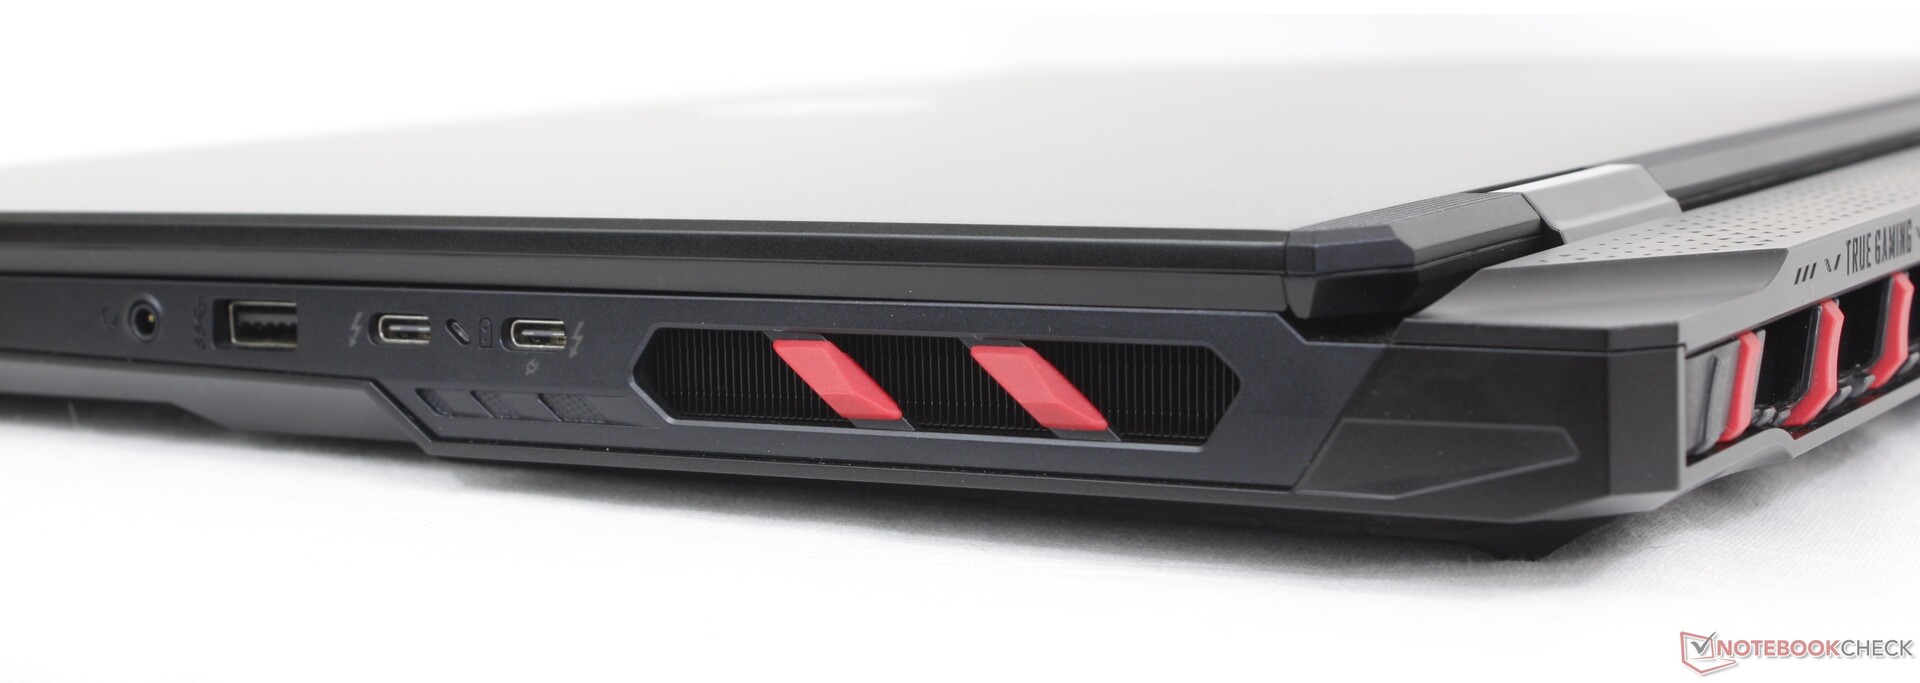
A portok és a pozícionálás megegyezik a Titan 18 HX-ével, ami nagyban utal arra, hogy mire számíthatunk a motorháztető alatt. A beépített opciók hasonlóak ahhoz, amit a Blade 18 vagy a ROG Strix G18-hoz, bár nagyon eltérő elrendezésben.
Ne feledd, hogy a két USB-C port közül csak az egyik támogatja a Power Delivery-t. Mindkettő egyébként kompatibilis a DisplayPorttal.

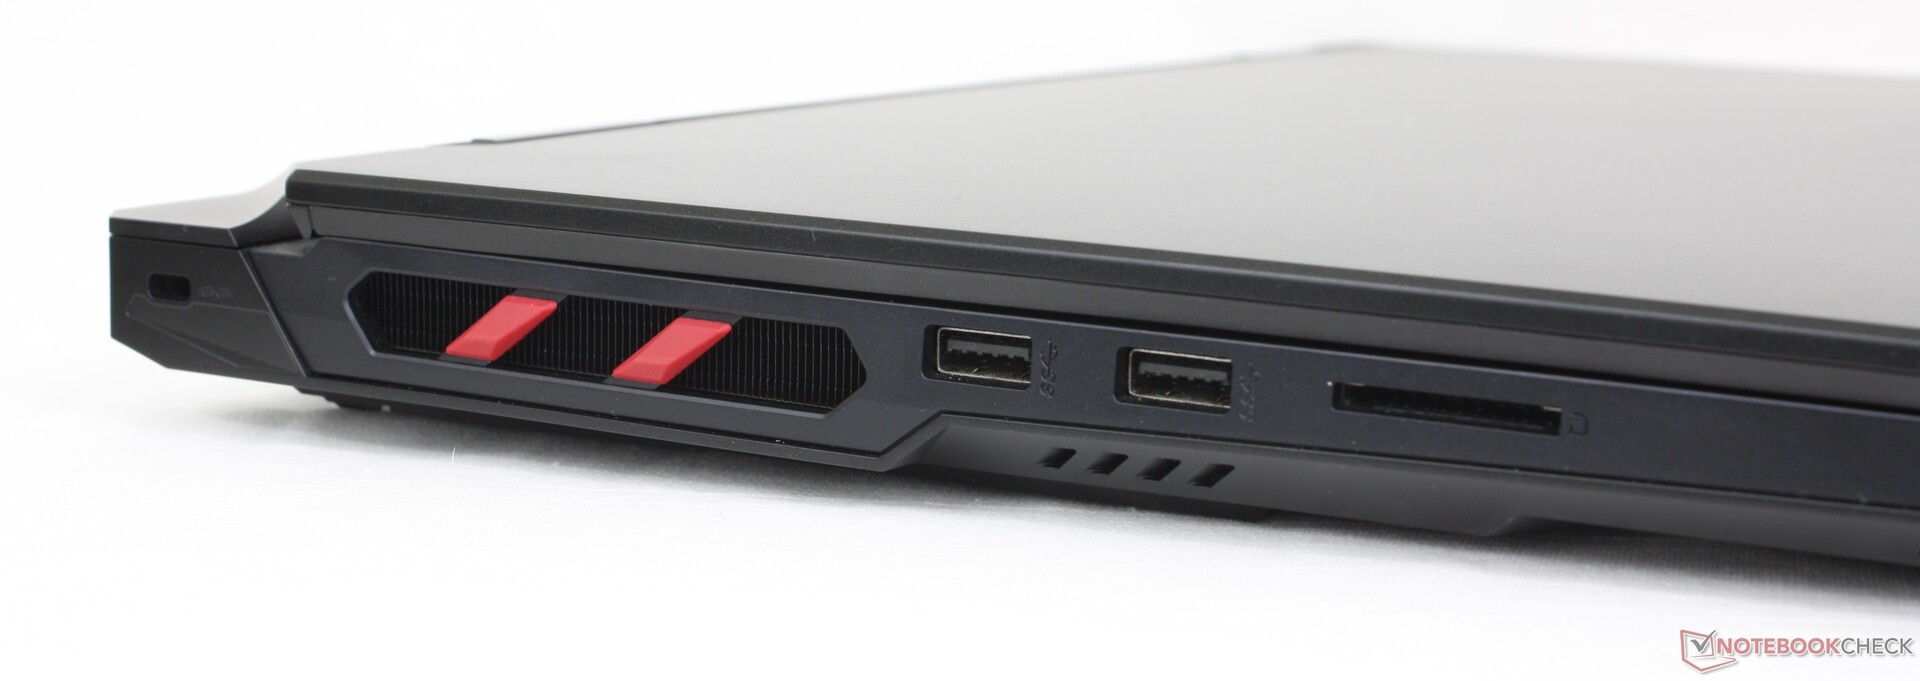
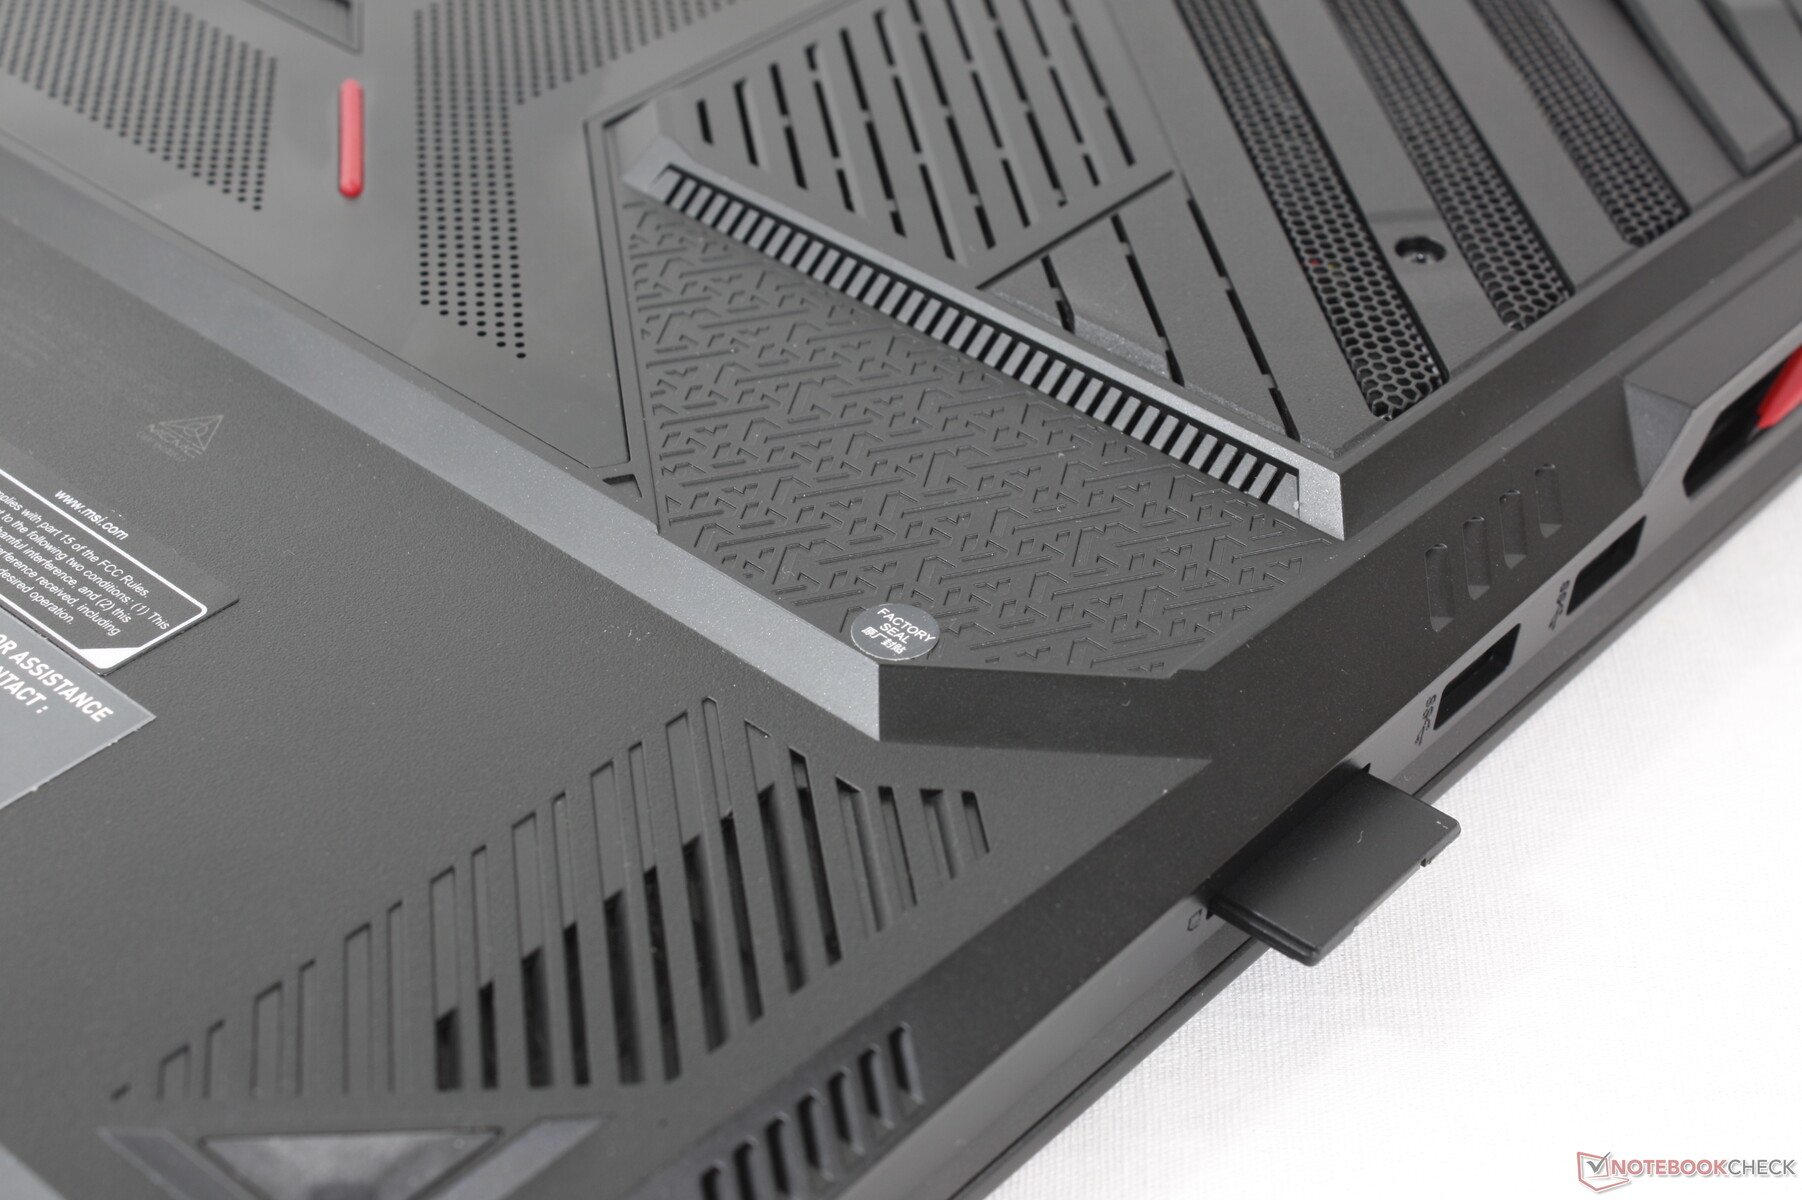
SD kártyaolvasó
A 90 MB/s körüli sebességgel a beépített SD-olvasó tisztességes, de egyébként lassú a Raider 18 HX magas árához képest. A Razer Blade 18 vagy a Razer Blade 18 SD-kártyaolvasója Alienware m18 R2például több mint kétszer gyorsabbak ehhez képest.
| SD Card Reader | |
| average JPG Copy Test (av. of 3 runs) | |
| Alienware m18 R2 (Toshiba Exceria Pro SDXC 64 GB UHS-II) | |
| Razer Blade 18 2024 RZ09-0509 (Toshiba Exceria Pro SDXC 64 GB UHS-II) | |
| Acer Predator Helios 18 PH18-72-98MW (AV PRO microSD 128 GB V60) | |
| MSI Raider 18 HX A14V (Toshiba Exceria Pro SDXC 64 GB UHS-II) | |
| MSI Titan 18 HX A14VIG (Toshiba Exceria Pro SDXC 64 GB UHS-II) | |
| maximum AS SSD Seq Read Test (1GB) | |
| Razer Blade 18 2024 RZ09-0509 (Toshiba Exceria Pro SDXC 64 GB UHS-II) | |
| Alienware m18 R2 (Toshiba Exceria Pro SDXC 64 GB UHS-II) | |
| MSI Titan 18 HX A14VIG (Toshiba Exceria Pro SDXC 64 GB UHS-II) | |
| MSI Raider 18 HX A14V (Toshiba Exceria Pro SDXC 64 GB UHS-II) | |
| Acer Predator Helios 18 PH18-72-98MW (AV PRO microSD 128 GB V60) | |
Kommunikáció
A Killer BE1750x alapfelszereltségként Wi-Fi 7 és Bluetooth 5.4 kapcsolattal rendelkezik. Az átviteli sebességek egyenletesek és megbízhatóak, amikor Wi-Fi 6E tesztrouterünkkel párosítottuk.
Webkamera
A 2 MP-es webkamera IR-rel és fizikai zárral alapfelszereltség, akárcsak a Titan 18 HX esetében. Érdekes módon a kamera is hasonló fényerő problémákat mutatna.


Karbantartás
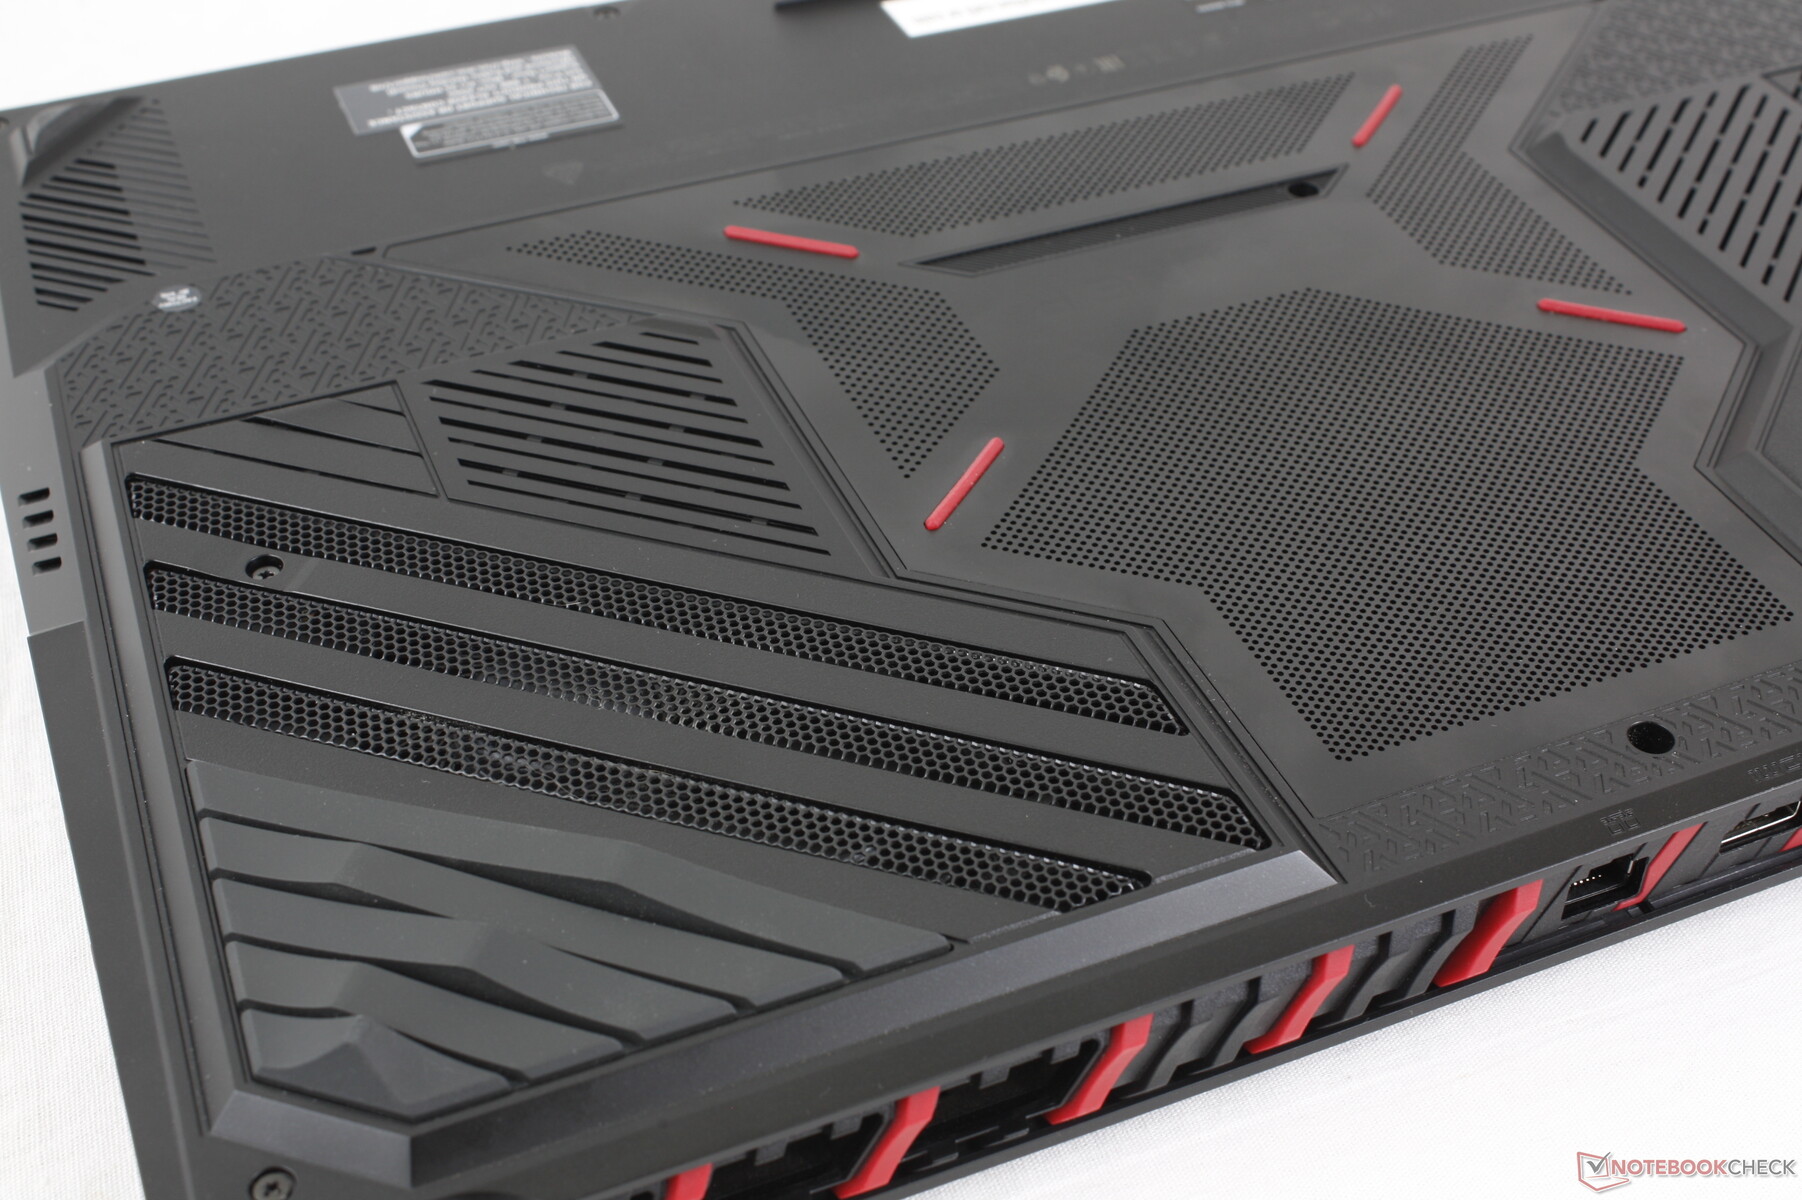
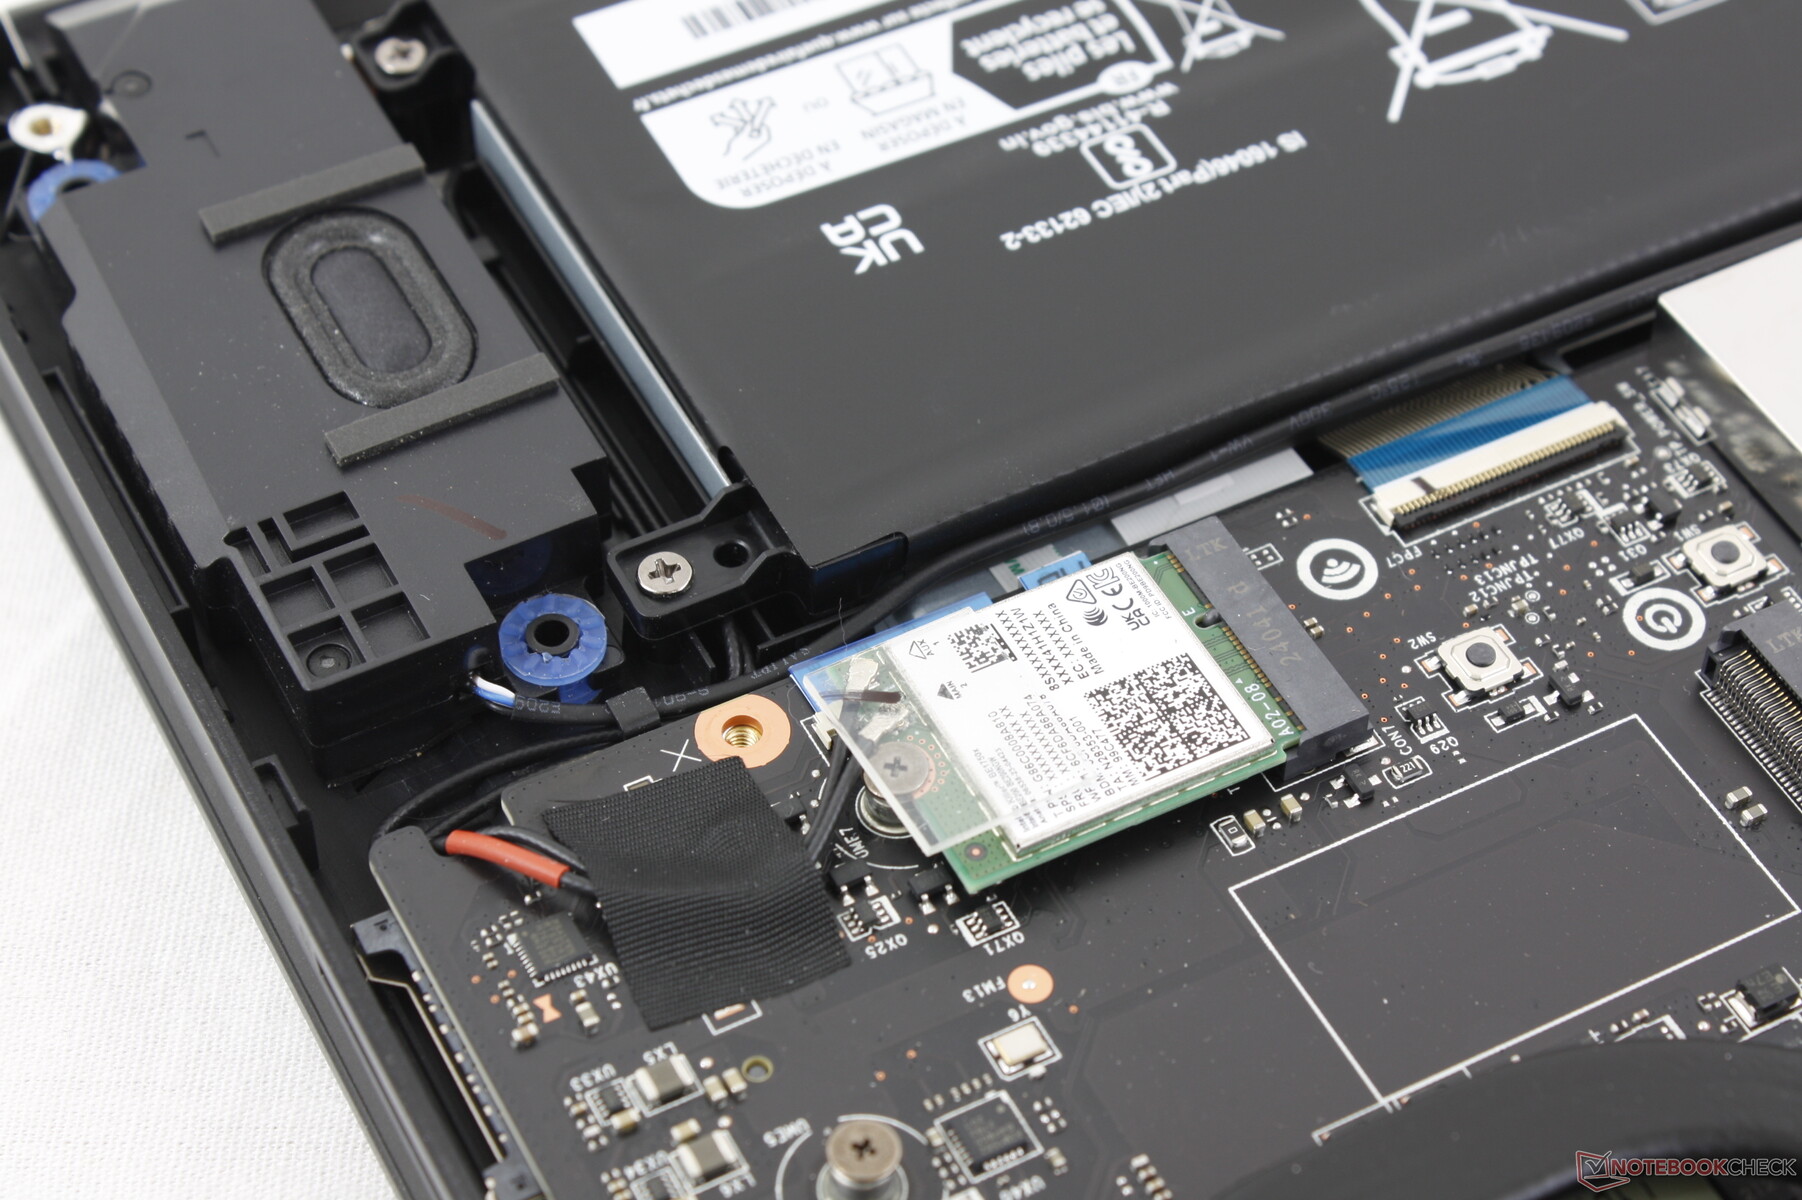
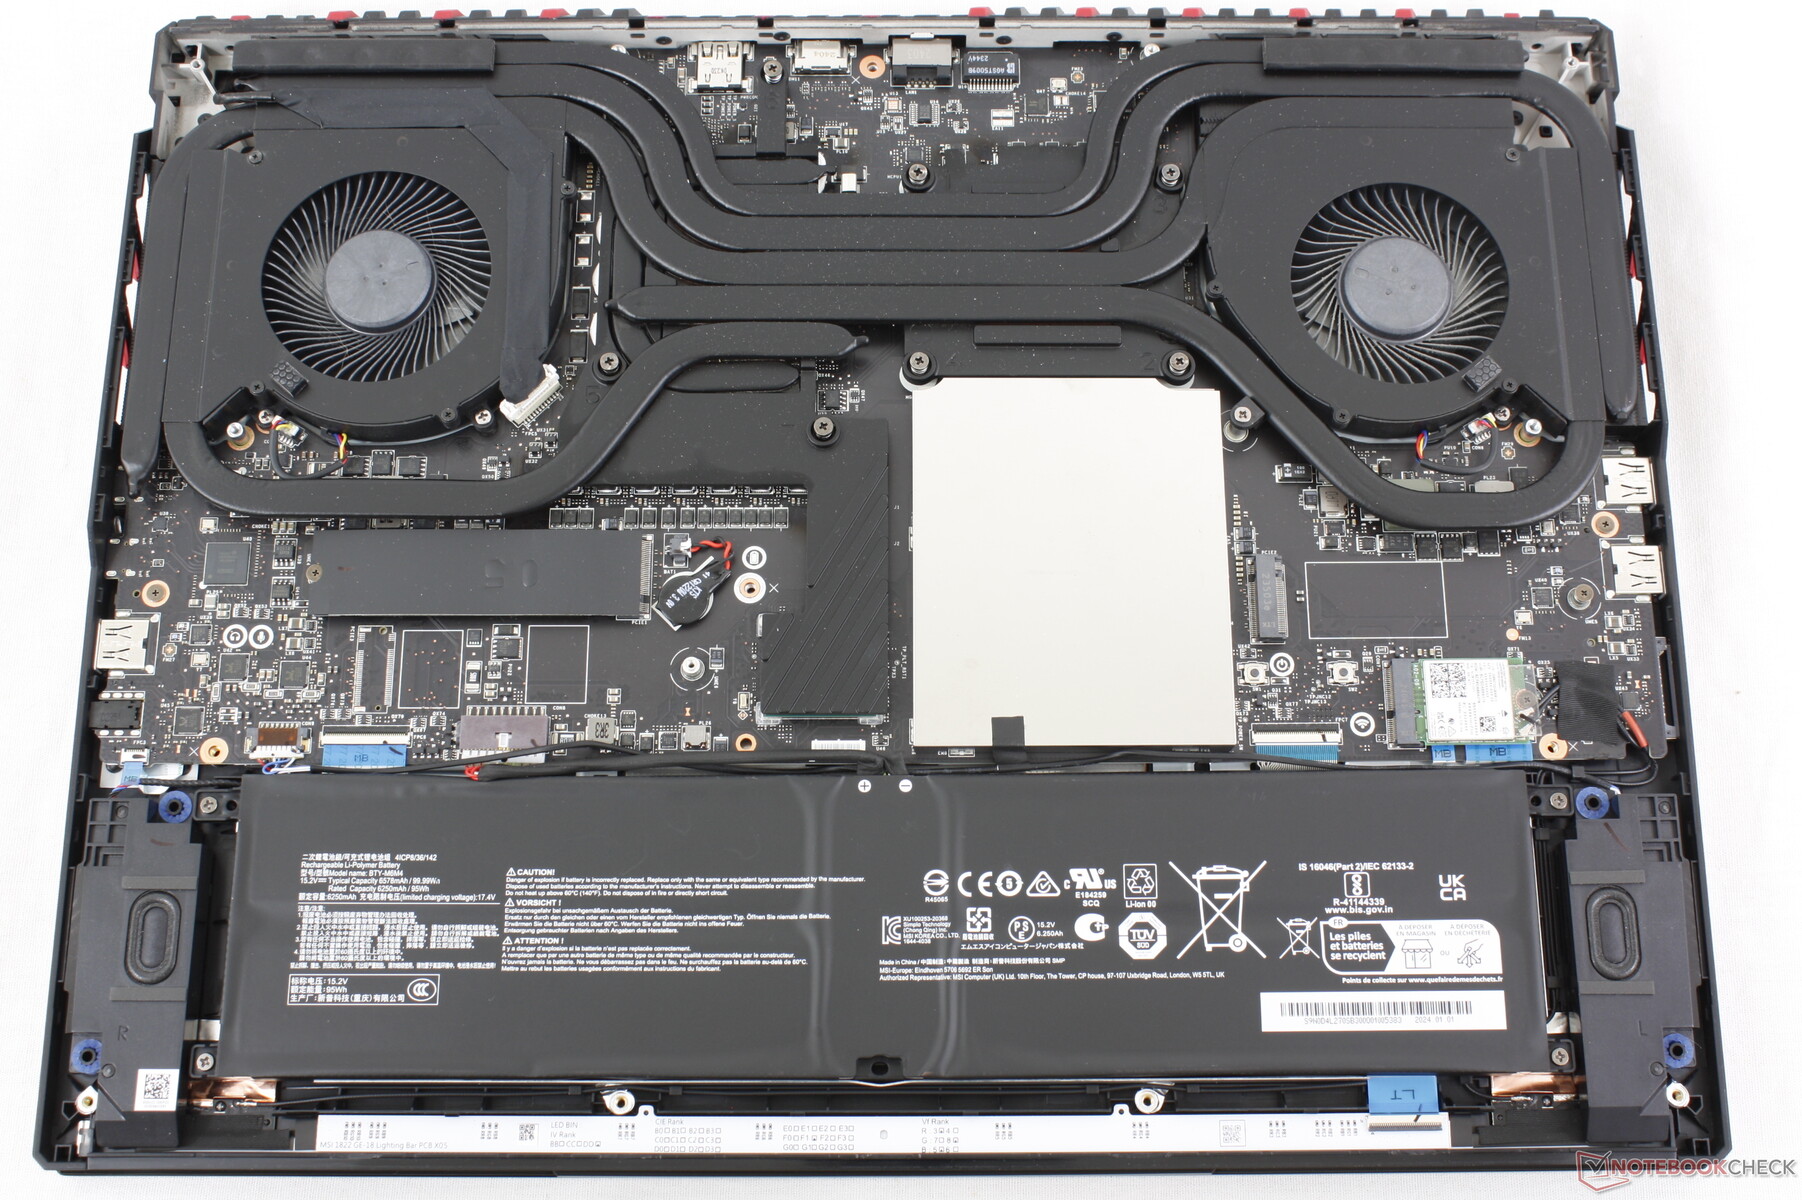
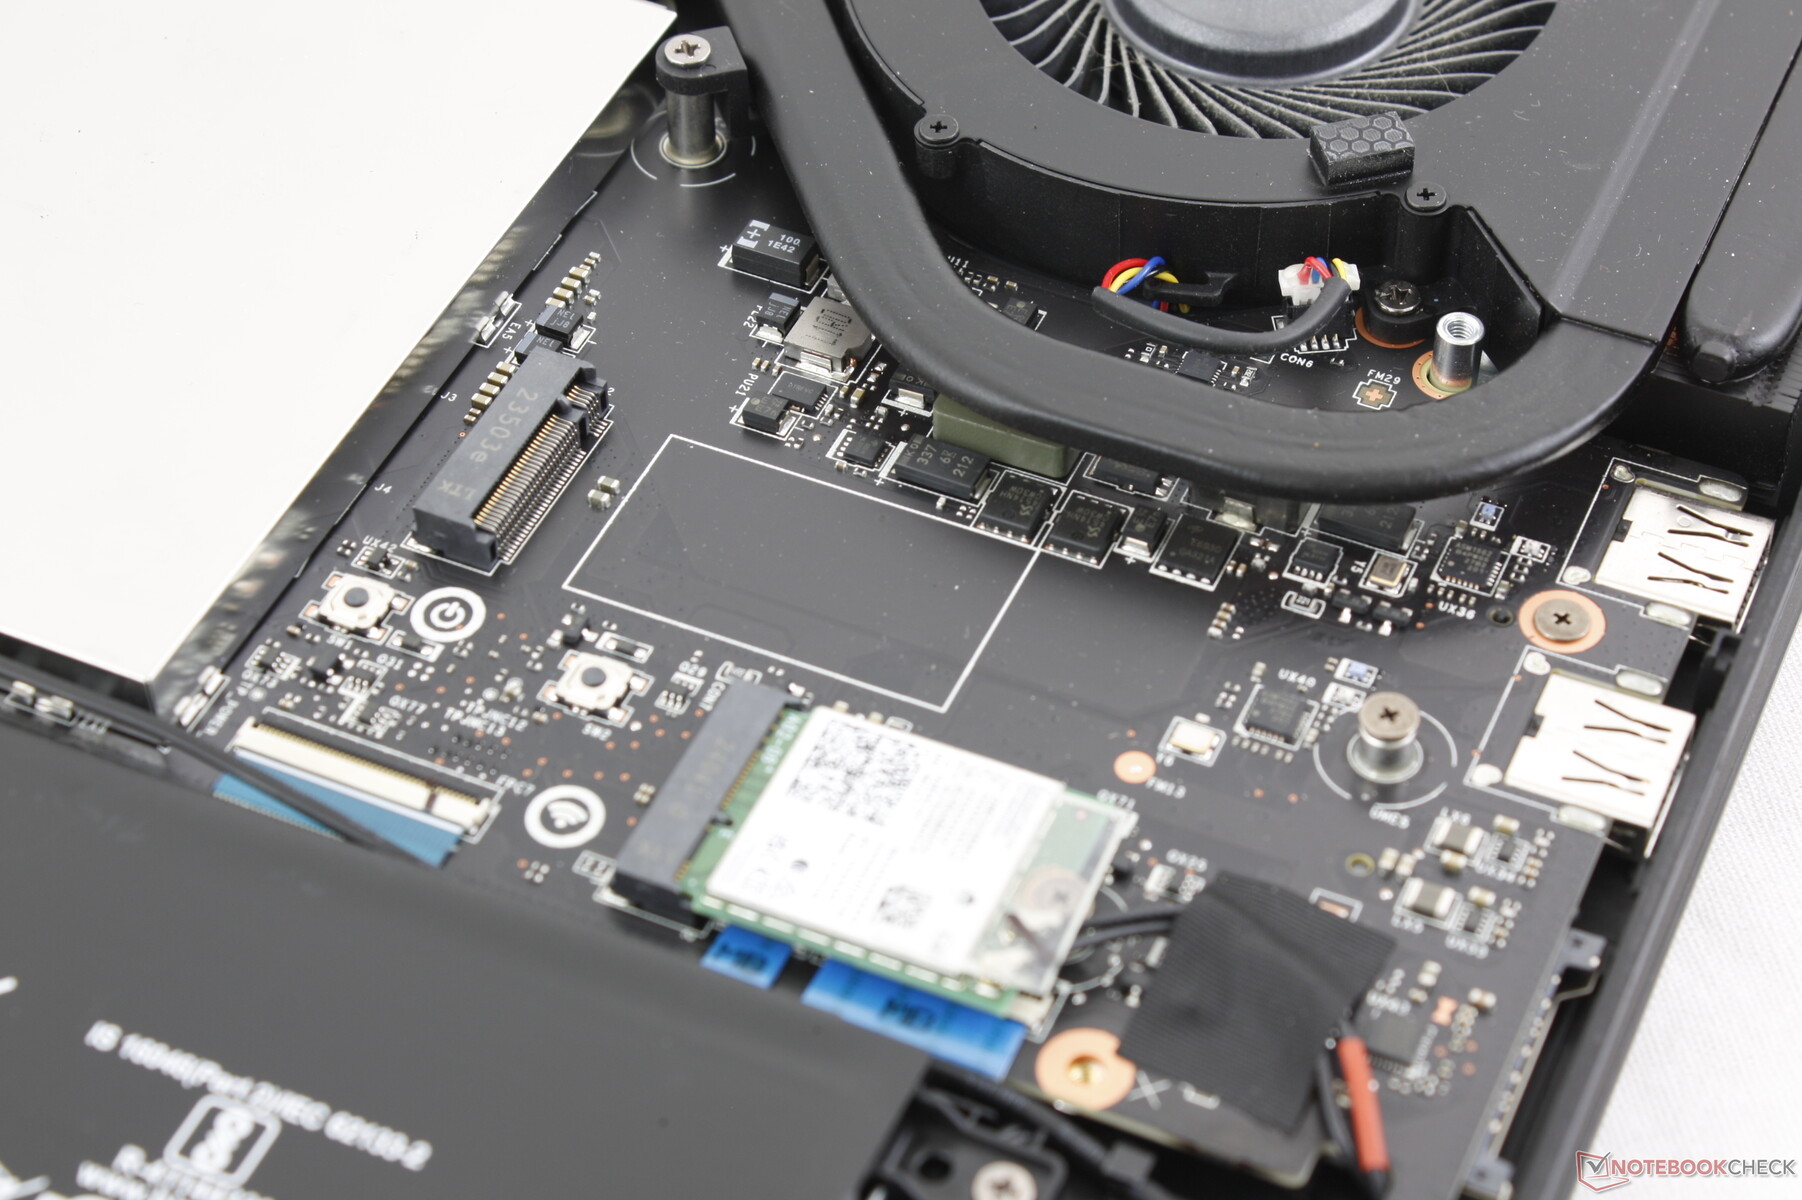
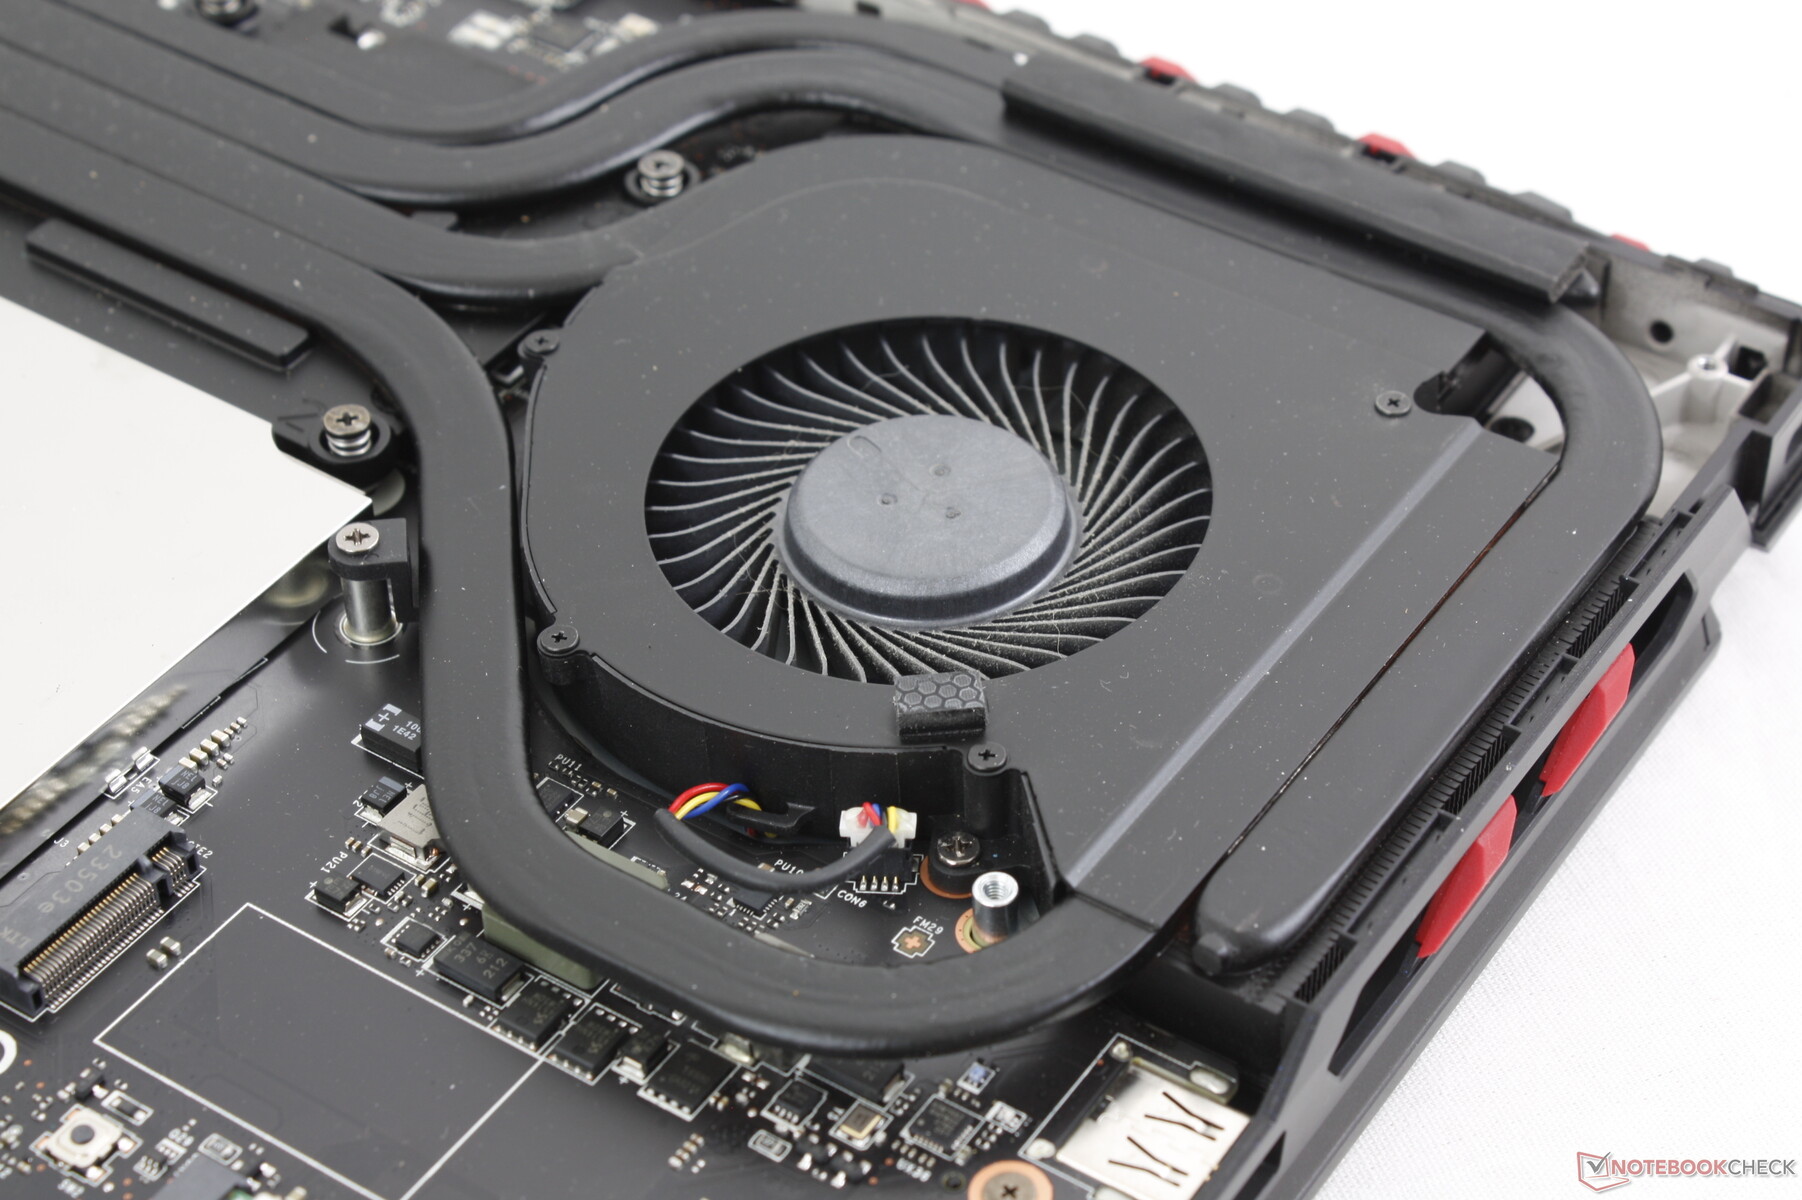
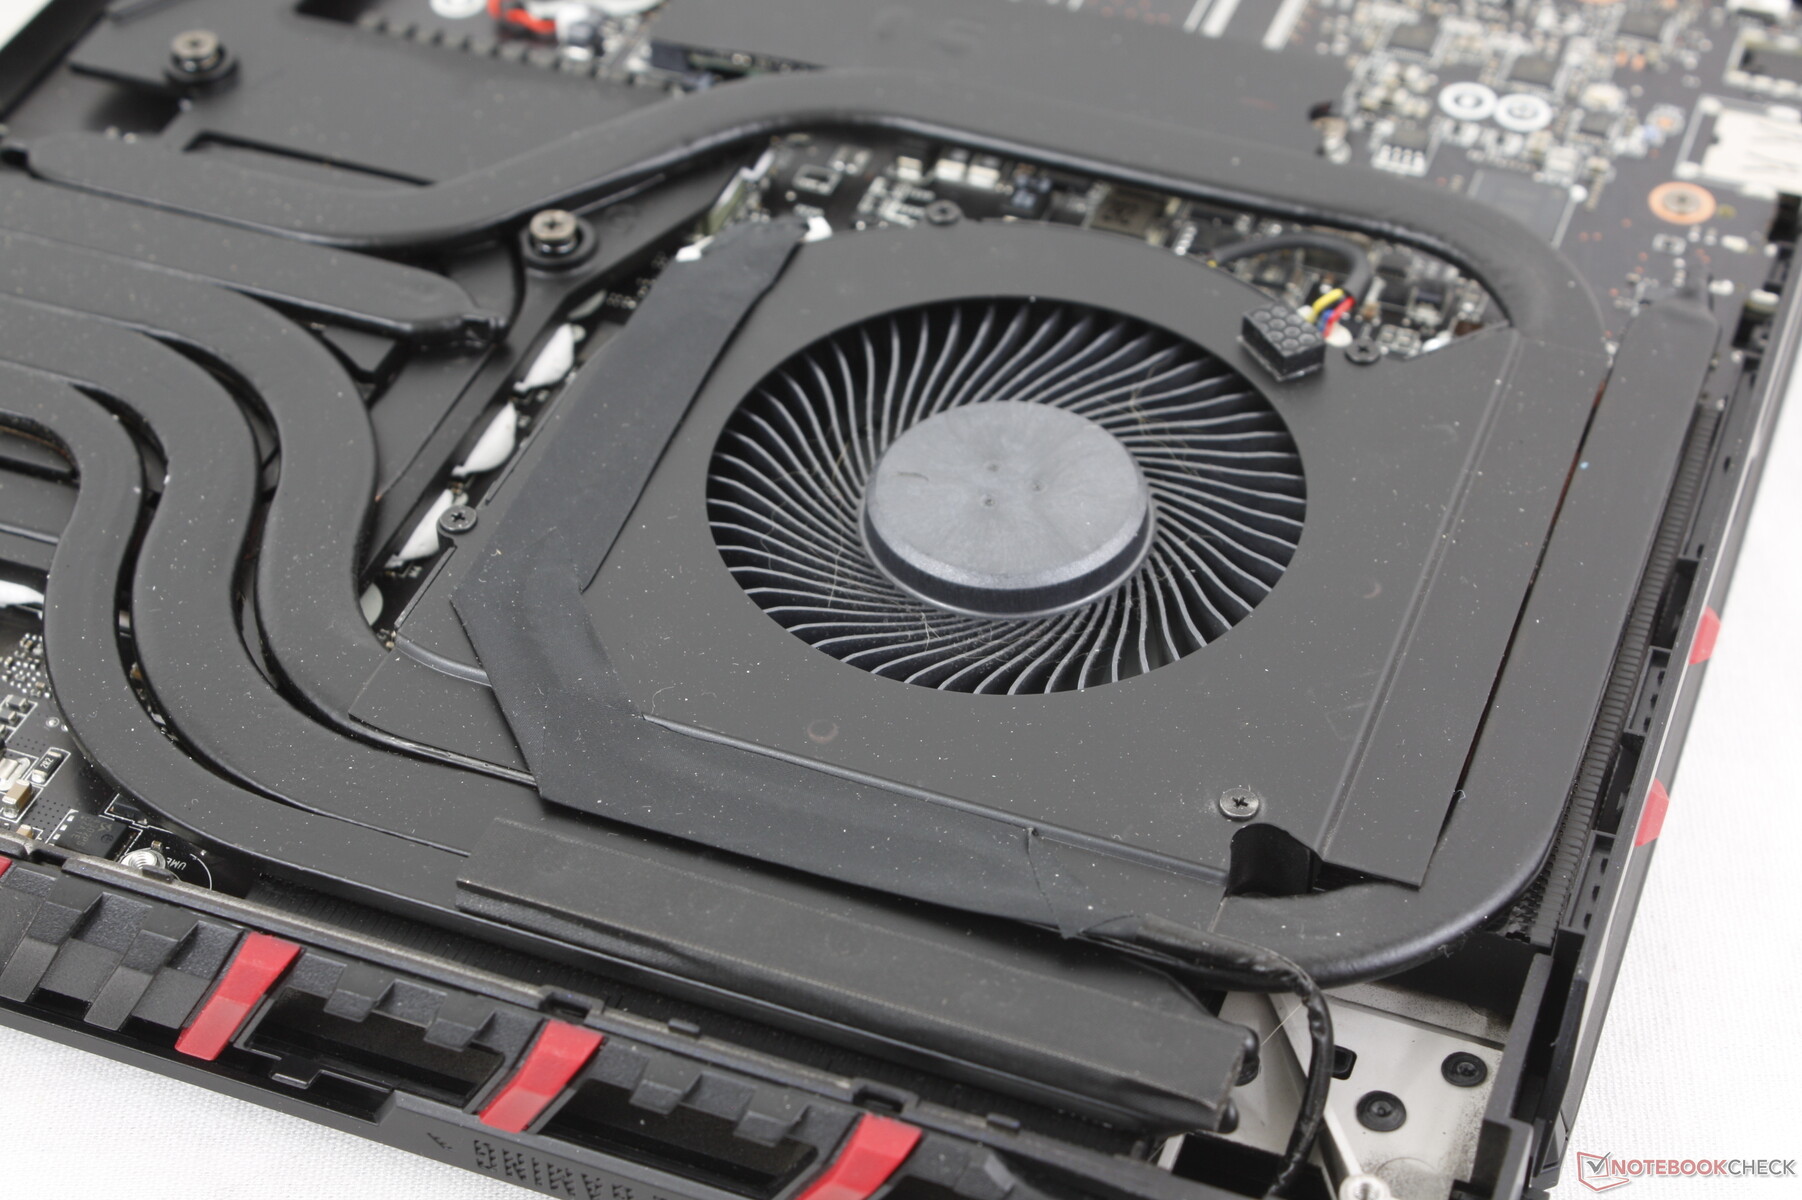
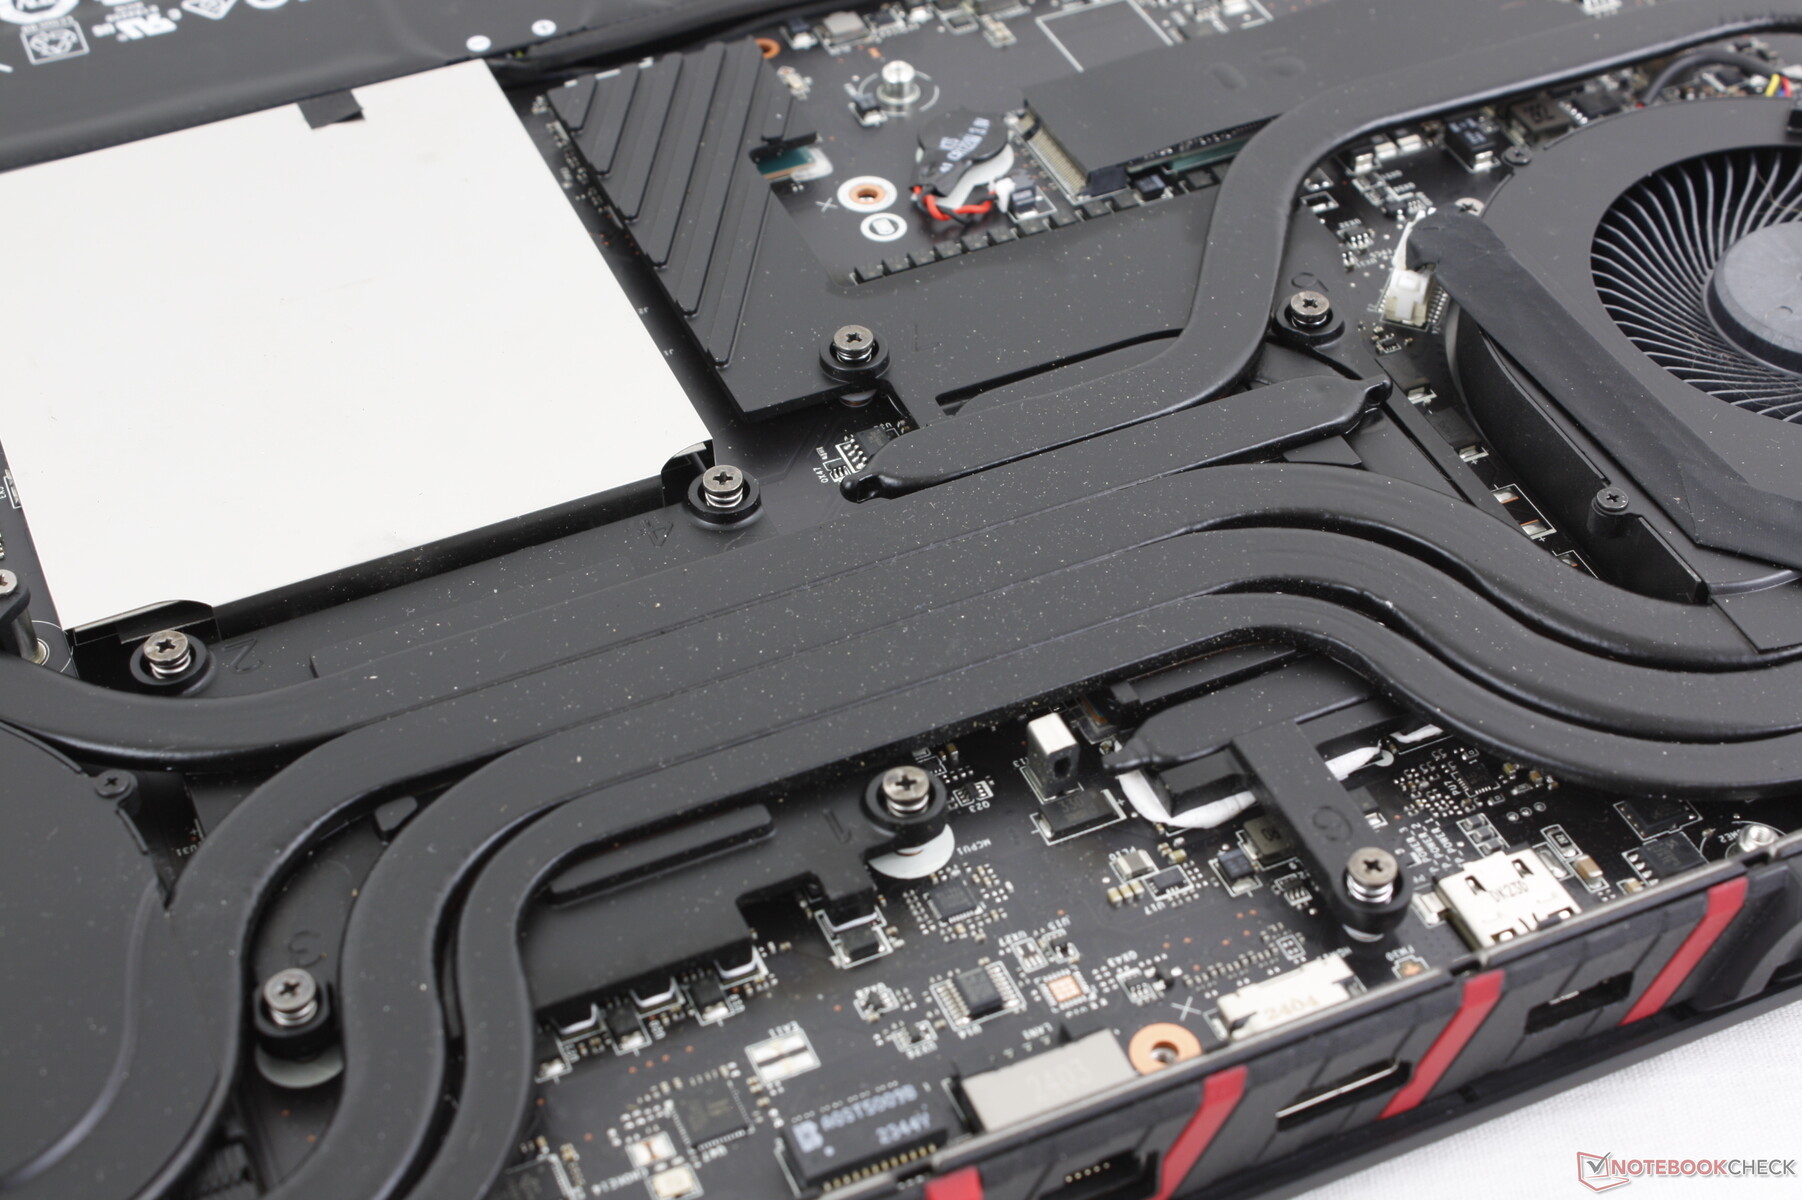
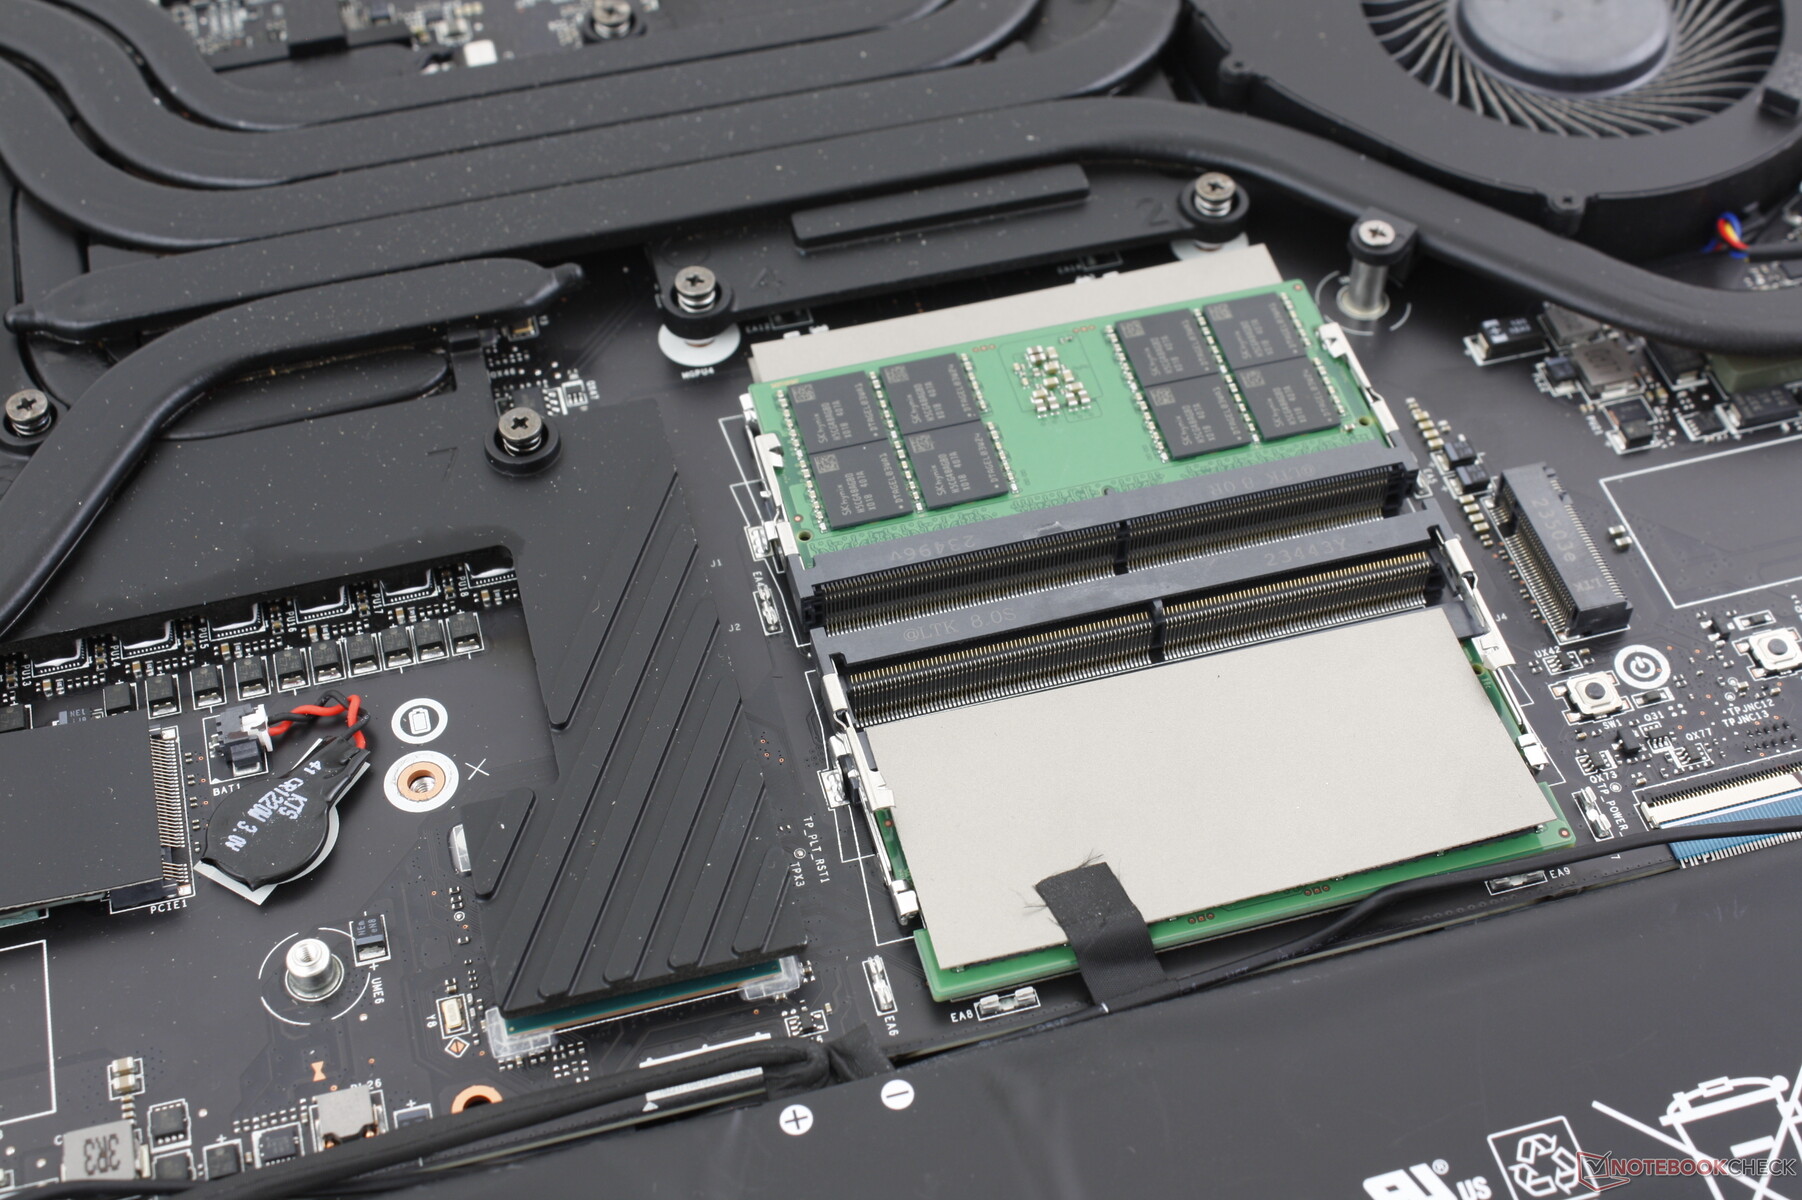
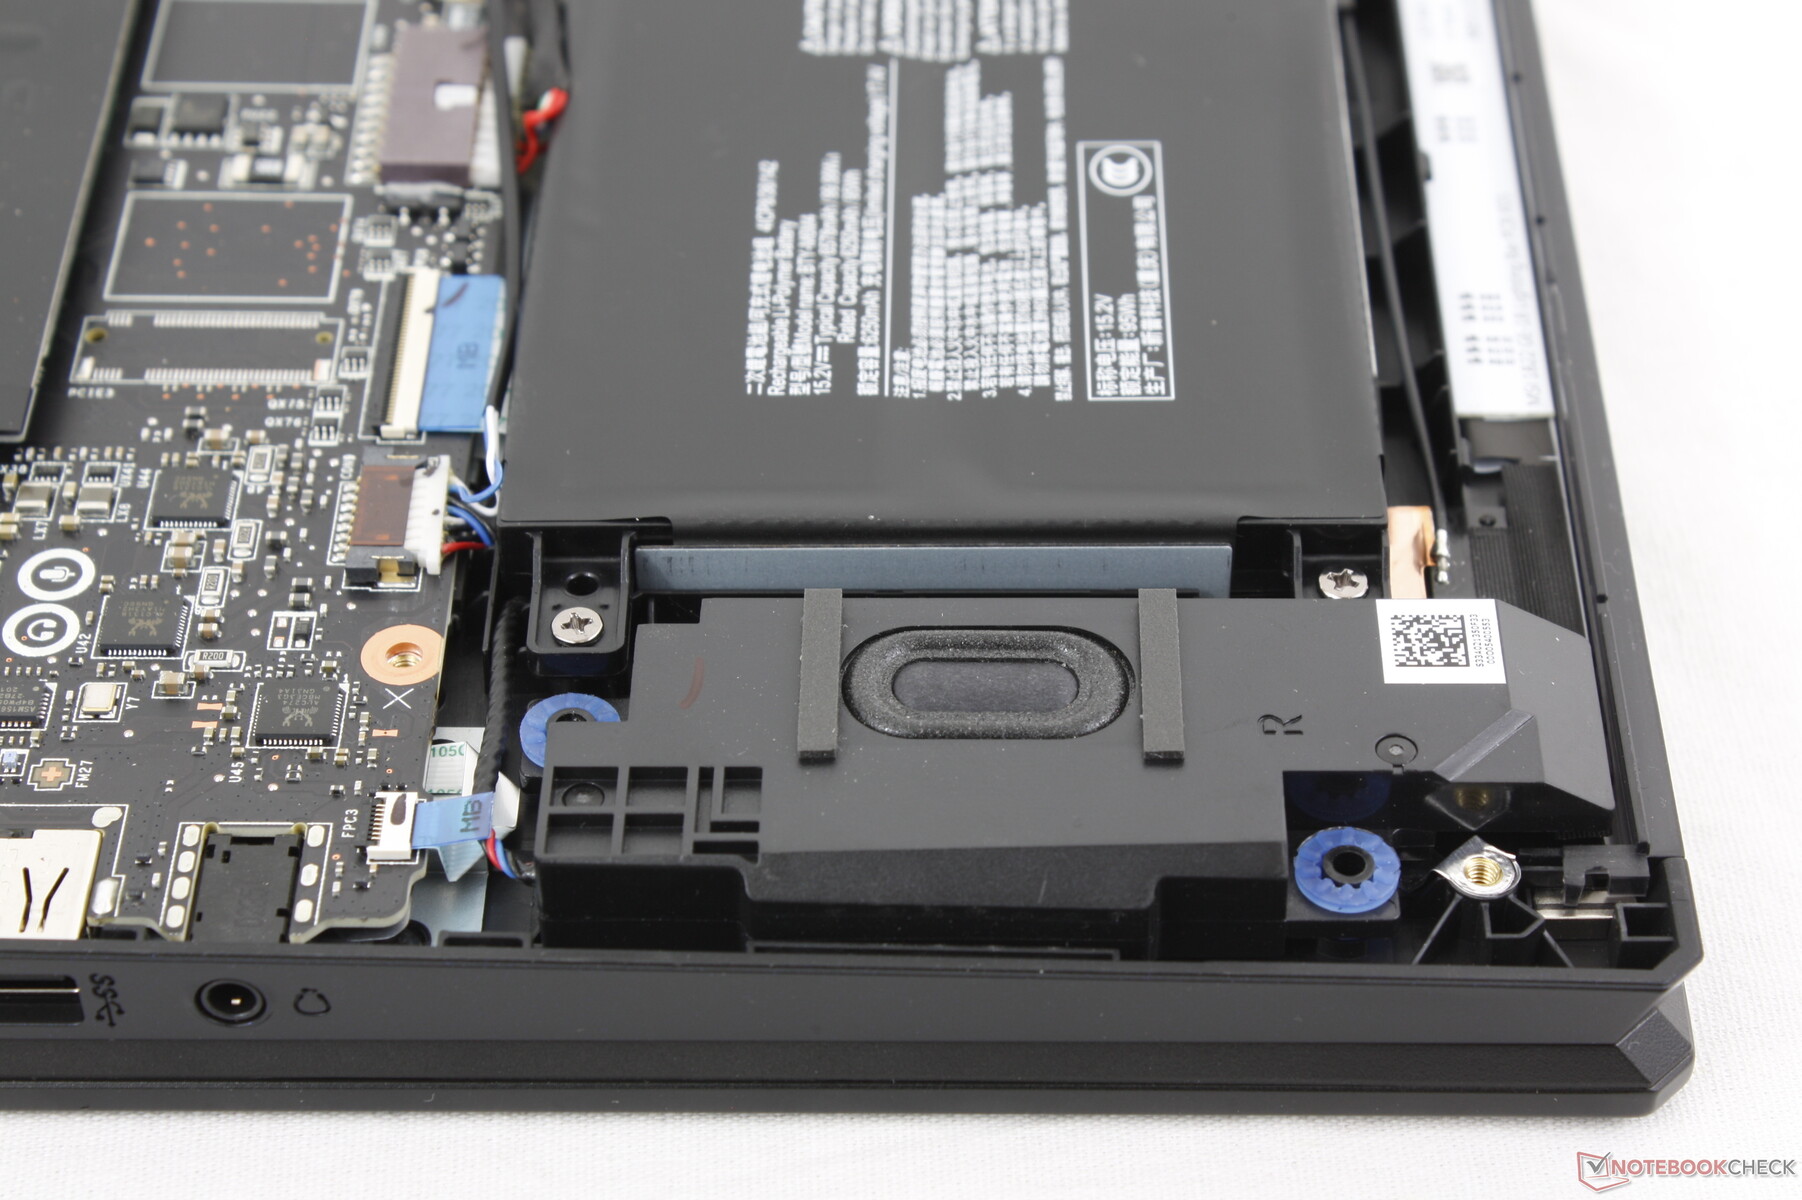
Az alsó panelt 12 Phillips-csavar rögzíti, így viszonylag könnyen eltávolítható. Az MSI azonban továbbra is azon kevés gyártók egyike, amelyeknél az egyik csavart egy manipulációgátló matrica takarja, amelyet még az olyan egyszerű frissítésekhez is el kell törni, mint a RAM vagy a tároló.
A Raider 18 HX sok belső alkatrészben megegyezik a Titan 18 HX-sel. A felhasználók két M.2 2280 SSD-helyhez és négy DDR5 SODIMM slothoz férhetnek hozzá. Megjegyzendő, hogy a harmadik M.2 SSD-helyet eltávolították ebből a modellből; a felhasználóknak a Titan 18 HX-re kell frissíteniük ehhez a funkcióhoz.

Fenntarthatóság
A csomagolás teljes mértékben újrahasznosítható, és szinte csak kartonból áll, csak a felhasználói kézikönyvnek van egy kis műanyag csomagolása. A rendszer gyártása során felhasznált újrahasznosított anyagokról azonban nincs információ.
Tartozékok és garancia
A dobozban a hálózati adapteren és a papírmunkán kívül nincs más extra. A régebbi Raider modellekhez egy bársony tisztítókendő is jár, de úgy tűnik, hogy ez már nem így van.
Az USA-ban történő vásárlás esetén a szokásos egyéves korlátozott gyártói garancia érvényes.
Beviteli eszközök - Ismerős a divatos helyett
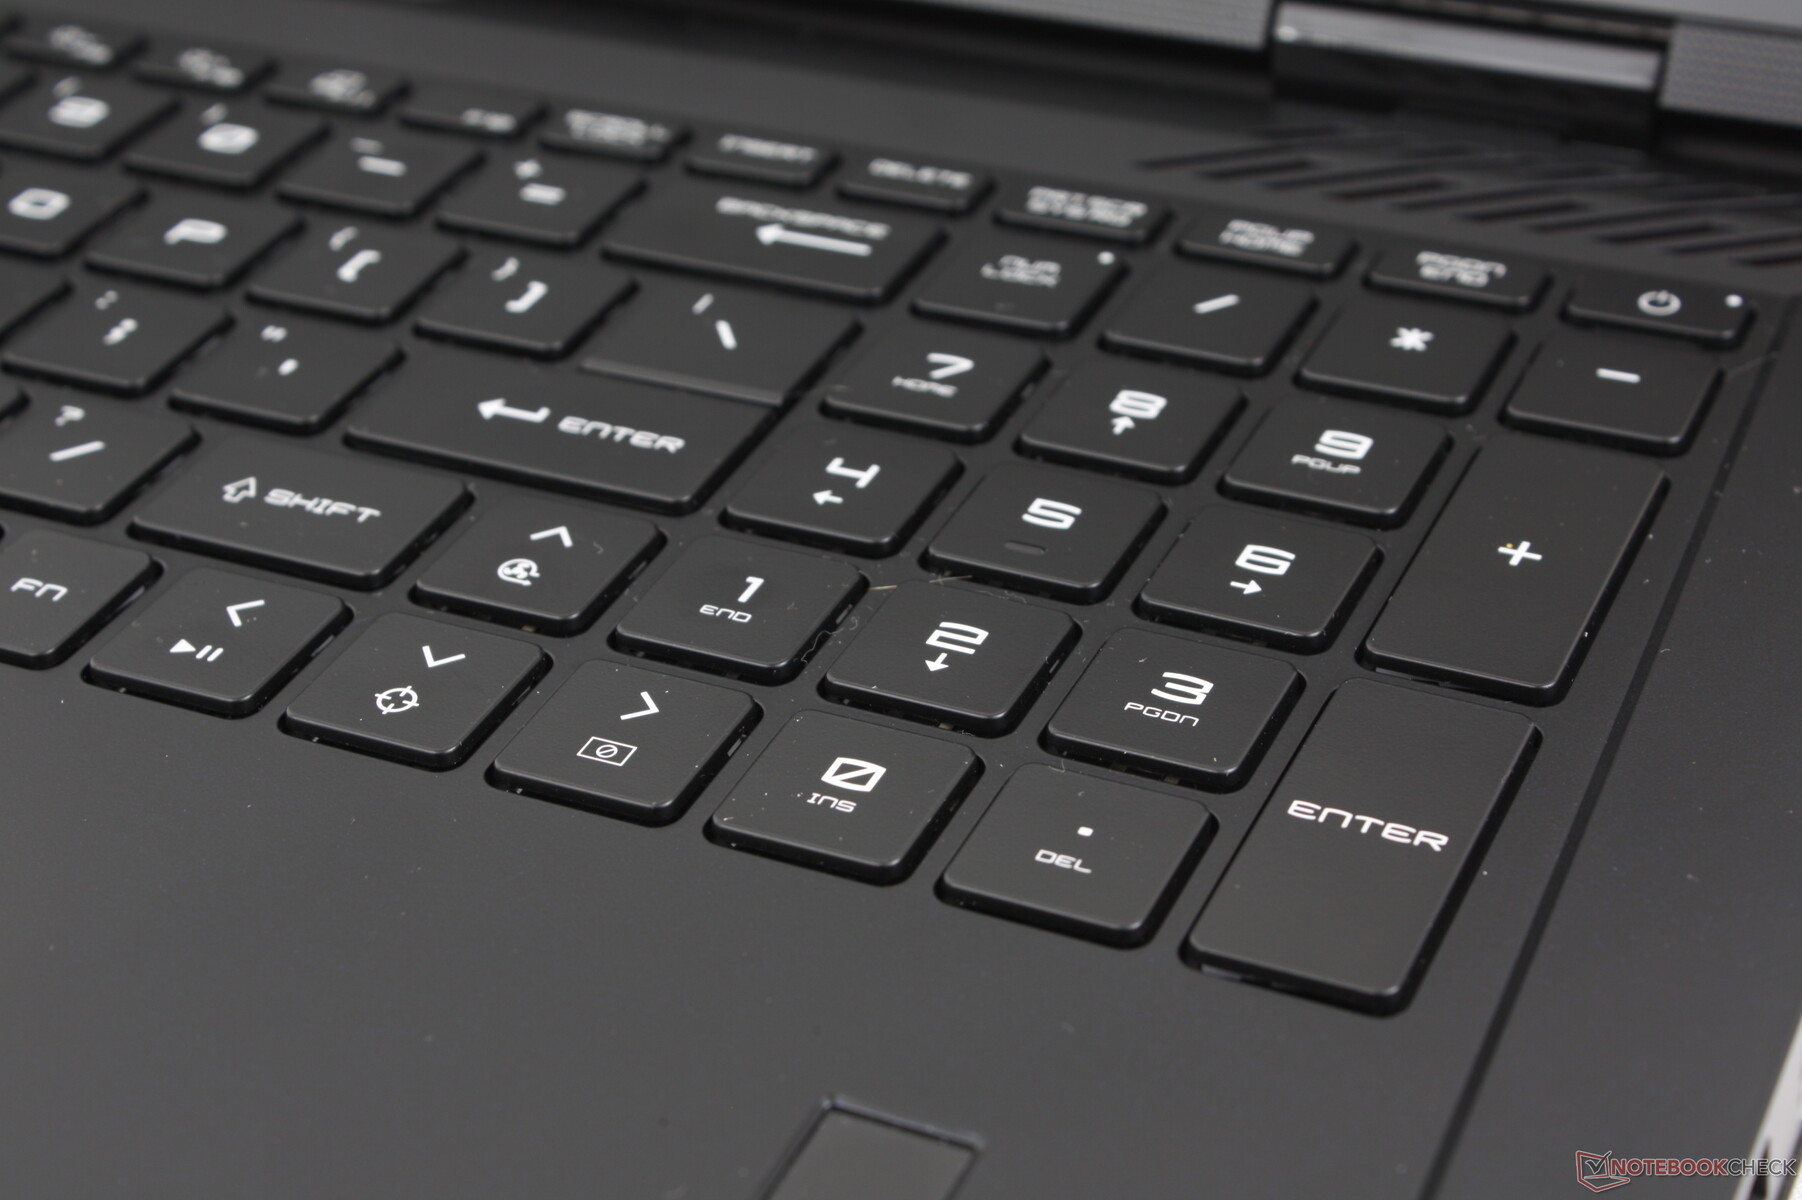
Billentyűzet
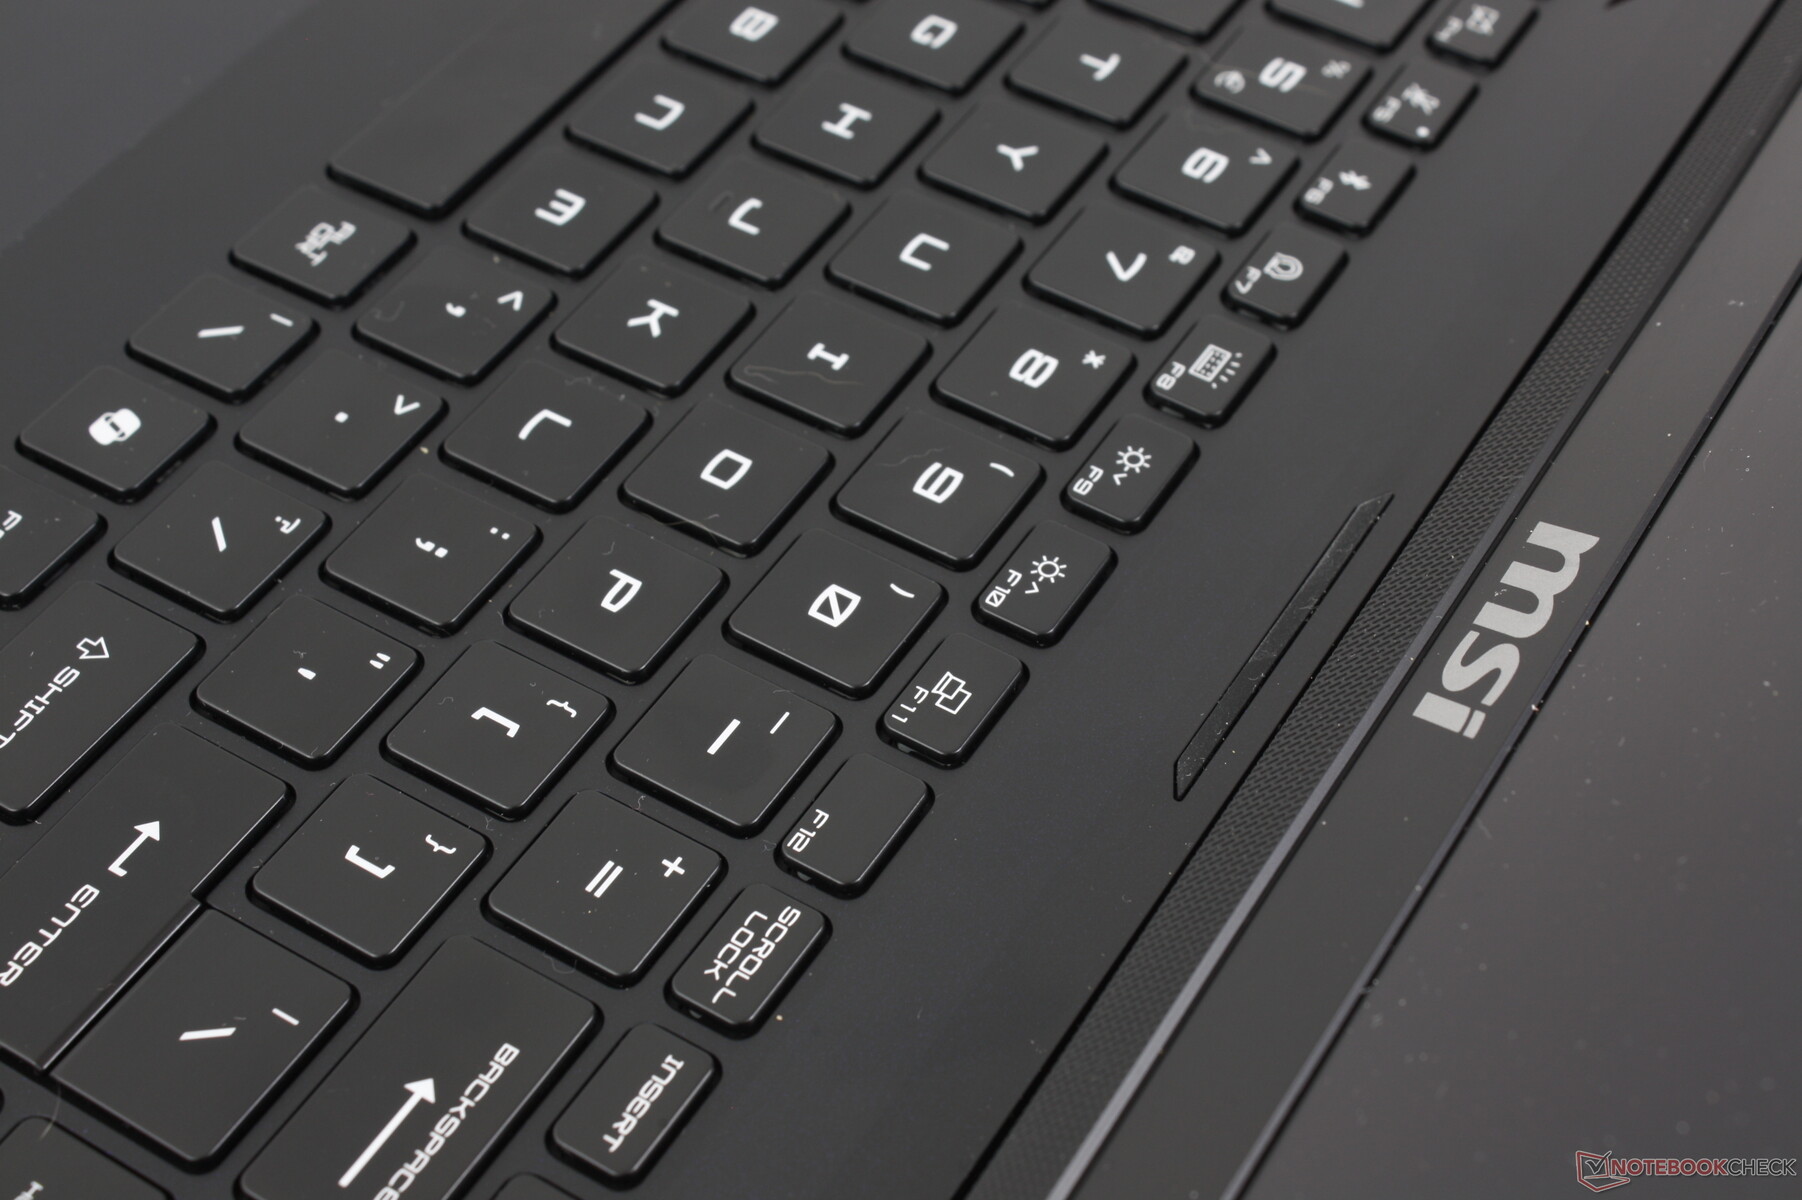
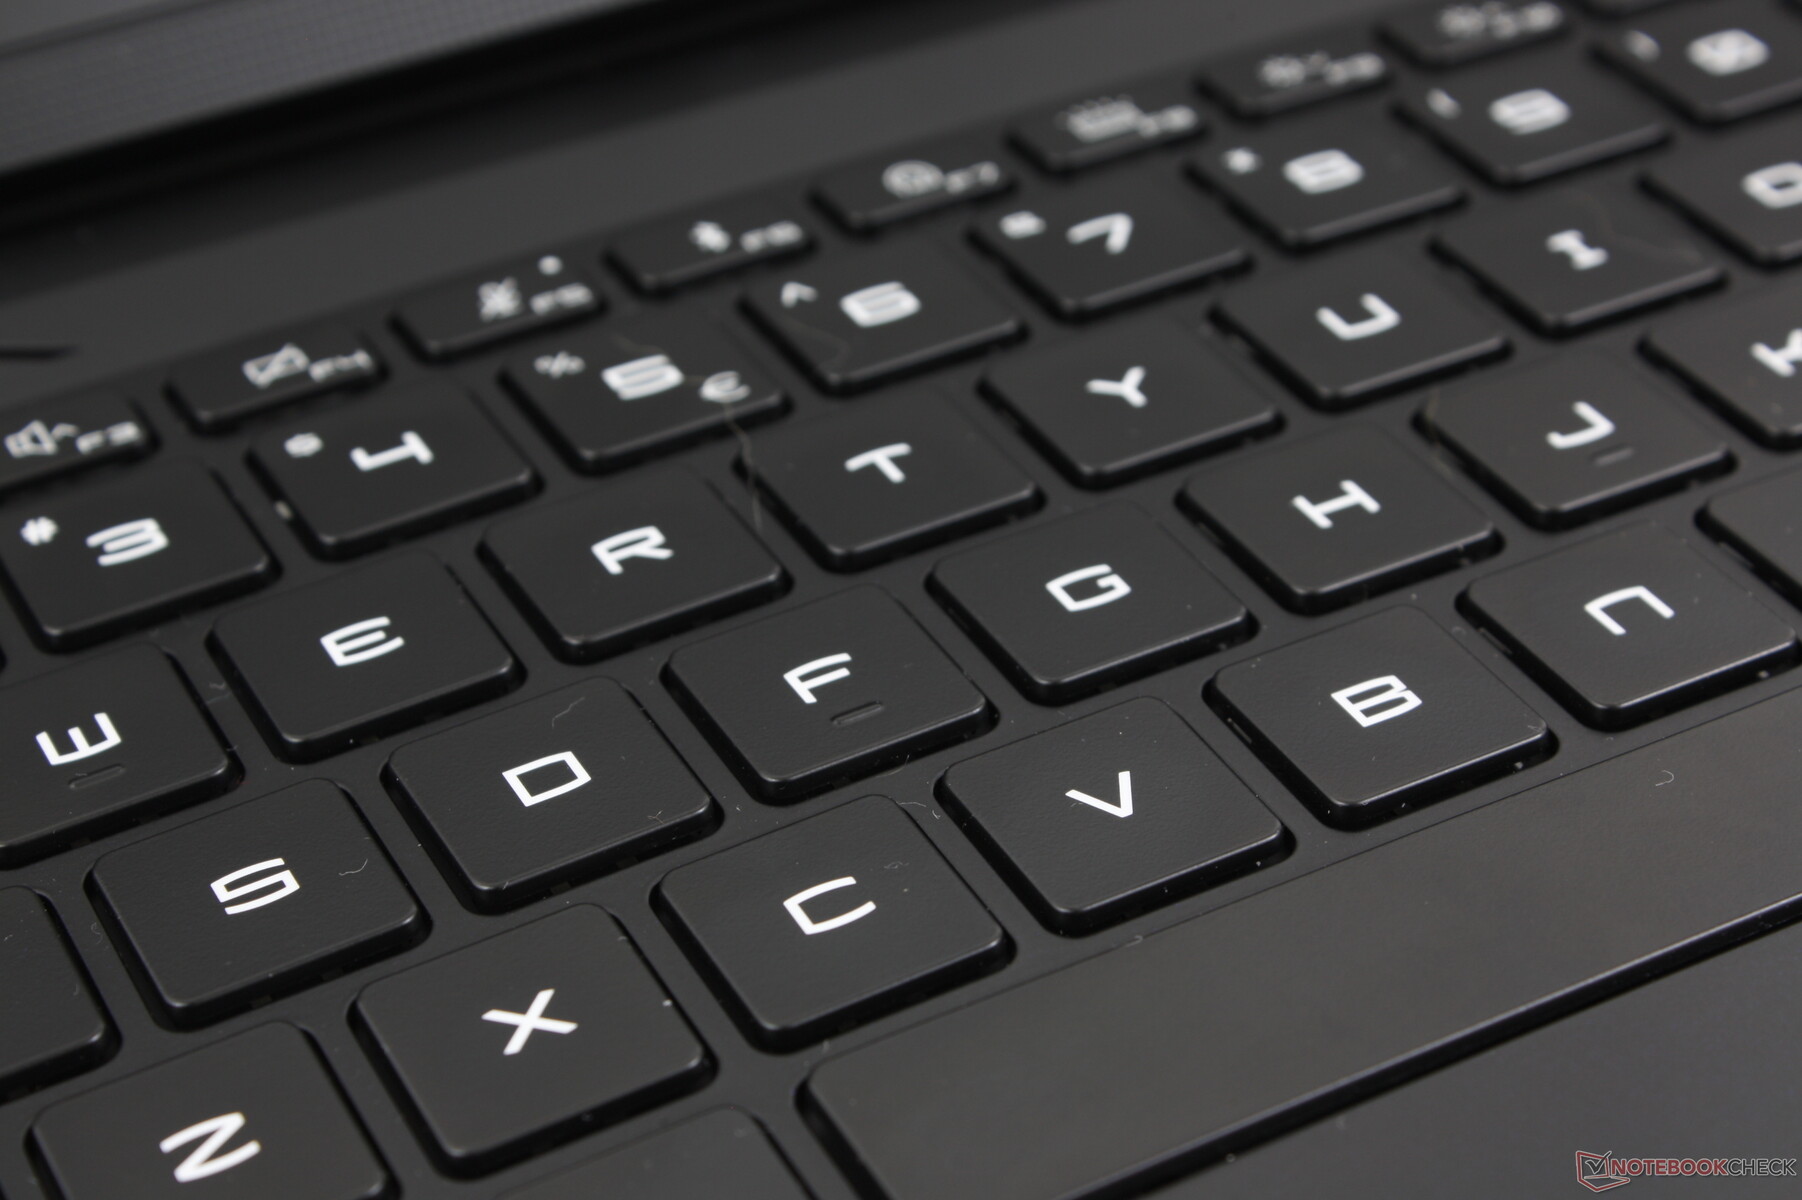
A billentyűzet vizuálisan megegyezik a Titan 18 HX billentyűzetével, de van egy nagyon fontos különbség: A CherryMX mechanikus opciók hiánya. A Raider 18 HX-en való gépelés ezért közelebb áll a hagyományosabb laptop billentyűzeteken való gépeléshez, mint például a MSI Stealth 16 vagy a régebbi generációs Raider modellekhez. A visszajelzés közel sem olyan kattogó vagy határozott, de a lágyabb csattogás előnyösebb lehet olyan környezetben, mint a konferenciatermek, tantermek, könyvtárak vagy kollégiumi szobák.
Különösen nagyra értékeljük a teljes méretű numpadot és a nyílbillentyűket, mivel ezek általában keskenyebbek és kisebbek, mint a legtöbb más laptop fő QWERTY-billentyűi. A táblázatkezelői munka ezért sokkal kényelmesebb a Raider 18 HX-en, mint a Blade 18-on vagy a ROG Strix G18.
Touchpad
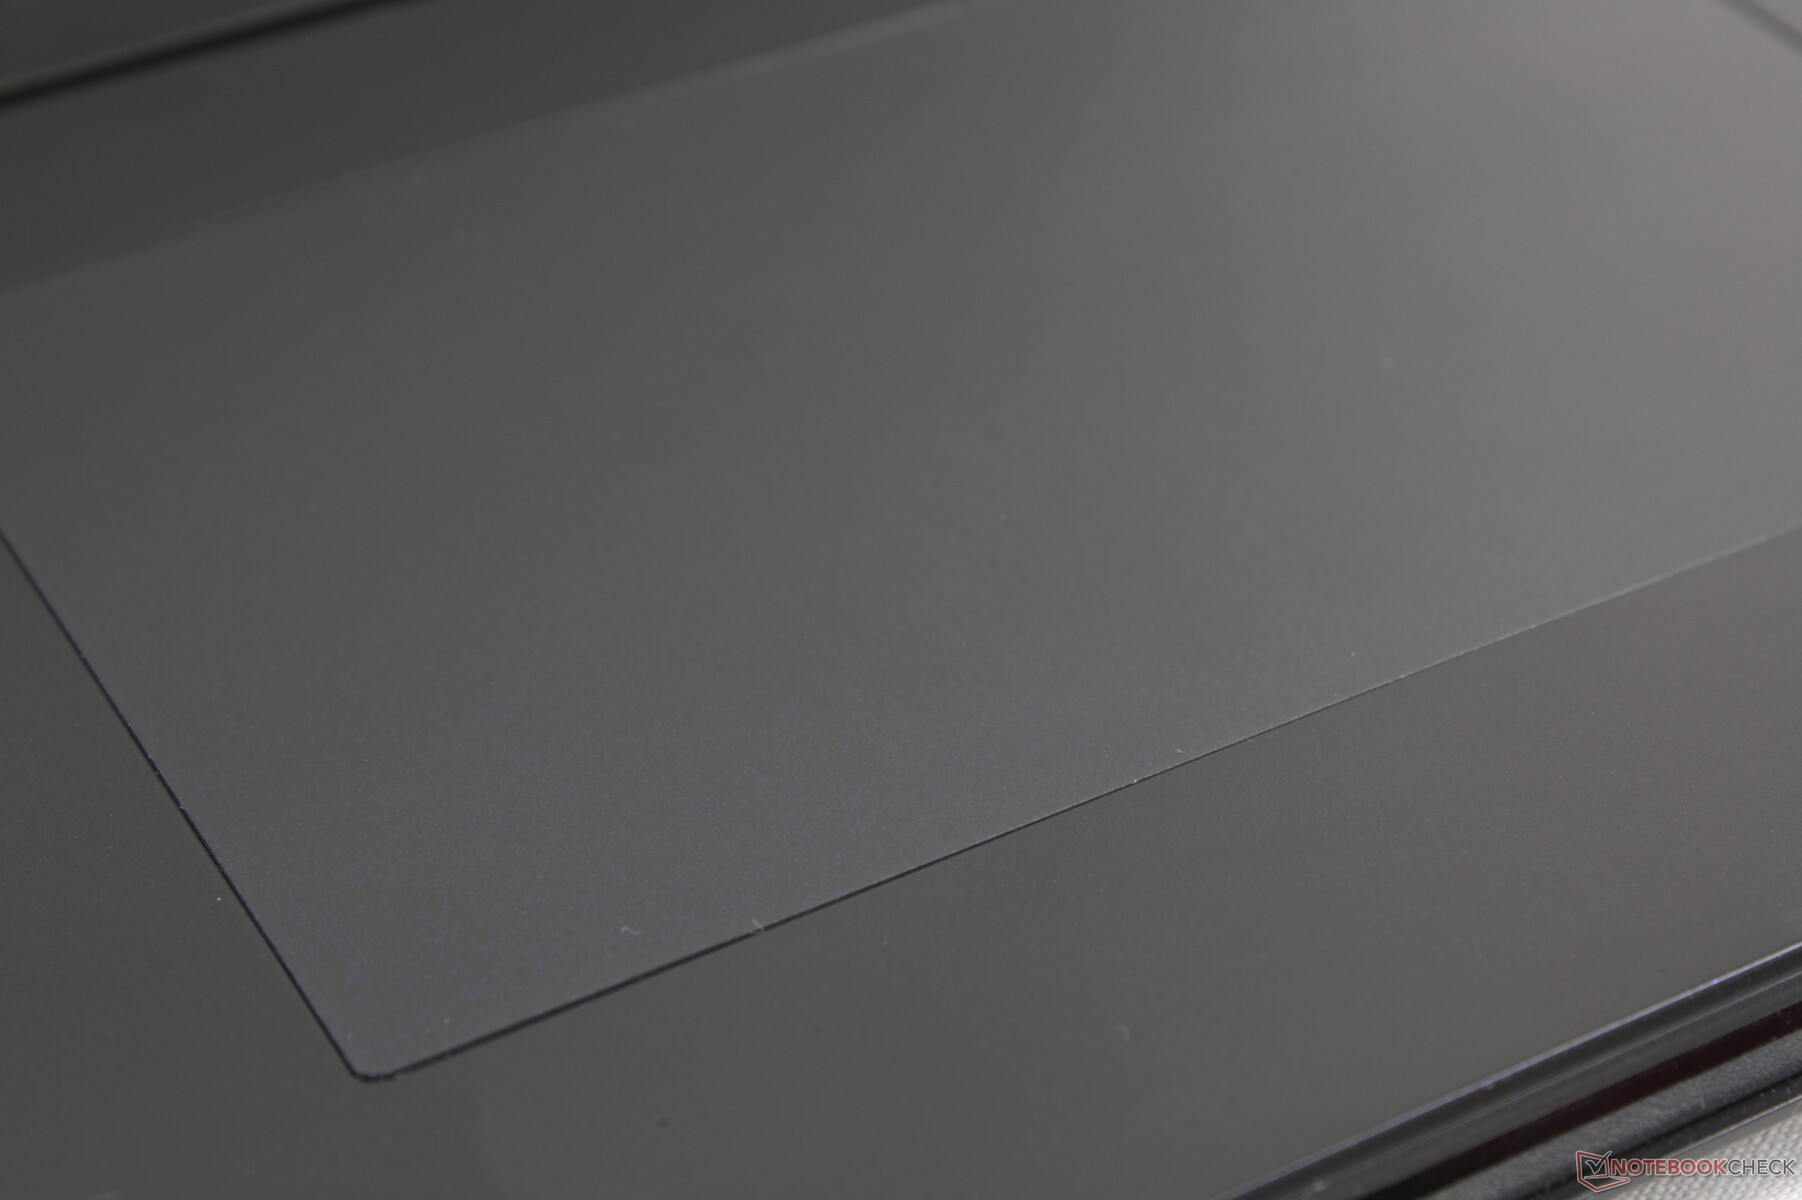
Ellentétben a Titan 18 HX divatos, LED-világítású, szél nélküli kattintópadjával, a Raider 18 HX hagyományos kattintópadot használ a megszokottabb érzés érdekében. A méret pontosan ugyanaz marad (13 x 8,2 cm), és vitathatatlanul kényelmesebb a használata, mivel nem próbál semmi újat nyújtani, vagy olyan problémát megoldani, ami eleve nem is volt ott. A tapadás rendkívül sima, csak lassabb sebességnél ragad egy kicsit a pontosság érdekében.
A kattintás beviteléhez szükséges lenyomás sajnos még mindig sekélyes és puha, nem kielégítő visszajelzéssel. Egy erősebb és határozottabb kattintás lett volna kívánatos, vagy akár a dedikált egérbillentyűk visszatérése, mivel a billentyűzetlap elég tágas.
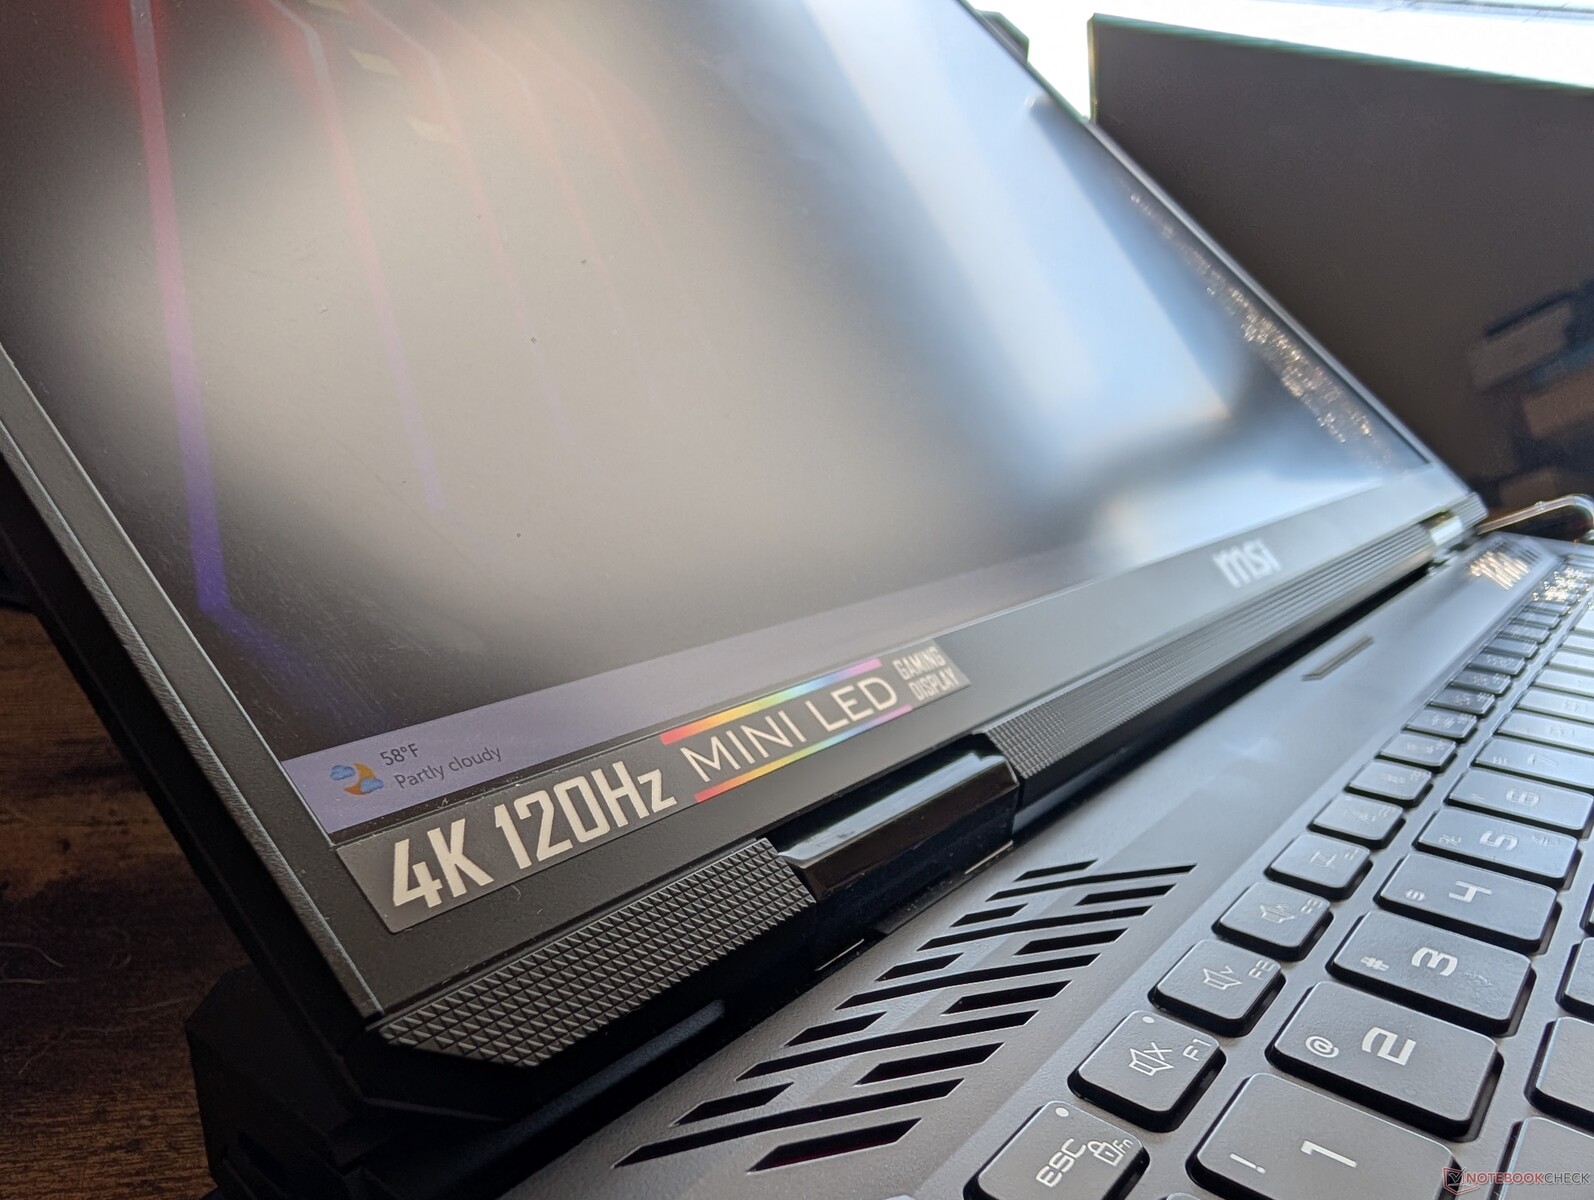
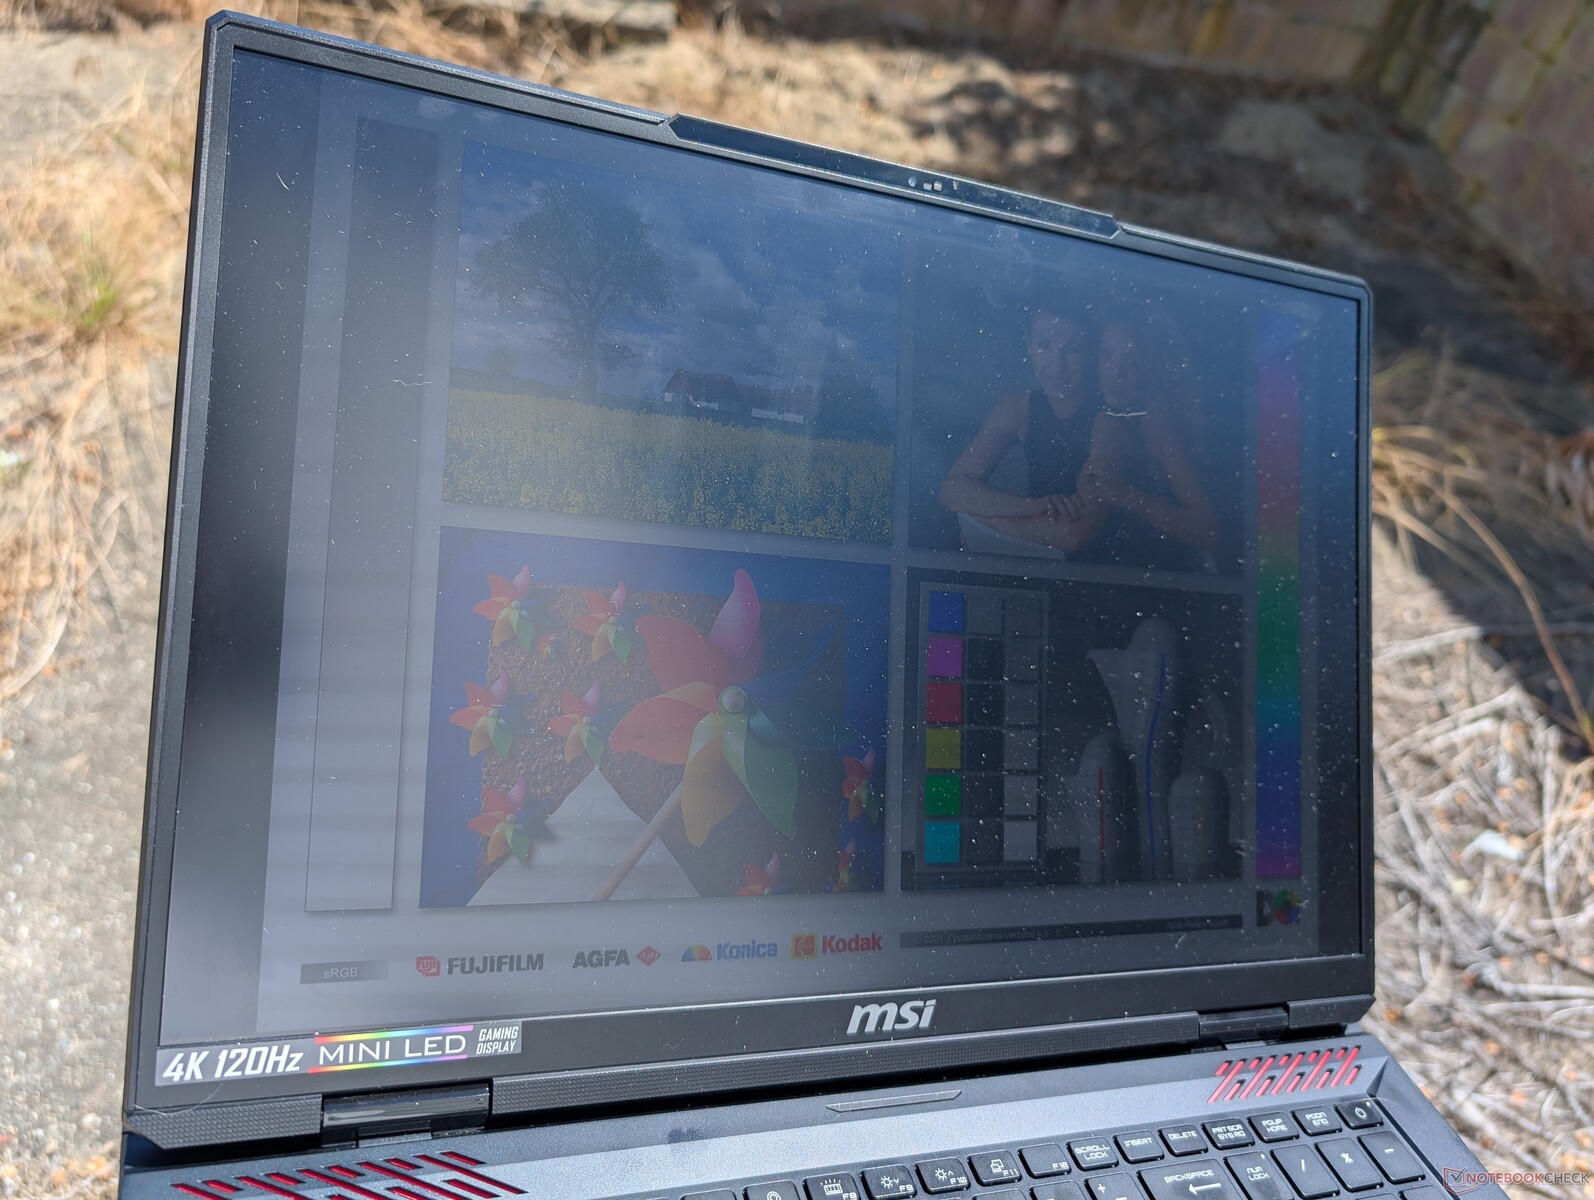
Kijelző - Titan 18 HX Experience For Less
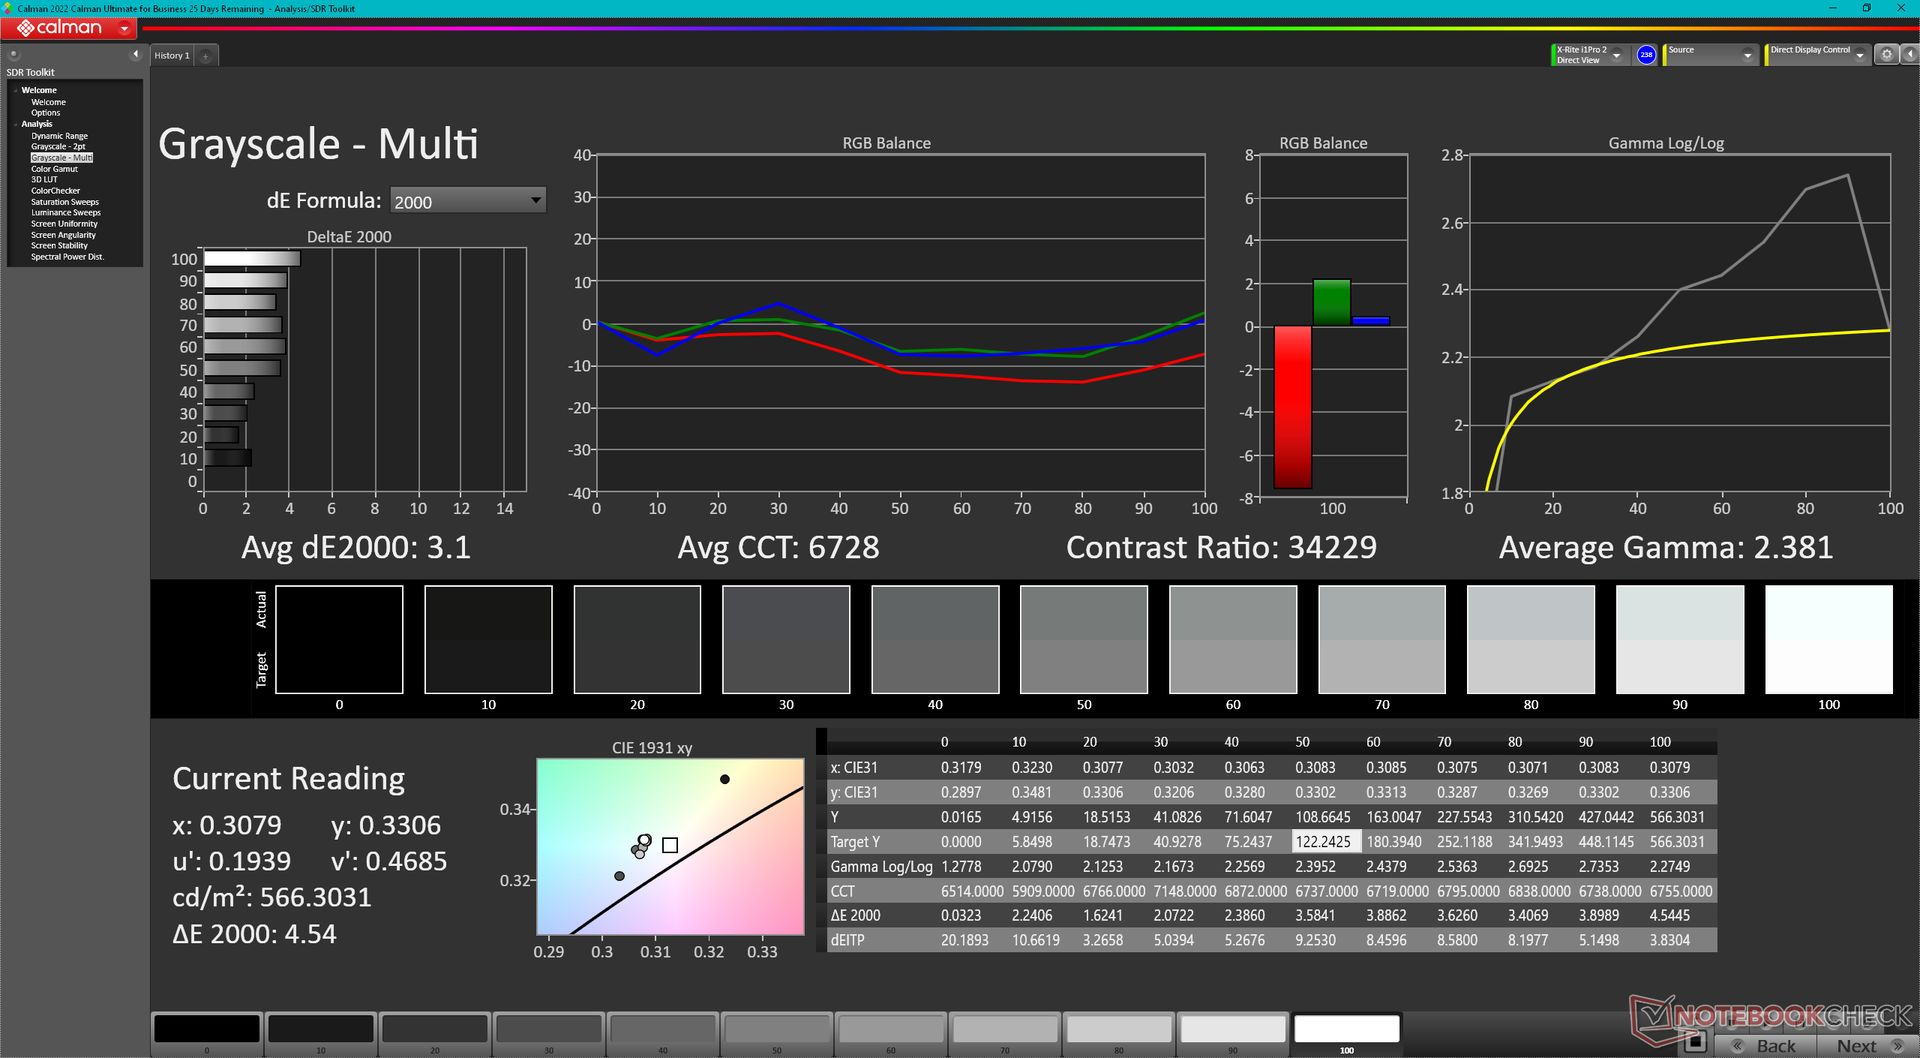
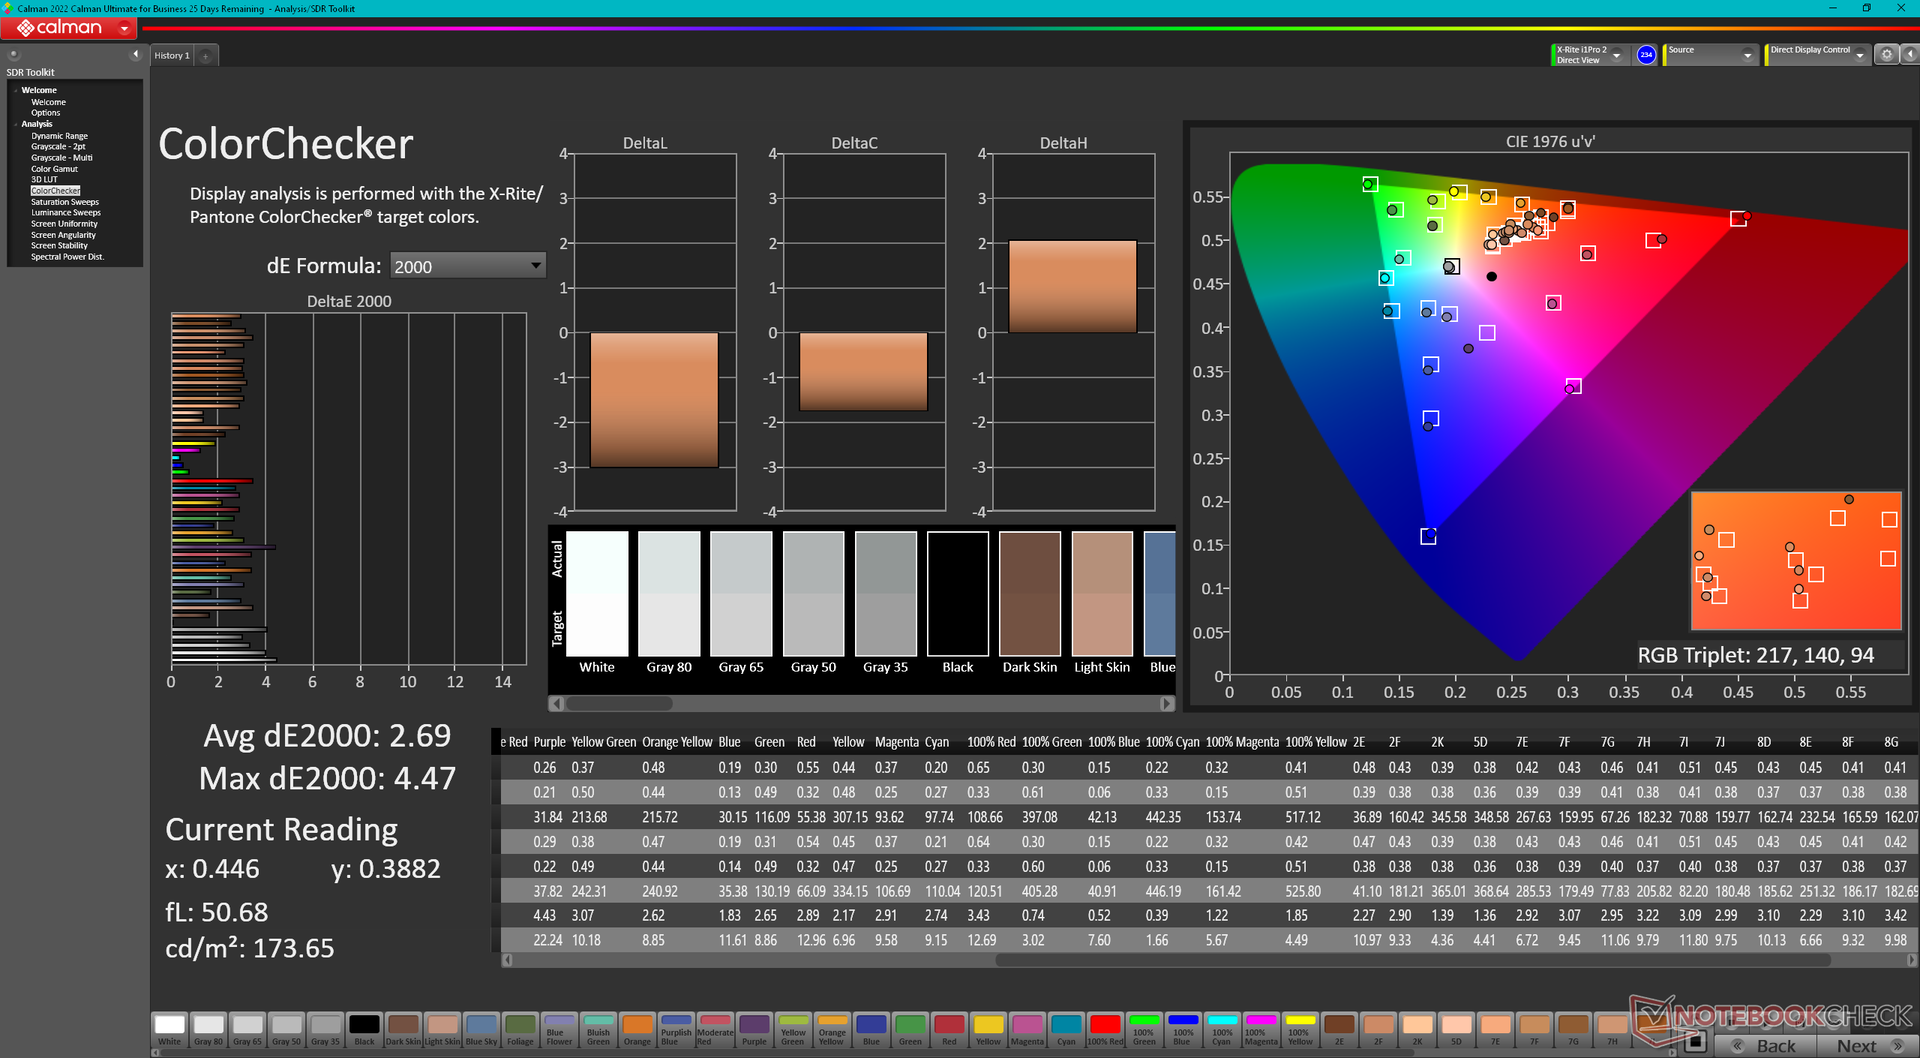
A Raider 18 HX pontosan ugyanazzal az AU Optronics B180ZAN01.0 120 Hz-es mini-LED panellel van felszerelve, mint a Titan 18 HX, így gyakorlatilag azonos látványt nyújt. A maximális fényerő csúcsértéke közel 600 nit, ha a HDR ki van kapcsolva, vagy 935 nit, ha a HDR be van kapcsolva. Az IPS-hez vagy az OLED-hez képest a mini-LED jobb HDR-nézési élményt nyújt, mivel magasabb fényerőszintet képes elérni, mint bármelyik, de ez magasabb energiafogyasztás árán. Az IPS vagy OLED laptopok jellemzően a legjobb esetben is HDR600, míg a mini-LED panelek gyakran HDR1000-et ígérnek.
| |||||||||||||||||||||||||
Fényerő megoszlás: 94 %
Centrumban: 392.2 cd/m²
Kontraszt: ∞:1 (Fekete: 0 cd/m²)
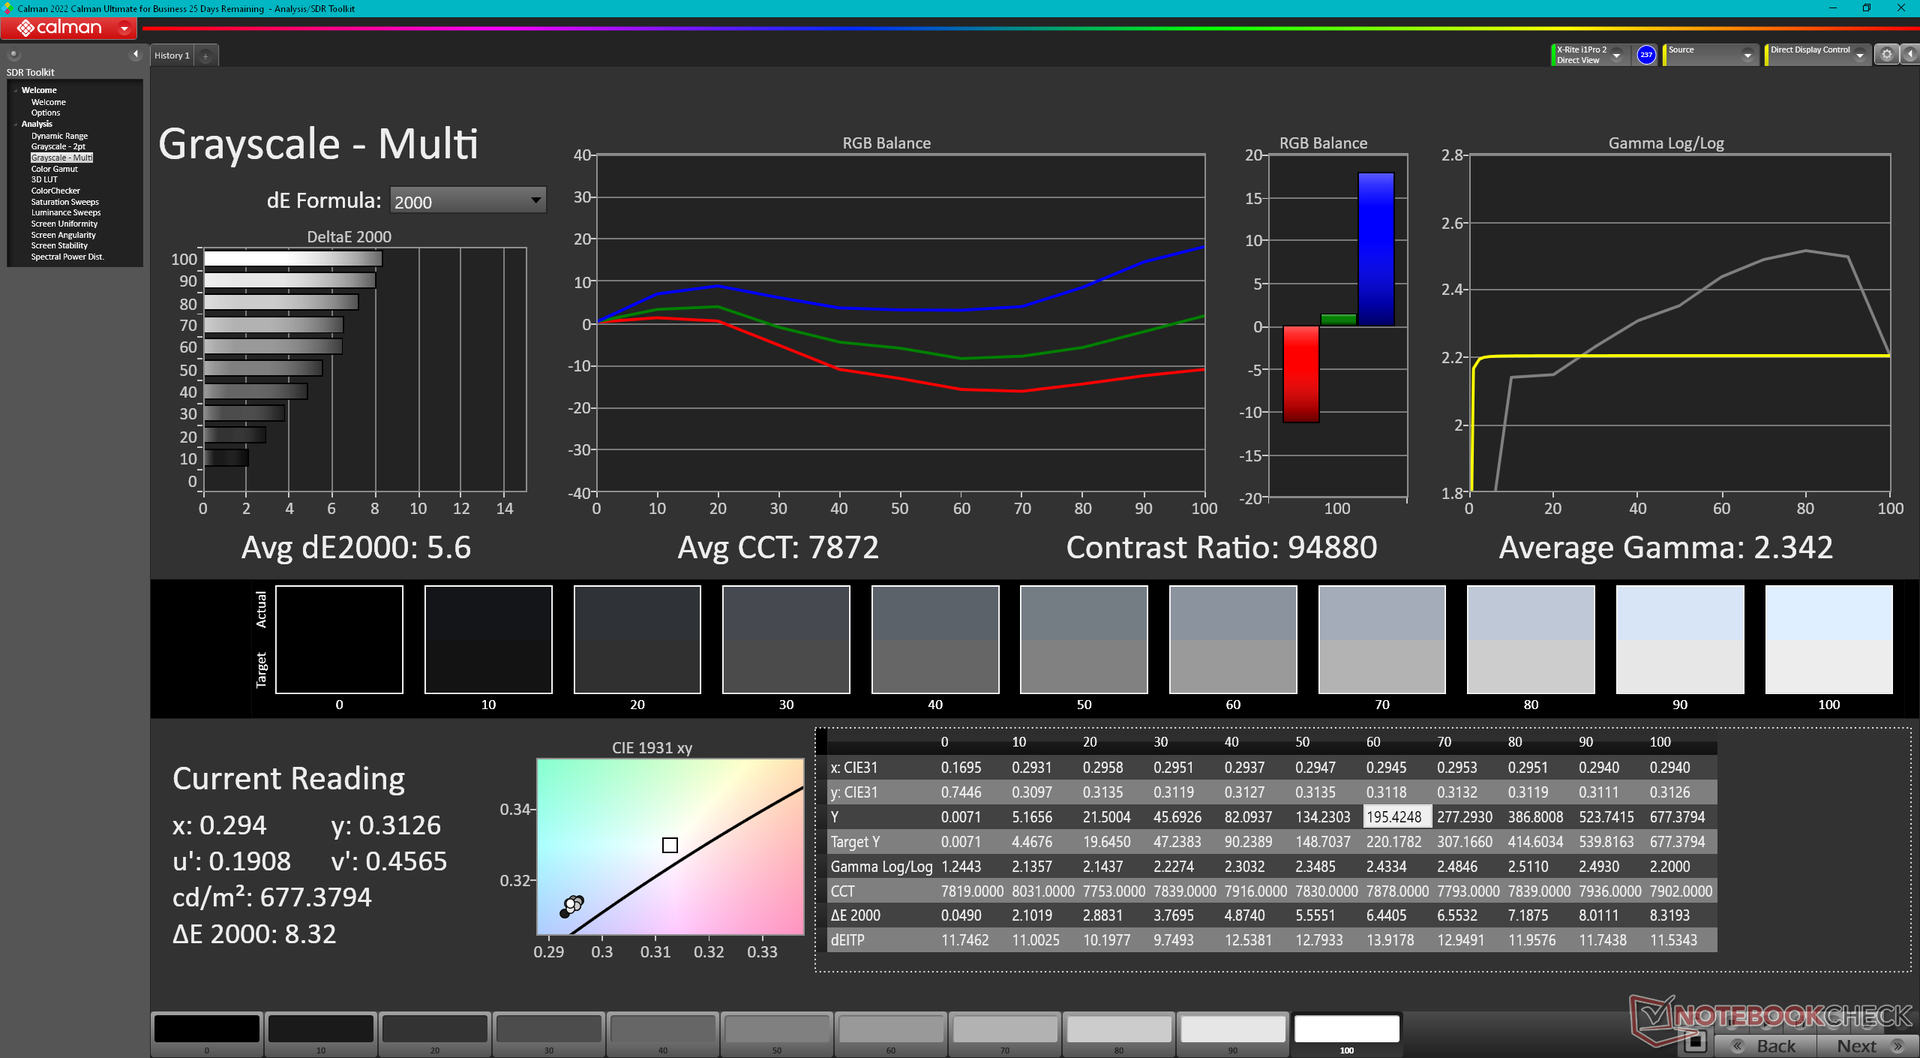
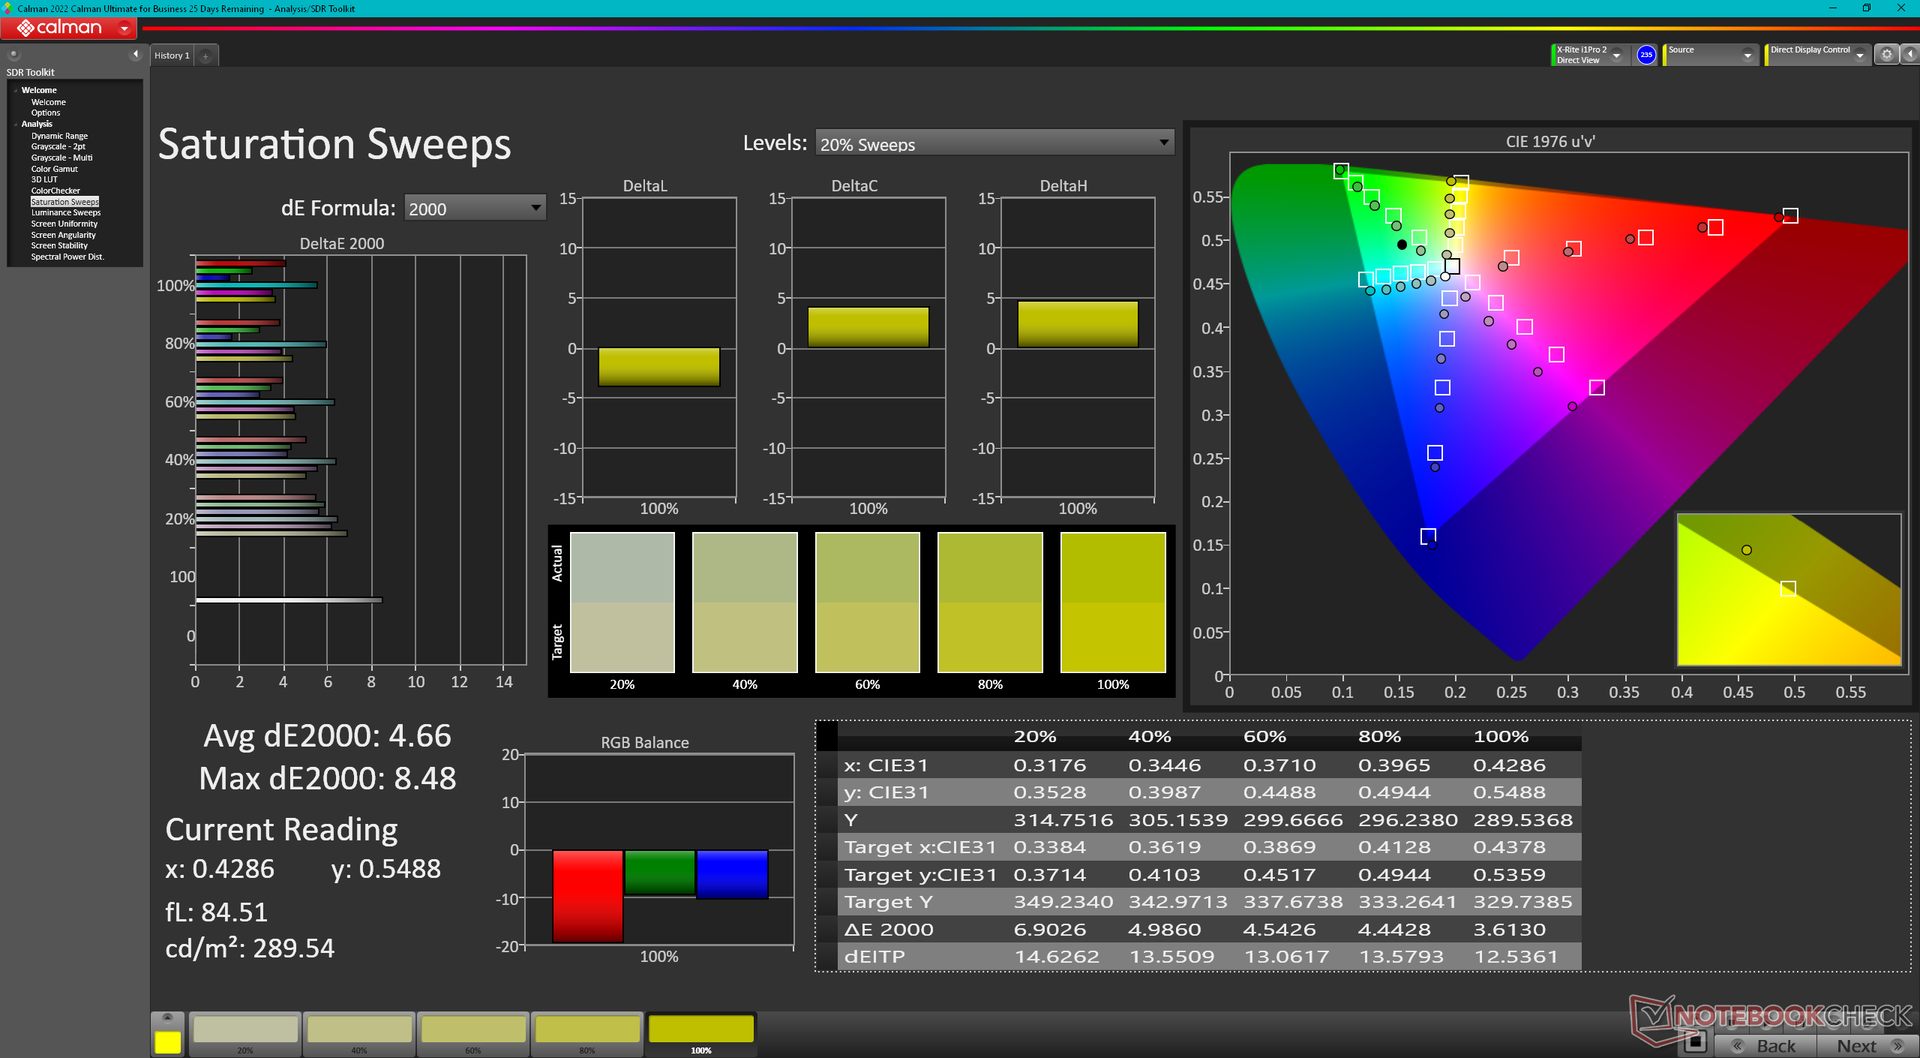
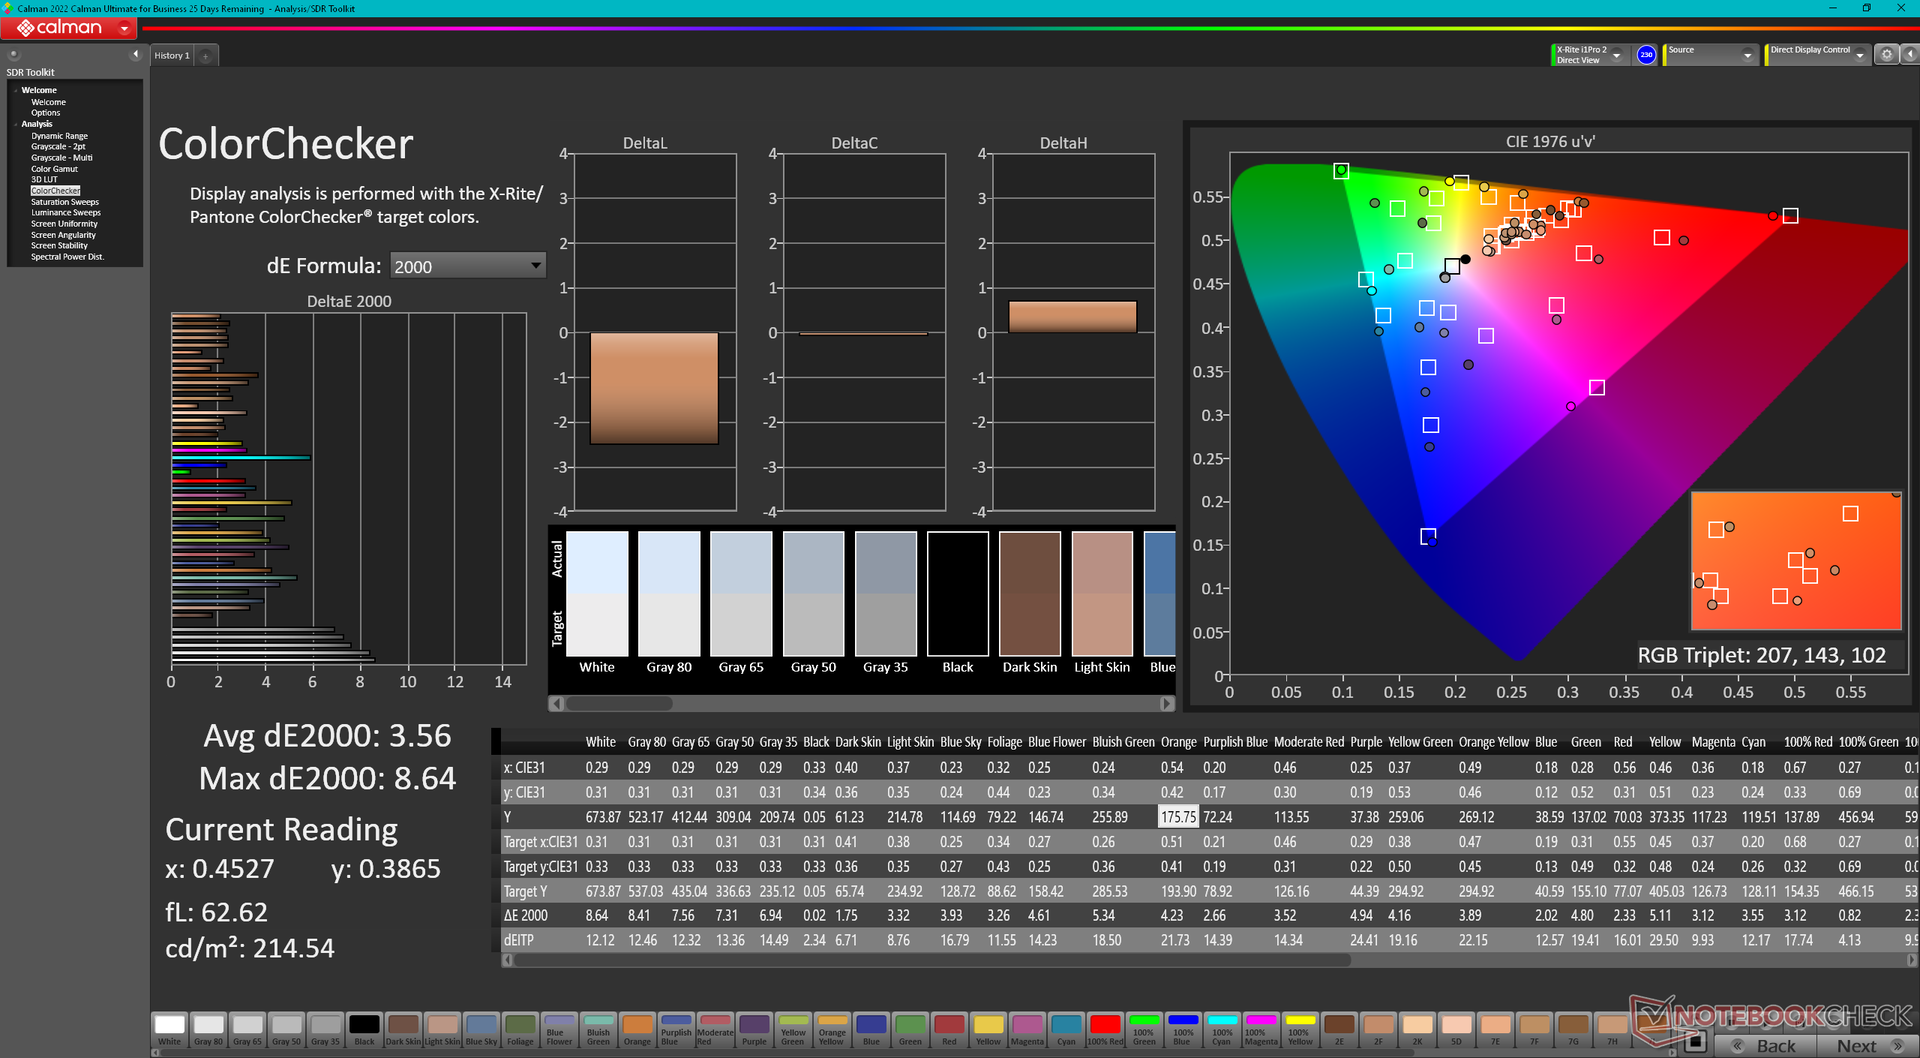
ΔE ColorChecker Calman: 3.56 | ∀{0.5-29.43 Ø4.74}
calibrated: 2.69
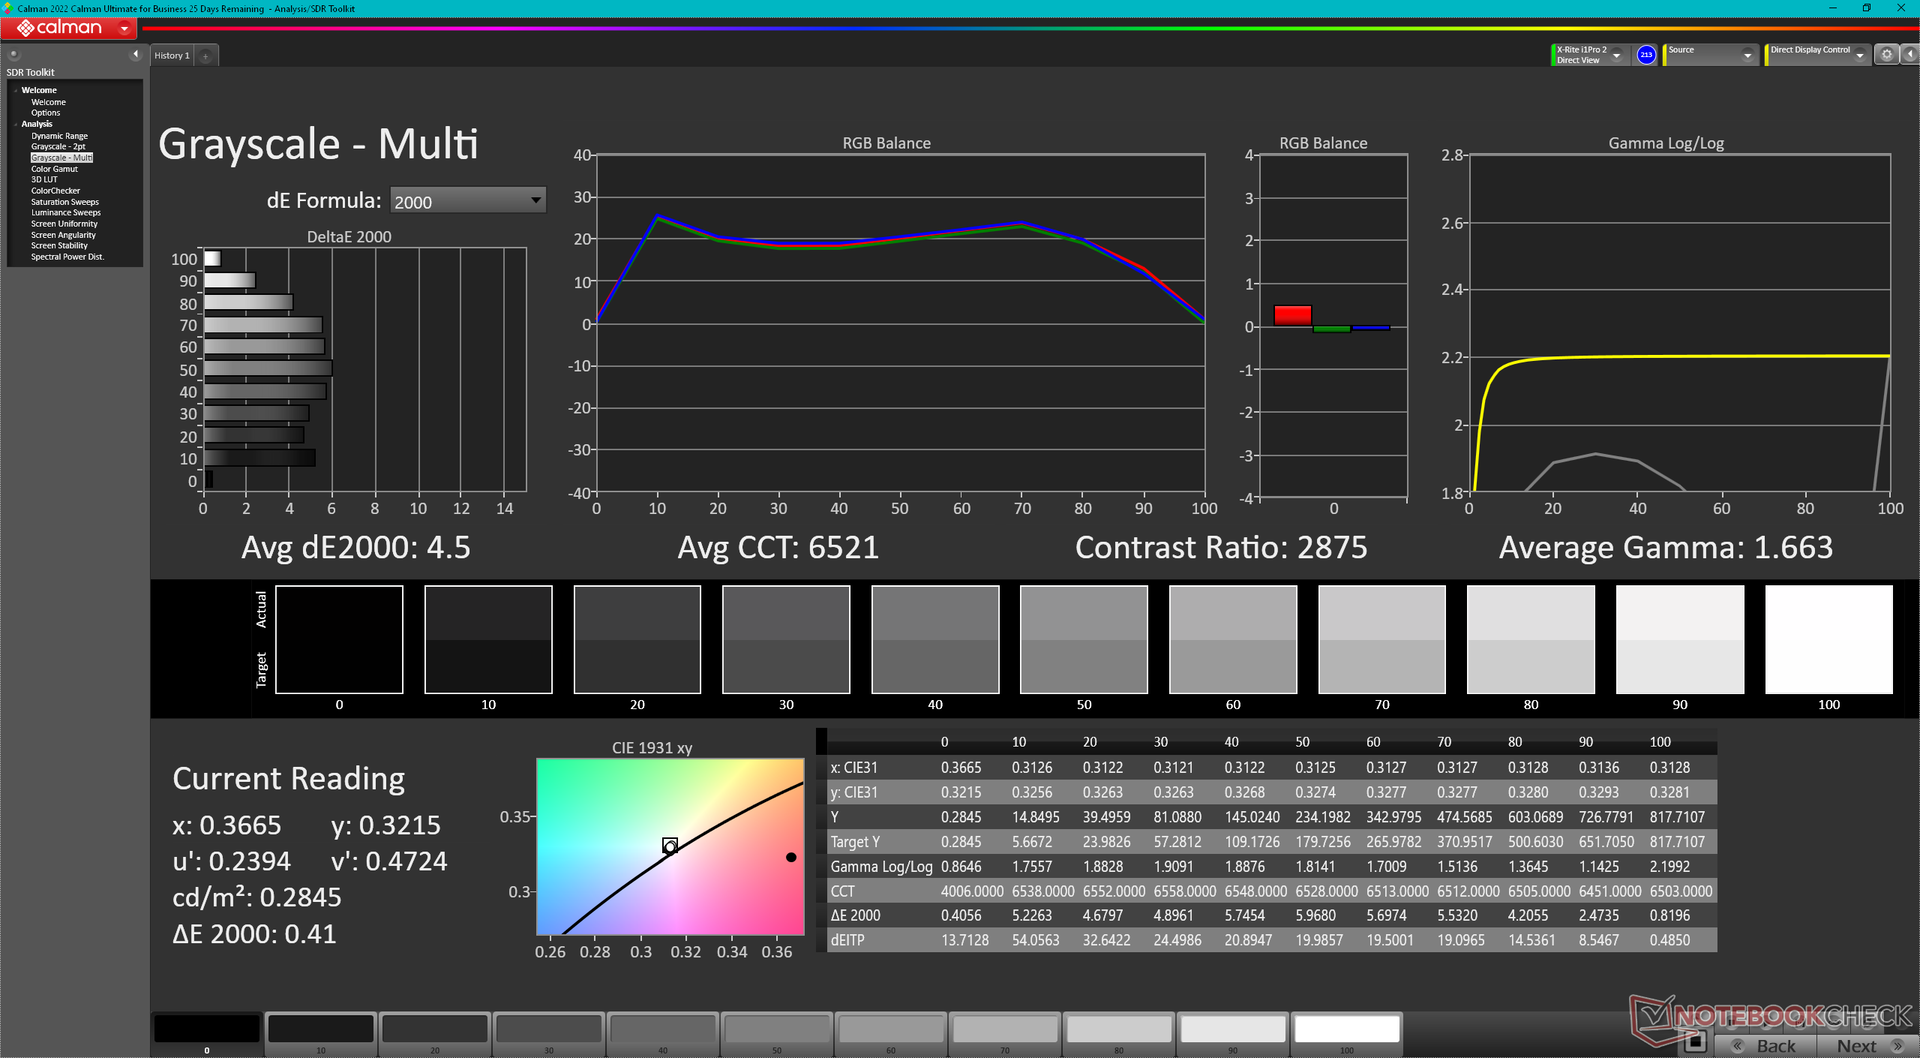
ΔE Greyscale Calman: 5.6 | ∀{0.09-98 Ø4.99}
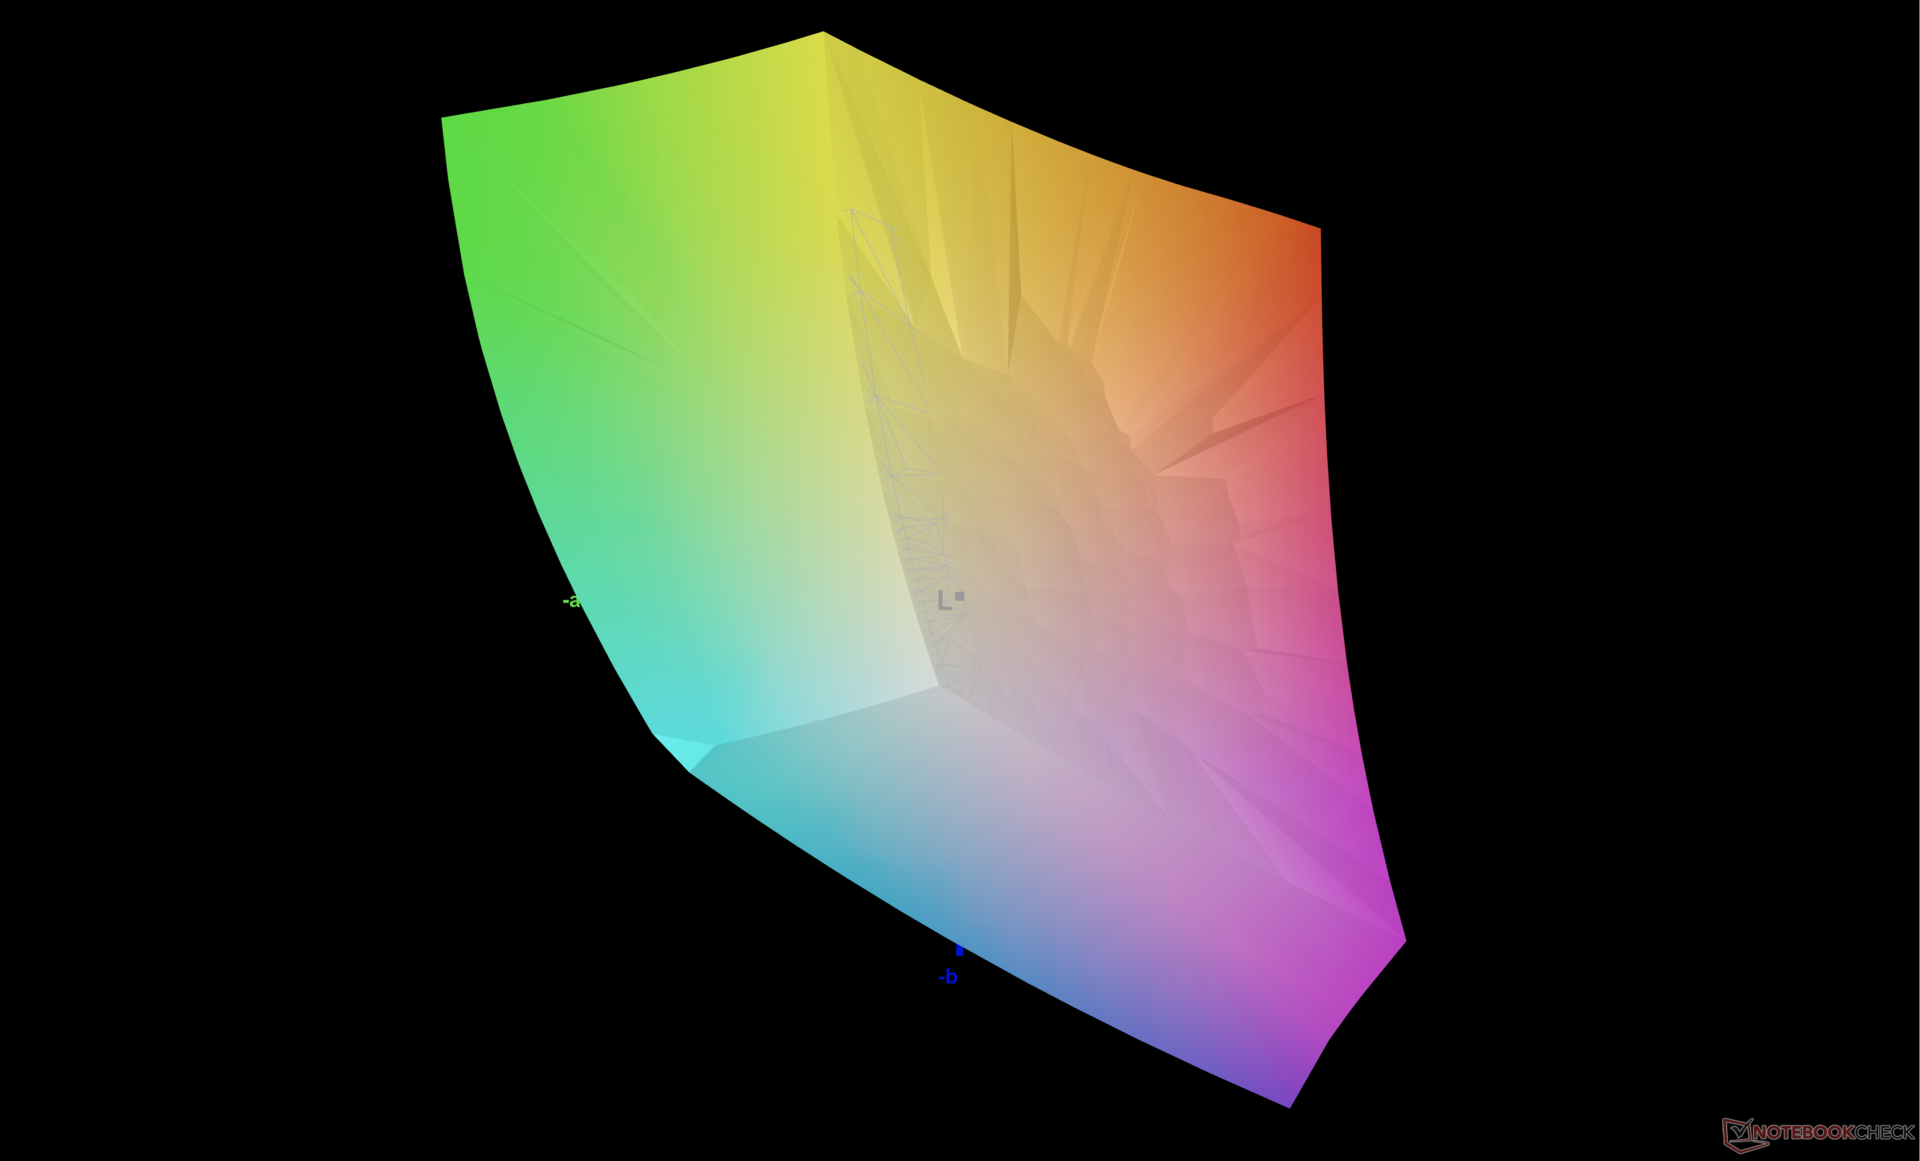
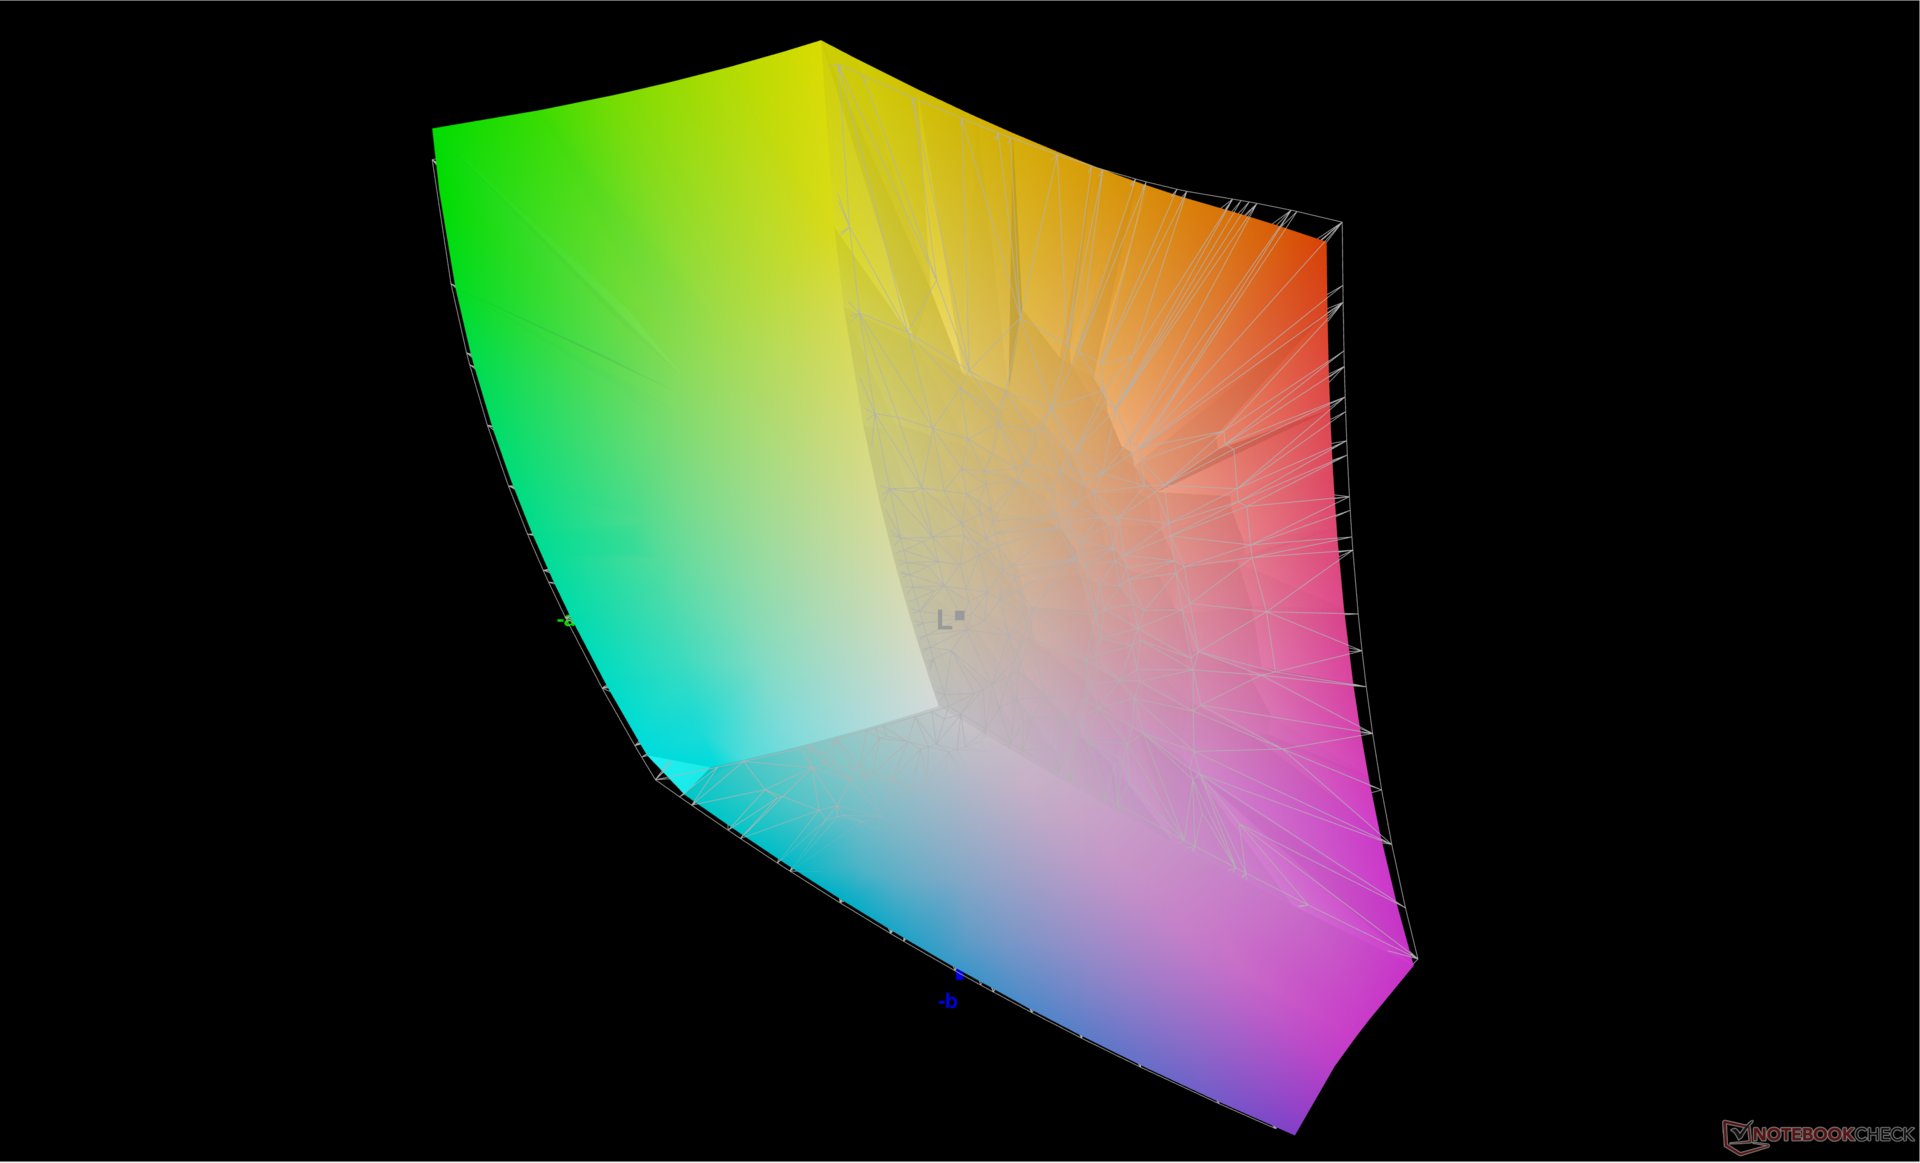
84.8% AdobeRGB 1998 (Argyll 3D)
99.9% sRGB (Argyll 3D)
96.6% Display P3 (Argyll 3D)
Gamma: 2.34
CCT: 7872 K
| MSI Raider 18 HX A14V AU Optronics B180ZAN1.0, Mini-LED, 3840x2400, 18", 120 Hz | Razer Blade 18 2024 RZ09-0509 BOE NE180QDM-NM1, Mini-LED, 2560x1600, 18", 300 Hz | Alienware m18 R2 BOE NE18NZ1, IPS, 2560x1600, 18", 165 Hz | MSI Titan 18 HX A14VIG AU Optronics B180ZAN01.0, Mini-LED, 3840x2400, 18", 120 Hz | Asus ROG Strix G18 G814JI NE180QDM-NZ2 (BOE0B35), IPS, 2560x1600, 18", 240 Hz | Acer Predator Helios 18 PH18-72-98MW B180QAN01.2 (AUO45A8), Mini-LED, 2560x1600, 18", 250 Hz | |
|---|---|---|---|---|---|---|
| Display | 1% | 2% | 1% | 1% | 4% | |
| Display P3 Coverage (%) | 96.6 | 99 2% | 97.8 1% | 98.1 2% | 98.1 2% | 99.7 3% |
| sRGB Coverage (%) | 99.9 | 100 0% | 99.5 0% | 99.8 0% | 99.9 0% | 100 0% |
| AdobeRGB 1998 Coverage (%) | 84.8 | 86.9 2% | 88.9 5% | 86.2 2% | 85.6 1% | 91.6 8% |
| Response Times | 55% | 68% | 5% | 67% | 50% | |
| Response Time Grey 50% / Grey 80% * (ms) | 10.4 ? | 7.6 ? 27% | 5.3 ? 49% | 8.6 ? 17% | 5.6 ? 46% | 8 ? 23% |
| Response Time Black / White * (ms) | 75.8 ? | 14 ? 82% | 10.4 ? 86% | 81.8 ? -8% | 9 ? 88% | 17.6 ? 77% |
| PWM Frequency (Hz) | 2606.2 ? | 26444 ? | 2592 ? | 4832 ? | ||
| PWM Amplitude * (%) | 90 | |||||
| Screen | 29% | 8% | 2% | 23% | 24% | |
| Brightness middle (cd/m²) | 575.7 | 605.4 5% | 271.8 -53% | 467.5 -19% | 471 -18% | 722 25% |
| Brightness (cd/m²) | 574 | 600 5% | 275 -52% | 459 -20% | 422 -26% | 724 26% |
| Brightness Distribution (%) | 94 | 97 3% | 78 -17% | 90 -4% | 83 -12% | 93 -1% |
| Black Level * (cd/m²) | 0.62 | 0.27 | 0.47 | 0.04 | ||
| Colorchecker dE 2000 * | 3.56 | 1.53 57% | 2.48 30% | 3.77 -6% | 2.05 42% | 3.4 4% |
| Colorchecker dE 2000 max. * | 8.64 | 4.15 52% | 5.59 35% | 6.12 29% | 4.15 52% | 5.32 38% |
| Colorchecker dE 2000 calibrated * | 2.69 | 0.56 79% | 2.94 -9% | 0.8 70% | 1.6 41% | |
| Greyscale dE 2000 * | 5.6 | 2.6 54% | 3.7 34% | 3.2 43% | 2.8 50% | 3.8 32% |
| Gamma | 2.34 94% | 2.22 99% | 2.2 100% | 2.43 91% | 2.204 100% | 2.383 92% |
| CCT | 7872 83% | 6843 95% | 6355 102% | 6478 100% | 7122 91% | 7051 92% |
| Contrast (:1) | 976 | 1007 | 1002 | 18050 | ||
| Teljes átlag (program / beállítások) | 28% /
26% | 26% /
16% | 3% /
2% | 30% /
25% | 26% /
23% |
* ... a kisebb jobb
A színhőmérséklet a Display P3 és a HDR kikapcsolt állapotában meglehetősen hűvös, 7872. A HDR bekapcsolása automatikusan letiltja az MSI TrueColor beállításokat, de a színhőmérséklet is automatikusan melegebb lesz 6521-nél a pontosabb színek érdekében. Az MSI nem hirdet gyári kalibrációt ehhez a Raider modellhez.
Megjelenítési válaszidők
| ↔ Válaszidő Fekete-fehér | ||
|---|---|---|
| 75.8 ms ... emelkedés és süllyedés ↘ kombinálva | ↗ 71 ms emelkedés | 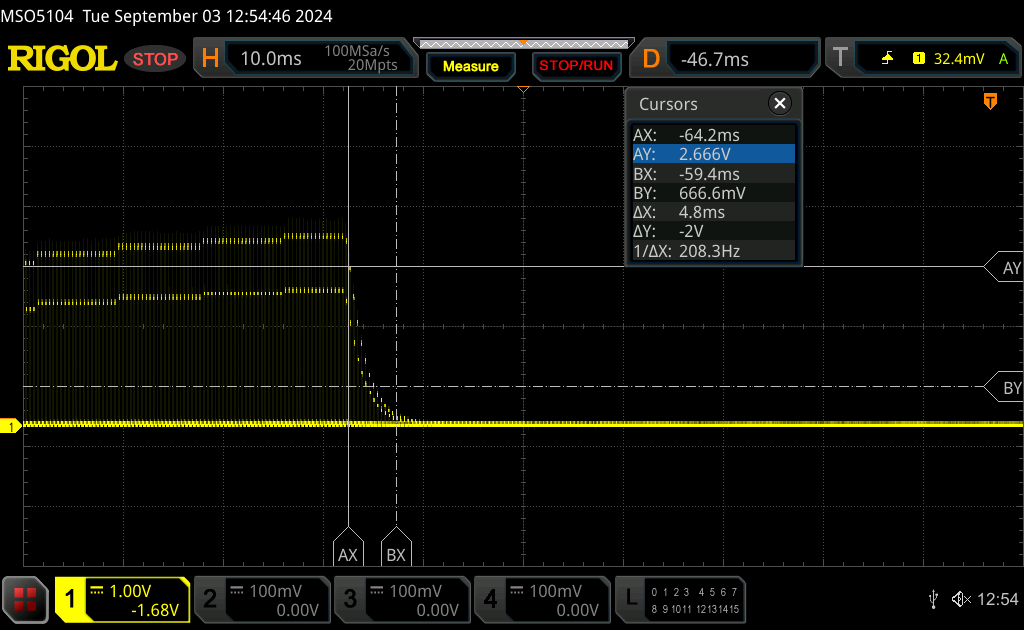 |
| ↘ 4.8 ms ősz | ||
| A képernyő lassú reakciósebességet mutat tesztjeinkben, és nem lesz kielégítő a játékosok számára. Összehasonlításképpen, az összes tesztelt eszköz 0.1 (minimum) és 240 (maximum) ms között mozog. » 100 % of all devices are better. Ez azt jelenti, hogy a mért válaszidő rosszabb, mint az összes vizsgált eszköz átlaga (20 ms). | ||
| ↔ Válaszidő 50% szürke és 80% szürke között | ||
| 10.4 ms ... emelkedés és süllyedés ↘ kombinálva | ↗ 4.8 ms emelkedés | 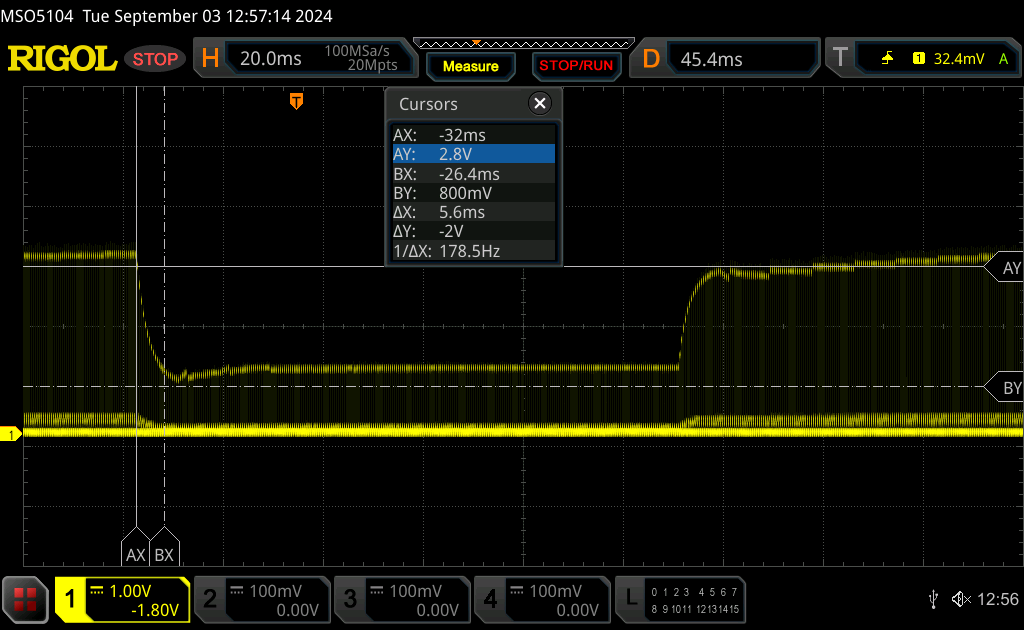 |
| ↘ 5.6 ms ősz | ||
| A képernyő jó reakciósebességet mutat tesztjeinkben, de túl lassú lehet a versenyképes játékosok számára. Összehasonlításképpen, az összes tesztelt eszköz 0.165 (minimum) és 636 (maximum) ms között mozog. » 24 % of all devices are better. Ez azt jelenti, hogy a mért válaszidő jobb, mint az összes vizsgált eszköz átlaga (31.3 ms). | ||
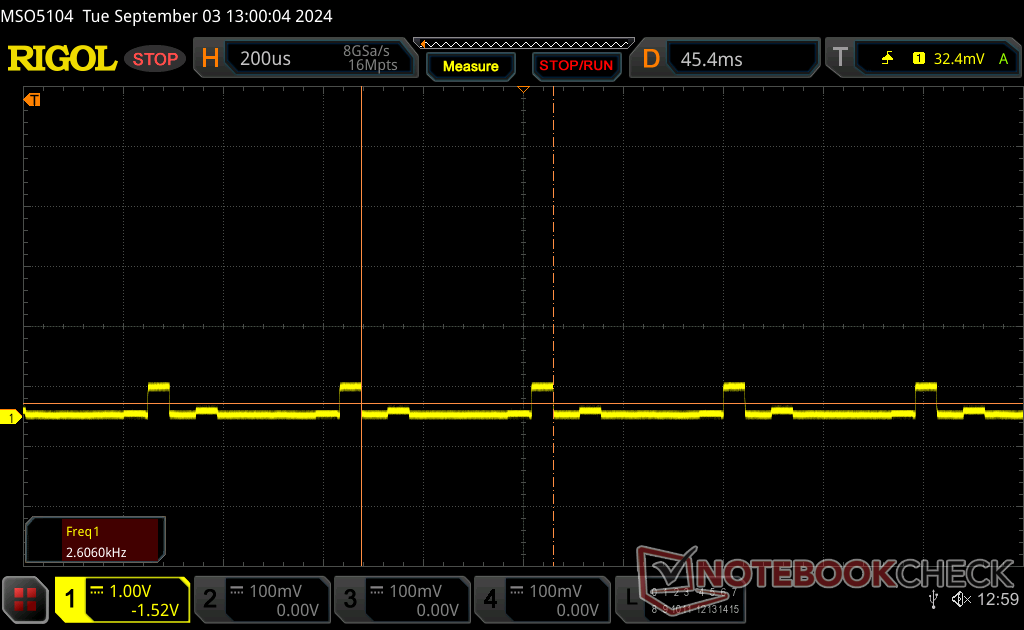
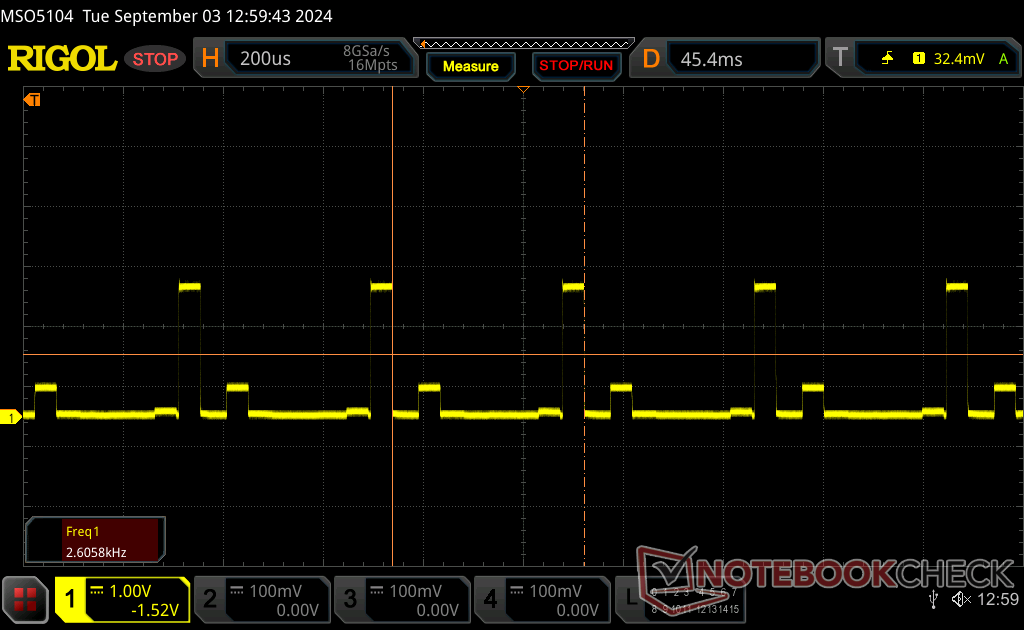
Képernyő villogása / PWM (impulzusszélesség-moduláció)
| Képernyő villogása / PWM észlelve | 2606.2 Hz Amplitude: 90 % | ≤ 100 % fényerő beállítása | 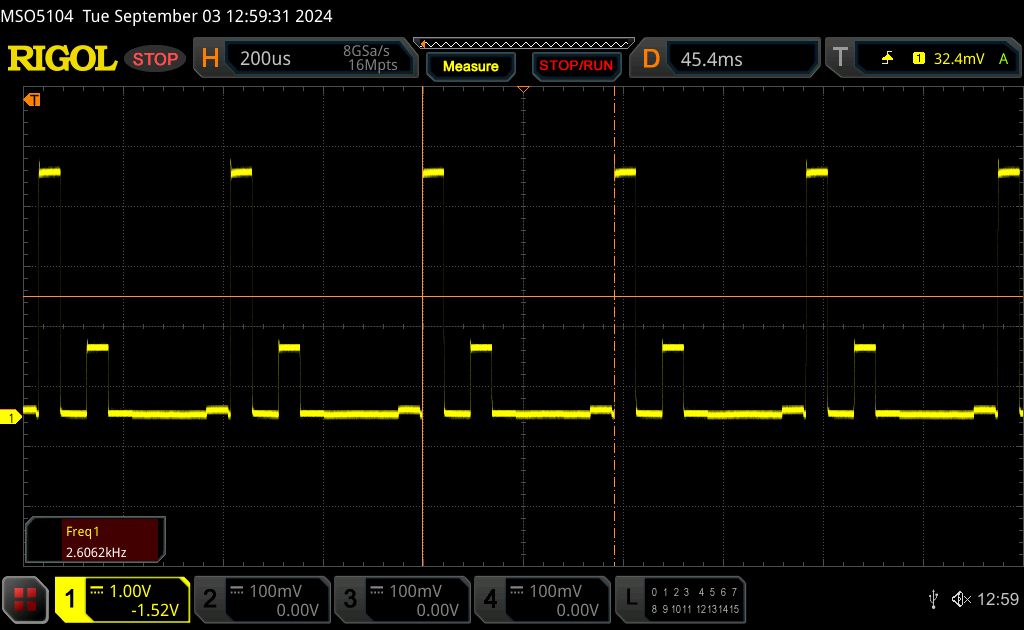 |
A kijelző háttérvilágítása 2606.2 Hz-en villog (a legrosszabb esetben, pl. PWM használatával) Villódzás észlelve a 100 % vagy annál kisebb fényerő-beállításnál. E fényerő-beállítás felett nem lehet villogás vagy PWM. A 2606.2 Hz frekvenciája meglehetősen magas, így a legtöbb PWM-re érzékeny felhasználó nem észlel semmilyen villogást. Összehasonlításképpen: az összes tesztelt eszköz 53 %-a nem használja a PWM-et a kijelző elsötétítésére. Ha PWM-et észleltek, akkor átlagosan 7920 (minimum: 5 - maximum: 343500) Hz-t mértek. | |||


A kültéri láthatóság csak árnyékban tisztességes, napfényben pedig nem túl jó. Az akkumulátorról való működés a maximális fényerőt mindössze 392 nits-re csökkenti, és a Windows HDR automatikusan letiltásra kerül.
Teljesítmény - Új CPU-név, ugyanaz a CPU-teljesítmény
Vizsgálati feltételek
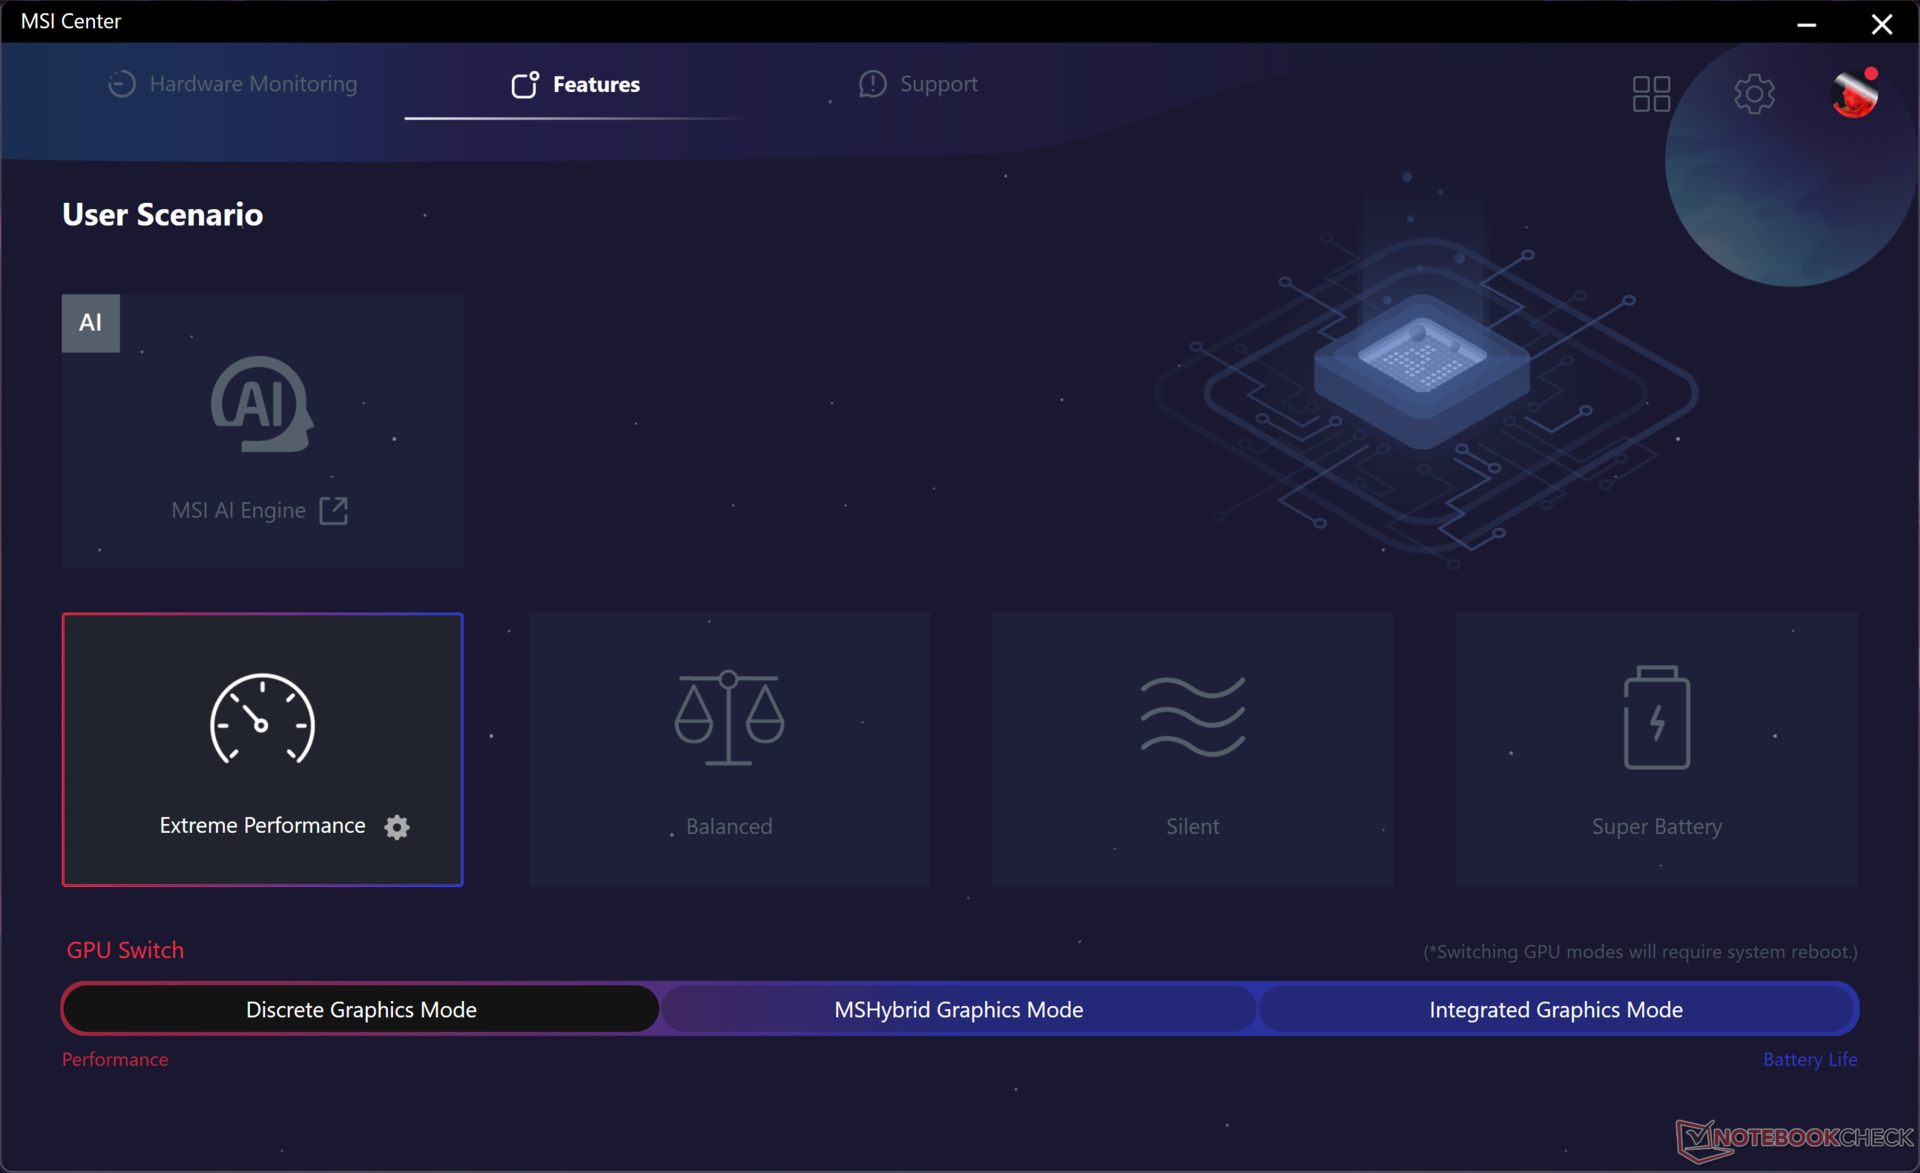
A GPU-t diszkrét grafikus módra, a Windows-t teljesítmény módra, az MSI Központot pedig extrém teljesítmény módra állítottuk az alábbi benchmarkok futtatása előtt. A Cooler Boost mód (azaz a maximális ventilátor üzemmód) egy másik beállítás az Extreme Performance módban, de ez az opció általában nem szükséges a maximális teljesítményhez, amint azt eredményeink is mutatják. Ez összhangban van más MSI laptopoknál szerzett tapasztalatainkkal, amelyek ugyanezt a Cooler Boost funkciót tartalmazzák.
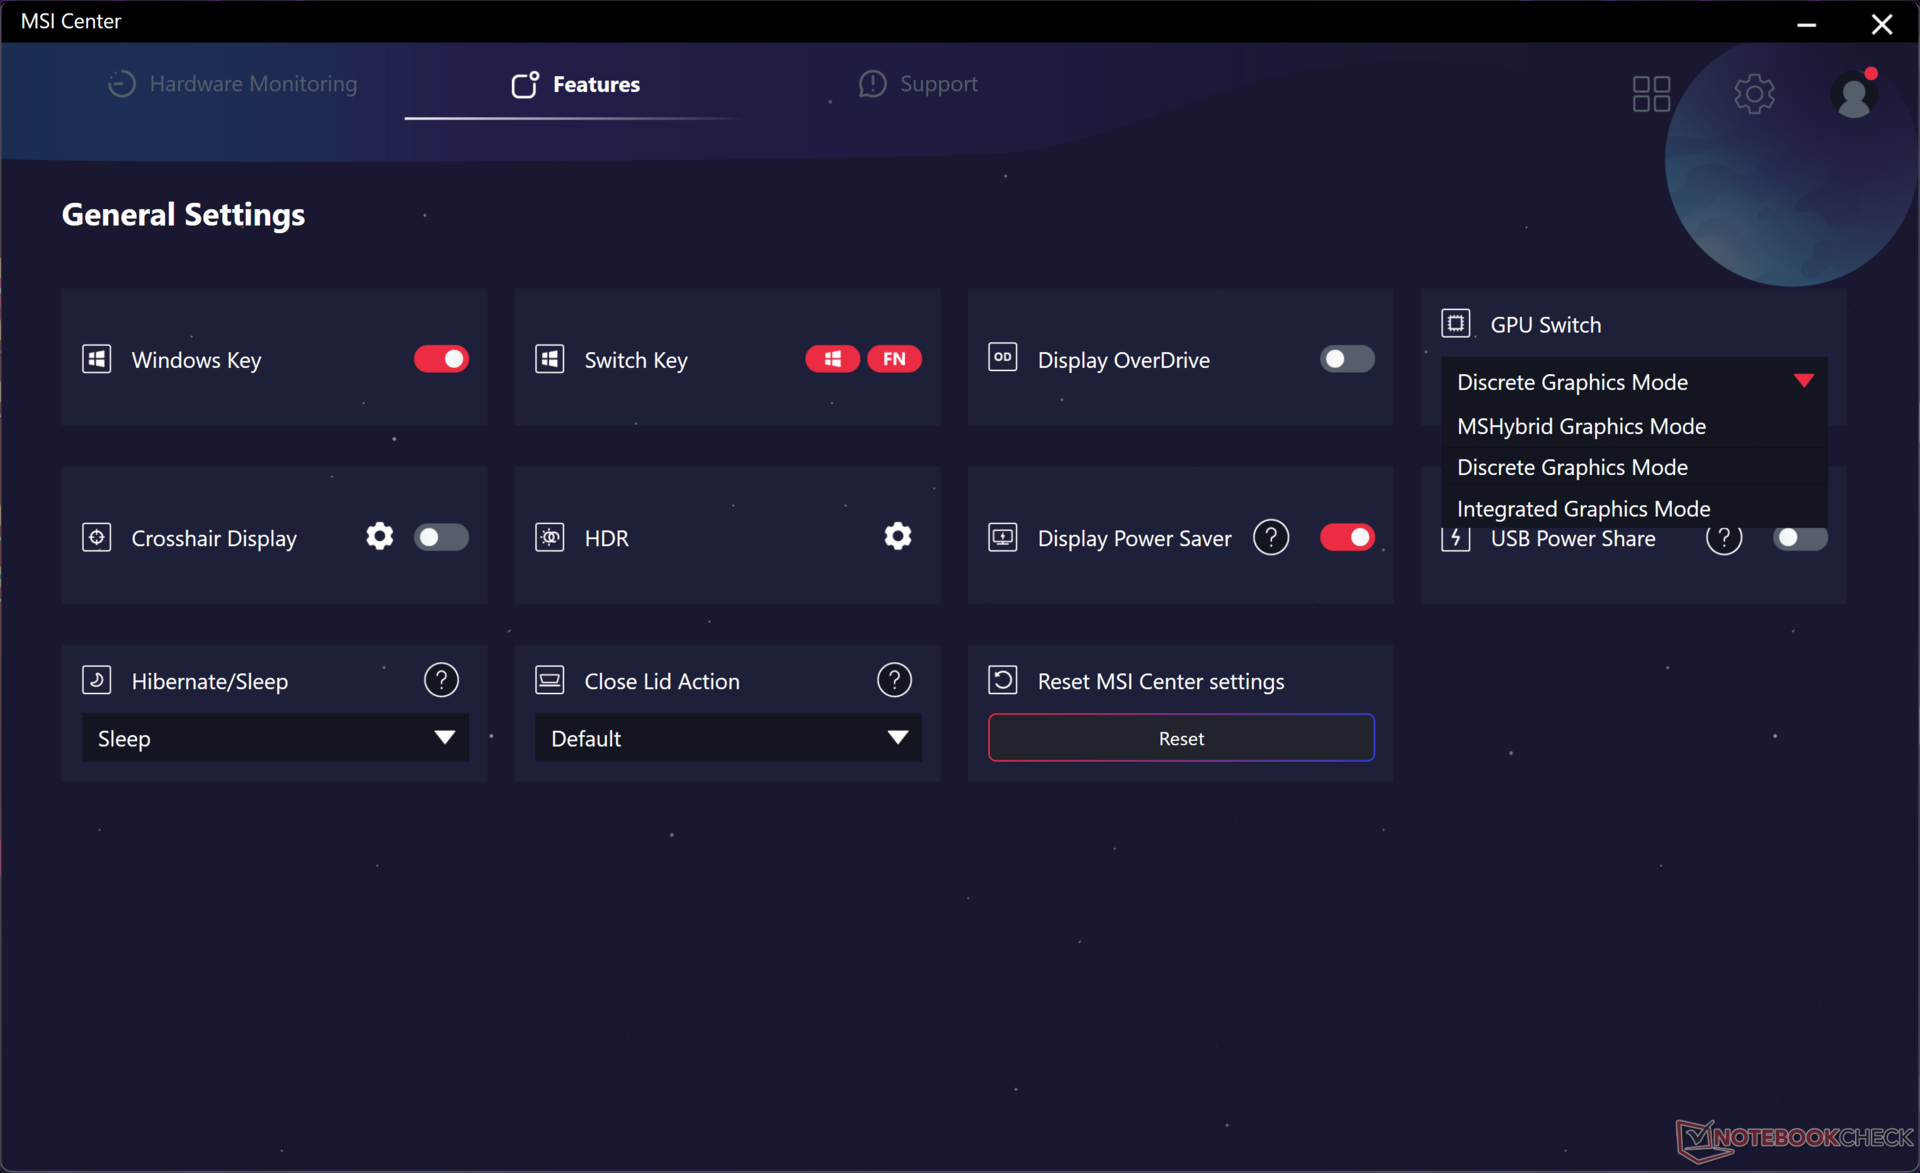
A MUX támogatott a dGPU, iGPU és MSHybrid üzemmódok közötti váltáshoz, de az Advanced Optimus nem, csakúgy, mint a Titan 18 HX esetében. A 4K mini-LED panel egyik legfontosabb hátránya ugyanis a G-Sync támogatás hiánya.
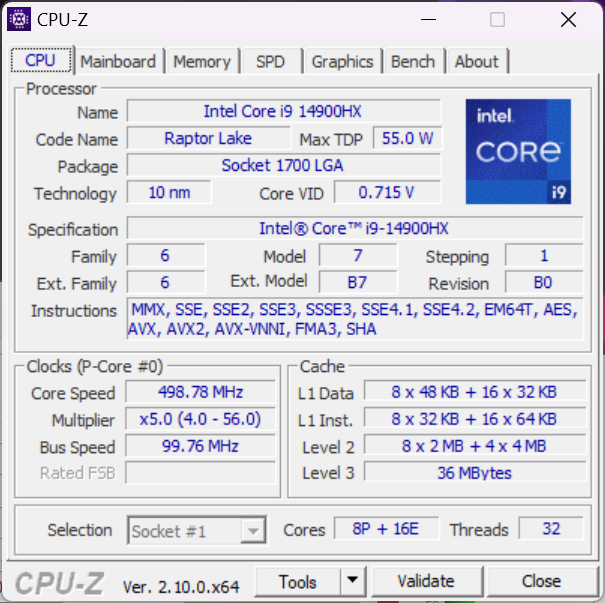
Processzor
A Core i9-14900HX csupán egy átnevezett Core i9-13900HX és így a legjobb esetben is csak marginális előnyökkel jár. Még így is a laptopok egyik leggyorsabb CPU-ja marad, ha olyan hagyományos teljesítménymérésekről van szó, mint a CineBench vagy a Blender renderelés. A CPU kiegészíti a Meteor Lake Core Ultra 9 185H amely némi nyers teljesítményt cserél a mesterséges intelligencia feladatokat gyorsító integrált NPU-ra.
A teljesítmény fenntarthatósága kiváló, nincs nagyobb órajelcsökkenés terheléskor, ellentétben azzal, amit a Acer Predator Helios 18 amely ugyanezzel a Core i9-14900HX CPU-val van felszerelve.
Az AMD-alapú Ryzen 9 7945HX konfiguráció várhatóan 10-15 százalékkal növeli a többszálas teljesítményt, miközben 10-15 százalékkal csökkenti az egyszálas teljesítményt.
Cinebench R15 Multi Loop
Cinebench R23: Multi Core | Single Core
Cinebench R20: CPU (Multi Core) | CPU (Single Core)
Cinebench R15: CPU Multi 64Bit | CPU Single 64Bit
Blender: v2.79 BMW27 CPU
7-Zip 18.03: 7z b 4 | 7z b 4 -mmt1
Geekbench 6.6: Multi-Core | Single-Core
Geekbench 5.5: Multi-Core | Single-Core
HWBOT x265 Benchmark v2.2: 4k Preset
LibreOffice : 20 Documents To PDF
R Benchmark 2.5: Overall mean
| CPU Performance rating | |
| Alienware m18 R1 AMD | |
| Alienware m18 R2 | |
| MSI Raider 18 HX A14V | |
| MSI Raider GE68HX 13VF | |
| Alienware m18 R1 -2! | |
| MSI Titan 18 HX A14VIG | |
| Acer Predator Helios 18 N23Q2 | |
| Átlagos Intel Core i9-14900HX | |
| Alienware m16 R1 AMD | |
| Asus ROG Zephyrus G16 GA605WV | |
| Lenovo Legion Pro 5 16ARX8 -2! | |
| Asus TUF Gaming A15 FA507UV | |
| Asus ROG Strix G18 G814JI -2! | |
| Lenovo Legion Slim 7 16APH8 | |
| Alienware x16 R2 P120F | |
| Lenovo Legion S7 16ARHA7 -2! | |
| Cinebench R23 / Multi Core | |
| Alienware m18 R1 AMD | |
| Alienware m18 R1 | |
| MSI Titan 18 HX A14VIG | |
| Alienware m18 R2 | |
| MSI Raider GE68HX 13VF | |
| Acer Predator Helios 18 N23Q2 | |
| MSI Raider 18 HX A14V | |
| Átlagos Intel Core i9-14900HX (17078 - 36249, n=37) | |
| Alienware m16 R1 AMD | |
| Asus ROG Zephyrus G16 GA605WV | |
| Asus ROG Strix G18 G814JI | |
| Alienware x16 R2 P120F | |
| Lenovo Legion Pro 5 16ARX8 | |
| Asus TUF Gaming A15 FA507UV | |
| Lenovo Legion Slim 7 16APH8 | |
| Lenovo Legion S7 16ARHA7 | |
| Cinebench R23 / Single Core | |
| Alienware m18 R2 | |
| MSI Raider 18 HX A14V | |
| Átlagos Intel Core i9-14900HX (1720 - 2245, n=37) | |
| MSI Titan 18 HX A14VIG | |
| Alienware m18 R1 | |
| MSI Raider GE68HX 13VF | |
| Acer Predator Helios 18 N23Q2 | |
| Asus ROG Zephyrus G16 GA605WV | |
| Alienware m18 R1 AMD | |
| Asus ROG Strix G18 G814JI | |
| Alienware m16 R1 AMD | |
| Lenovo Legion Pro 5 16ARX8 | |
| Asus TUF Gaming A15 FA507UV | |
| Lenovo Legion Slim 7 16APH8 | |
| Alienware x16 R2 P120F | |
| Lenovo Legion S7 16ARHA7 | |
| Cinebench R20 / CPU (Multi Core) | |
| Alienware m18 R1 AMD | |
| Alienware m18 R1 | |
| MSI Titan 18 HX A14VIG | |
| MSI Raider GE68HX 13VF | |
| Alienware m18 R2 | |
| Acer Predator Helios 18 N23Q2 | |
| MSI Raider 18 HX A14V | |
| Átlagos Intel Core i9-14900HX (6579 - 13832, n=37) | |
| Alienware m16 R1 AMD | |
| Asus ROG Zephyrus G16 GA605WV | |
| Asus ROG Strix G18 G814JI | |
| Alienware x16 R2 P120F | |
| Lenovo Legion Pro 5 16ARX8 | |
| Asus TUF Gaming A15 FA507UV | |
| Lenovo Legion Slim 7 16APH8 | |
| Lenovo Legion S7 16ARHA7 | |
| Cinebench R20 / CPU (Single Core) | |
| MSI Raider 18 HX A14V | |
| Alienware m18 R2 | |
| Átlagos Intel Core i9-14900HX (657 - 859, n=37) | |
| MSI Titan 18 HX A14VIG | |
| Alienware m18 R1 | |
| Acer Predator Helios 18 N23Q2 | |
| MSI Raider GE68HX 13VF | |
| Asus ROG Zephyrus G16 GA605WV | |
| Alienware m18 R1 AMD | |
| Asus ROG Strix G18 G814JI | |
| Alienware m16 R1 AMD | |
| Lenovo Legion Pro 5 16ARX8 | |
| Lenovo Legion Slim 7 16APH8 | |
| Asus TUF Gaming A15 FA507UV | |
| Lenovo Legion S7 16ARHA7 | |
| Alienware x16 R2 P120F | |
| Cinebench R15 / CPU Multi 64Bit | |
| Alienware m18 R1 AMD | |
| Alienware m18 R1 | |
| Alienware m18 R2 | |
| MSI Titan 18 HX A14VIG | |
| MSI Raider 18 HX A14V | |
| MSI Raider GE68HX 13VF | |
| Acer Predator Helios 18 N23Q2 | |
| Átlagos Intel Core i9-14900HX (3263 - 5589, n=38) | |
| Alienware m16 R1 AMD | |
| Asus ROG Zephyrus G16 GA605WV | |
| Asus ROG Strix G18 G814JI | |
| Lenovo Legion Pro 5 16ARX8 | |
| Alienware x16 R2 P120F | |
| Asus TUF Gaming A15 FA507UV | |
| Lenovo Legion Slim 7 16APH8 | |
| Lenovo Legion S7 16ARHA7 | |
| Cinebench R15 / CPU Single 64Bit | |
| Alienware m18 R2 | |
| MSI Raider 18 HX A14V | |
| Alienware m18 R1 AMD | |
| Átlagos Intel Core i9-14900HX (247 - 323, n=37) | |
| Alienware m18 R1 | |
| Asus ROG Zephyrus G16 GA605WV | |
| MSI Titan 18 HX A14VIG | |
| MSI Raider GE68HX 13VF | |
| Alienware m16 R1 AMD | |
| Acer Predator Helios 18 N23Q2 | |
| Lenovo Legion Pro 5 16ARX8 | |
| Asus TUF Gaming A15 FA507UV | |
| Asus ROG Strix G18 G814JI | |
| Lenovo Legion Slim 7 16APH8 | |
| Lenovo Legion S7 16ARHA7 | |
| Alienware x16 R2 P120F | |
| Blender / v2.79 BMW27 CPU | |
| Lenovo Legion S7 16ARHA7 | |
| Lenovo Legion Slim 7 16APH8 | |
| Asus TUF Gaming A15 FA507UV | |
| Alienware x16 R2 P120F | |
| Lenovo Legion Pro 5 16ARX8 | |
| Asus ROG Strix G18 G814JI | |
| Asus ROG Zephyrus G16 GA605WV | |
| Átlagos Intel Core i9-14900HX (91 - 206, n=37) | |
| Alienware m16 R1 AMD | |
| MSI Raider GE68HX 13VF | |
| Acer Predator Helios 18 N23Q2 | |
| MSI Raider 18 HX A14V | |
| MSI Titan 18 HX A14VIG | |
| Alienware m18 R2 | |
| Alienware m18 R1 | |
| Alienware m18 R1 AMD | |
| 7-Zip 18.03 / 7z b 4 | |
| Alienware m18 R1 AMD | |
| Alienware m18 R1 | |
| Alienware m18 R2 | |
| MSI Raider 18 HX A14V | |
| MSI Titan 18 HX A14VIG | |
| Acer Predator Helios 18 N23Q2 | |
| MSI Raider GE68HX 13VF | |
| Átlagos Intel Core i9-14900HX (66769 - 136645, n=37) | |
| Alienware m16 R1 AMD | |
| Asus ROG Zephyrus G16 GA605WV | |
| Asus ROG Strix G18 G814JI | |
| Lenovo Legion Pro 5 16ARX8 | |
| Asus TUF Gaming A15 FA507UV | |
| Lenovo Legion Slim 7 16APH8 | |
| Alienware x16 R2 P120F | |
| Lenovo Legion S7 16ARHA7 | |
| 7-Zip 18.03 / 7z b 4 -mmt1 | |
| Alienware m18 R1 AMD | |
| Lenovo Legion Pro 5 16ARX8 | |
| Alienware m18 R2 | |
| Átlagos Intel Core i9-14900HX (5452 - 7545, n=37) | |
| Alienware m16 R1 AMD | |
| Acer Predator Helios 18 N23Q2 | |
| Alienware m18 R1 | |
| MSI Raider GE68HX 13VF | |
| Asus TUF Gaming A15 FA507UV | |
| Lenovo Legion Slim 7 16APH8 | |
| MSI Raider 18 HX A14V | |
| MSI Titan 18 HX A14VIG | |
| Asus ROG Zephyrus G16 GA605WV | |
| Asus ROG Strix G18 G814JI | |
| Lenovo Legion S7 16ARHA7 | |
| Alienware x16 R2 P120F | |
| Geekbench 6.6 / Multi-Core | |
| Alienware m18 R2 | |
| Acer Predator Helios 18 N23Q2 | |
| MSI Raider GE68HX 13VF | |
| Átlagos Intel Core i9-14900HX (13158 - 19665, n=37) | |
| MSI Raider 18 HX A14V | |
| MSI Titan 18 HX A14VIG | |
| Alienware m18 R1 AMD | |
| Asus ROG Zephyrus G16 GA605WV | |
| Lenovo Legion Slim 7 16APH8 | |
| Alienware x16 R2 P120F | |
| Asus TUF Gaming A15 FA507UV | |
| Alienware m16 R1 AMD | |
| Geekbench 6.6 / Single-Core | |
| Alienware m18 R2 | |
| MSI Raider 18 HX A14V | |
| Átlagos Intel Core i9-14900HX (2419 - 3129, n=37) | |
| Acer Predator Helios 18 N23Q2 | |
| MSI Raider GE68HX 13VF | |
| Alienware m18 R1 AMD | |
| Asus ROG Zephyrus G16 GA605WV | |
| MSI Titan 18 HX A14VIG | |
| Alienware m16 R1 AMD | |
| Asus TUF Gaming A15 FA507UV | |
| Lenovo Legion Slim 7 16APH8 | |
| Alienware x16 R2 P120F | |
| Geekbench 5.5 / Multi-Core | |
| Alienware m18 R1 | |
| MSI Raider GE68HX 13VF | |
| Alienware m18 R2 | |
| Acer Predator Helios 18 N23Q2 | |
| MSI Raider 18 HX A14V | |
| Alienware m18 R1 AMD | |
| Átlagos Intel Core i9-14900HX (8618 - 23194, n=37) | |
| MSI Titan 18 HX A14VIG | |
| Alienware m16 R1 AMD | |
| Asus ROG Zephyrus G16 GA605WV | |
| Asus ROG Strix G18 G814JI | |
| Alienware x16 R2 P120F | |
| Lenovo Legion Pro 5 16ARX8 | |
| Asus TUF Gaming A15 FA507UV | |
| Lenovo Legion Slim 7 16APH8 | |
| Lenovo Legion S7 16ARHA7 | |
| Geekbench 5.5 / Single-Core | |
| Alienware m18 R2 | |
| MSI Raider 18 HX A14V | |
| Alienware m18 R1 AMD | |
| Asus ROG Zephyrus G16 GA605WV | |
| MSI Titan 18 HX A14VIG | |
| Átlagos Intel Core i9-14900HX (1669 - 2210, n=37) | |
| Alienware m18 R1 | |
| MSI Raider GE68HX 13VF | |
| Acer Predator Helios 18 N23Q2 | |
| Lenovo Legion Pro 5 16ARX8 | |
| Alienware m16 R1 AMD | |
| Asus TUF Gaming A15 FA507UV | |
| Lenovo Legion Slim 7 16APH8 | |
| Asus ROG Strix G18 G814JI | |
| Alienware x16 R2 P120F | |
| Lenovo Legion S7 16ARHA7 | |
| HWBOT x265 Benchmark v2.2 / 4k Preset | |
| Alienware m18 R1 AMD | |
| Alienware m18 R1 | |
| MSI Raider 18 HX A14V | |
| Alienware m18 R2 | |
| MSI Raider GE68HX 13VF | |
| MSI Titan 18 HX A14VIG | |
| Acer Predator Helios 18 N23Q2 | |
| Alienware m16 R1 AMD | |
| Átlagos Intel Core i9-14900HX (16.8 - 38.9, n=37) | |
| Asus ROG Zephyrus G16 GA605WV | |
| Asus ROG Strix G18 G814JI | |
| Lenovo Legion Pro 5 16ARX8 | |
| Asus TUF Gaming A15 FA507UV | |
| Alienware x16 R2 P120F | |
| Lenovo Legion Slim 7 16APH8 | |
| Lenovo Legion S7 16ARHA7 | |
| LibreOffice / 20 Documents To PDF | |
| Lenovo Legion Slim 7 16APH8 | |
| Asus ROG Strix G18 G814JI | |
| Asus ROG Zephyrus G16 GA605WV | |
| Acer Predator Helios 18 N23Q2 | |
| Lenovo Legion S7 16ARHA7 | |
| Asus TUF Gaming A15 FA507UV | |
| Alienware m18 R1 | |
| MSI Titan 18 HX A14VIG | |
| Alienware x16 R2 P120F | |
| Alienware m18 R2 | |
| Átlagos Intel Core i9-14900HX (19 - 85.1, n=37) | |
| Alienware m18 R1 AMD | |
| Alienware m16 R1 AMD | |
| Lenovo Legion Pro 5 16ARX8 | |
| MSI Raider 18 HX A14V | |
| MSI Raider GE68HX 13VF | |
| R Benchmark 2.5 / Overall mean | |
| Alienware x16 R2 P120F | |
| Lenovo Legion S7 16ARHA7 | |
| Lenovo Legion Slim 7 16APH8 | |
| Asus ROG Strix G18 G814JI | |
| Asus TUF Gaming A15 FA507UV | |
| Alienware m16 R1 AMD | |
| Lenovo Legion Pro 5 16ARX8 | |
| Alienware m18 R1 AMD | |
| Asus ROG Zephyrus G16 GA605WV | |
| Acer Predator Helios 18 N23Q2 | |
| Alienware m18 R1 | |
| MSI Titan 18 HX A14VIG | |
| MSI Raider GE68HX 13VF | |
| Átlagos Intel Core i9-14900HX (0.3604 - 0.4859, n=37) | |
| MSI Raider 18 HX A14V | |
| Alienware m18 R2 | |
Cinebench R23: Multi Core | Single Core
Cinebench R20: CPU (Multi Core) | CPU (Single Core)
Cinebench R15: CPU Multi 64Bit | CPU Single 64Bit
Blender: v2.79 BMW27 CPU
7-Zip 18.03: 7z b 4 | 7z b 4 -mmt1
Geekbench 6.6: Multi-Core | Single-Core
Geekbench 5.5: Multi-Core | Single-Core
HWBOT x265 Benchmark v2.2: 4k Preset
LibreOffice : 20 Documents To PDF
R Benchmark 2.5: Overall mean
* ... a kisebb jobb
AIDA64: FP32 Ray-Trace | FPU Julia | CPU SHA3 | CPU Queen | FPU SinJulia | FPU Mandel | CPU AES | CPU ZLib | FP64 Ray-Trace | CPU PhotoWorxx
| Performance rating | |
| Alienware m18 R2 | |
| MSI Titan 18 HX A14VIG | |
| MSI Raider 18 HX A14V | |
| Átlagos Intel Core i9-14900HX | |
| Razer Blade 18 2024 RZ09-0509 | |
| Acer Predator Helios 18 PH18-72-98MW | |
| Asus ROG Strix G18 G814JI | |
| AIDA64 / FP32 Ray-Trace | |
| MSI Titan 18 HX A14VIG | |
| Alienware m18 R2 | |
| MSI Raider 18 HX A14V | |
| Razer Blade 18 2024 RZ09-0509 | |
| Átlagos Intel Core i9-14900HX (13098 - 33474, n=36) | |
| Acer Predator Helios 18 PH18-72-98MW | |
| Asus ROG Strix G18 G814JI | |
| AIDA64 / FPU Julia | |
| MSI Titan 18 HX A14VIG | |
| Alienware m18 R2 | |
| MSI Raider 18 HX A14V | |
| Razer Blade 18 2024 RZ09-0509 | |
| Átlagos Intel Core i9-14900HX (67573 - 166040, n=36) | |
| Acer Predator Helios 18 PH18-72-98MW | |
| Asus ROG Strix G18 G814JI | |
| AIDA64 / CPU SHA3 | |
| MSI Titan 18 HX A14VIG | |
| Alienware m18 R2 | |
| MSI Raider 18 HX A14V | |
| Razer Blade 18 2024 RZ09-0509 | |
| Átlagos Intel Core i9-14900HX (3589 - 7979, n=36) | |
| Acer Predator Helios 18 PH18-72-98MW | |
| Asus ROG Strix G18 G814JI | |
| AIDA64 / CPU Queen | |
| MSI Titan 18 HX A14VIG | |
| MSI Raider 18 HX A14V | |
| Alienware m18 R2 | |
| Acer Predator Helios 18 PH18-72-98MW | |
| Átlagos Intel Core i9-14900HX (118405 - 148966, n=36) | |
| Razer Blade 18 2024 RZ09-0509 | |
| Asus ROG Strix G18 G814JI | |
| AIDA64 / FPU SinJulia | |
| MSI Titan 18 HX A14VIG | |
| MSI Raider 18 HX A14V | |
| Alienware m18 R2 | |
| Razer Blade 18 2024 RZ09-0509 | |
| Átlagos Intel Core i9-14900HX (10475 - 18517, n=36) | |
| Acer Predator Helios 18 PH18-72-98MW | |
| Asus ROG Strix G18 G814JI | |
| AIDA64 / FPU Mandel | |
| Alienware m18 R2 | |
| MSI Titan 18 HX A14VIG | |
| MSI Raider 18 HX A14V | |
| Razer Blade 18 2024 RZ09-0509 | |
| Átlagos Intel Core i9-14900HX (32543 - 83662, n=36) | |
| Acer Predator Helios 18 PH18-72-98MW | |
| Asus ROG Strix G18 G814JI | |
| AIDA64 / CPU AES | |
| Átlagos Intel Core i9-14900HX (86964 - 241777, n=36) | |
| MSI Titan 18 HX A14VIG | |
| Alienware m18 R2 | |
| MSI Raider 18 HX A14V | |
| Razer Blade 18 2024 RZ09-0509 | |
| Acer Predator Helios 18 PH18-72-98MW | |
| Asus ROG Strix G18 G814JI | |
| AIDA64 / CPU ZLib | |
| MSI Titan 18 HX A14VIG | |
| Alienware m18 R2 | |
| MSI Raider 18 HX A14V | |
| Razer Blade 18 2024 RZ09-0509 | |
| Átlagos Intel Core i9-14900HX (1054 - 2292, n=36) | |
| Acer Predator Helios 18 PH18-72-98MW | |
| Asus ROG Strix G18 G814JI | |
| AIDA64 / FP64 Ray-Trace | |
| Alienware m18 R2 | |
| MSI Titan 18 HX A14VIG | |
| MSI Raider 18 HX A14V | |
| Razer Blade 18 2024 RZ09-0509 | |
| Átlagos Intel Core i9-14900HX (6809 - 18349, n=36) | |
| Acer Predator Helios 18 PH18-72-98MW | |
| Asus ROG Strix G18 G814JI | |
| AIDA64 / CPU PhotoWorxx | |
| Alienware m18 R2 | |
| Razer Blade 18 2024 RZ09-0509 | |
| Acer Predator Helios 18 PH18-72-98MW | |
| Átlagos Intel Core i9-14900HX (23903 - 54702, n=36) | |
| Asus ROG Strix G18 G814JI | |
| MSI Raider 18 HX A14V | |
| MSI Titan 18 HX A14VIG | |
Stressz teszt
A CPU 4 GHz-re, 86 C-ra és 145 W-ra gyorsult a Prime95 stressz indításakor, és az órajelek vagy a teljesítmény idővel nem esett jelentősen vissza. A nagyméretű ház és a hűtési megoldás nagyobb teljesítményt tud kihozni a Core i9-14900HX-ből, mint az azonos processzorral rendelkező kisebb rendszerek, mint például a RedMagic Titan 16 Pro amelyek meglehetősen erősen throttlingolnak.
Az Extreme Performance módban való futtatás bekapcsolt Cooler Boosttal nem nyújt kézzelfogható teljesítményelőnyt a kikapcsolt Cooler Boosttal szemben játék közben. A GPU órajelek, a memória órajelek és a lap teljesítményfelvétele a Cyberpunk 2077 futtatása során a két beállítás között 2550 MHz-en, 2250 MHz-en, illetve 159 W-on stabilizálódott. A maghőmérséklet néhány C-fokkal kissé hűvösebb a Cooler Boost bekapcsolt állapotában, mivel a ventilátor zaja hangosabb, de ez az egyetlen említésre méltó előny.
A Kiegyensúlyozott módra való visszalépés a GPU órajelét és a lap teljesítményfelvételét 2295 MHz-re, illetve 150 W-ra csökkenti, ami csak kis mértékben lassabb, mint az Extreme Performance módban. A Balanced és Extreme Performance módok közötti teljesítménykülönbségek tehát kisebbek, mint amire számíthatnánk.
A GPU hőmérséklete melegebb, mint a Razer Blade 18-hoz képest játék közben akár 9 C-kal is melegebb, annak ellenére, hogy az MSI-nk vastagabb és nehezebb rendszer.
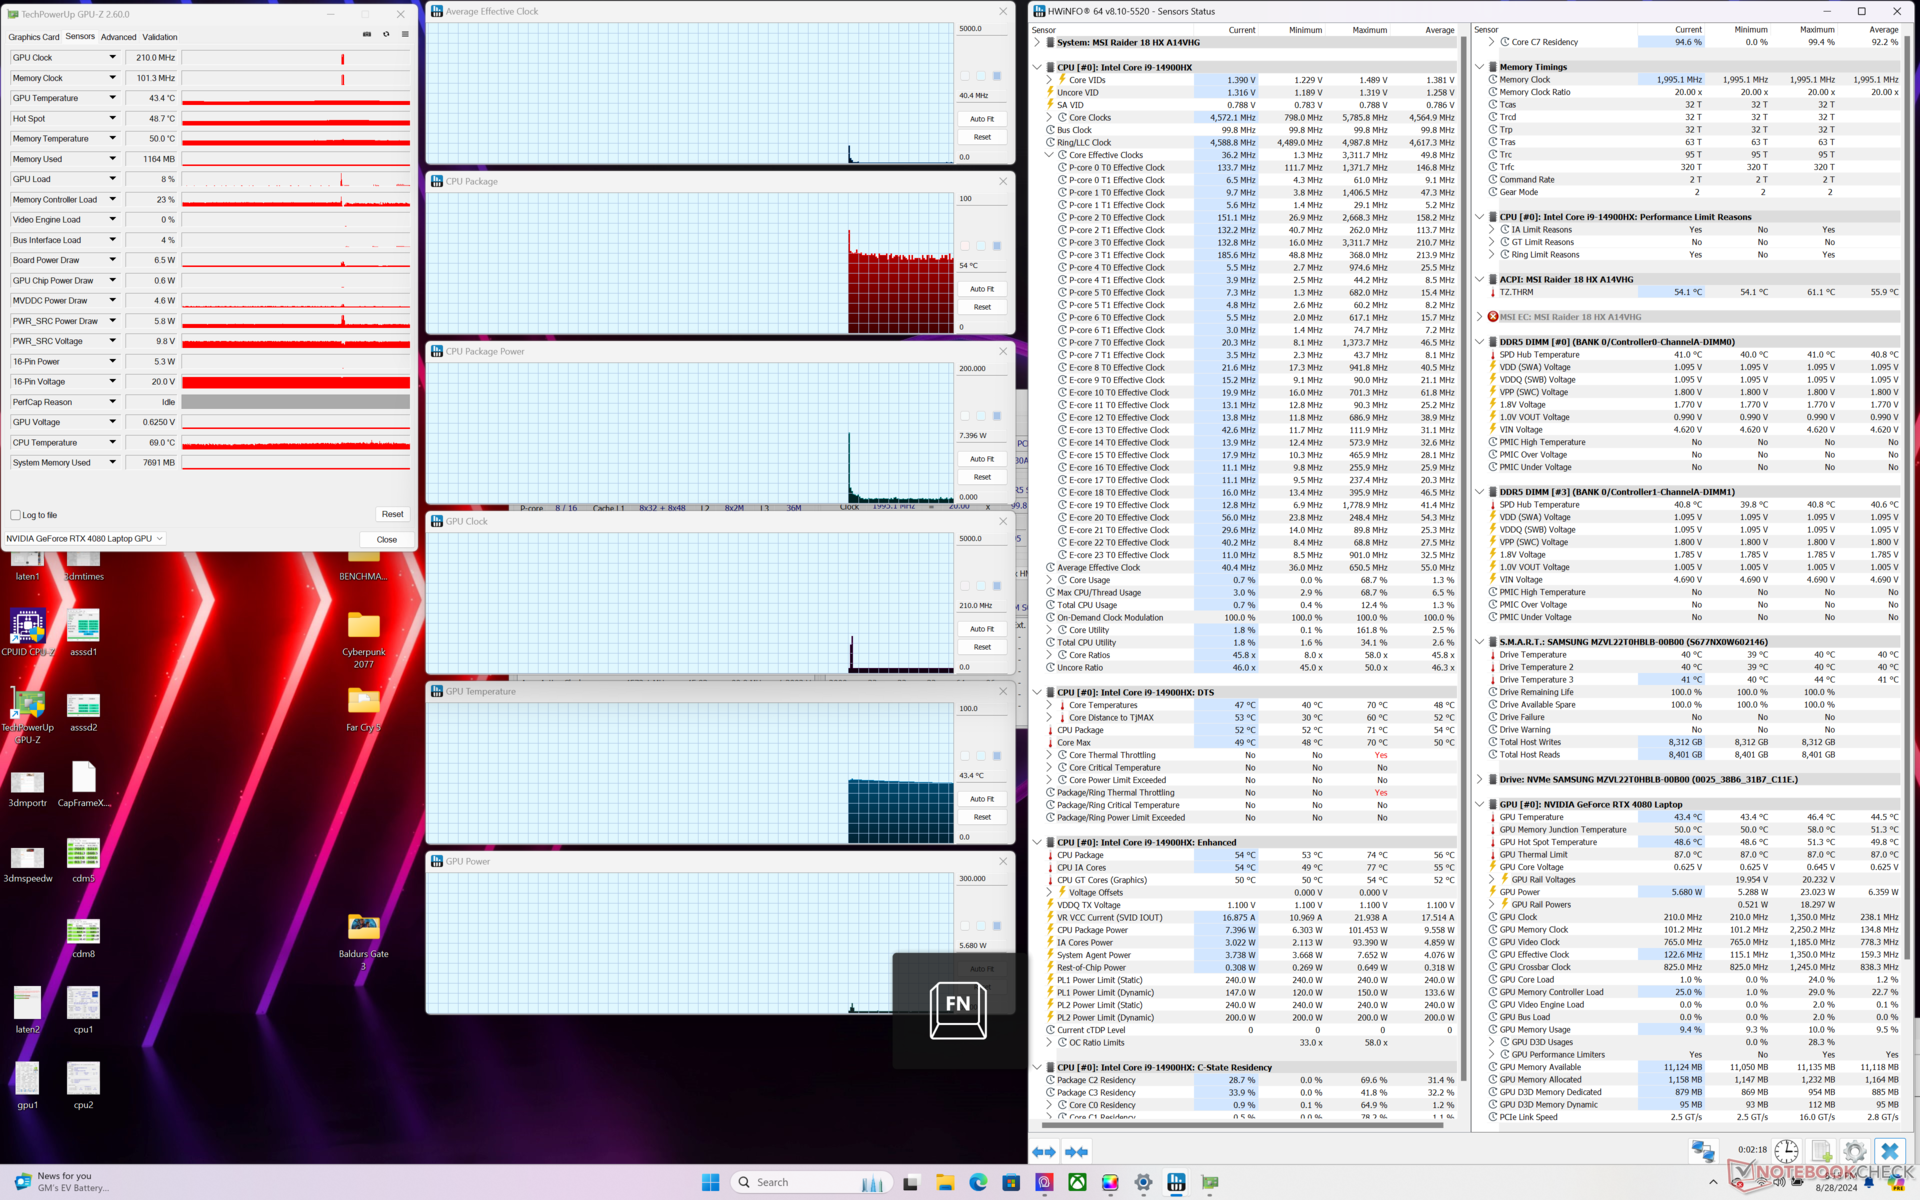

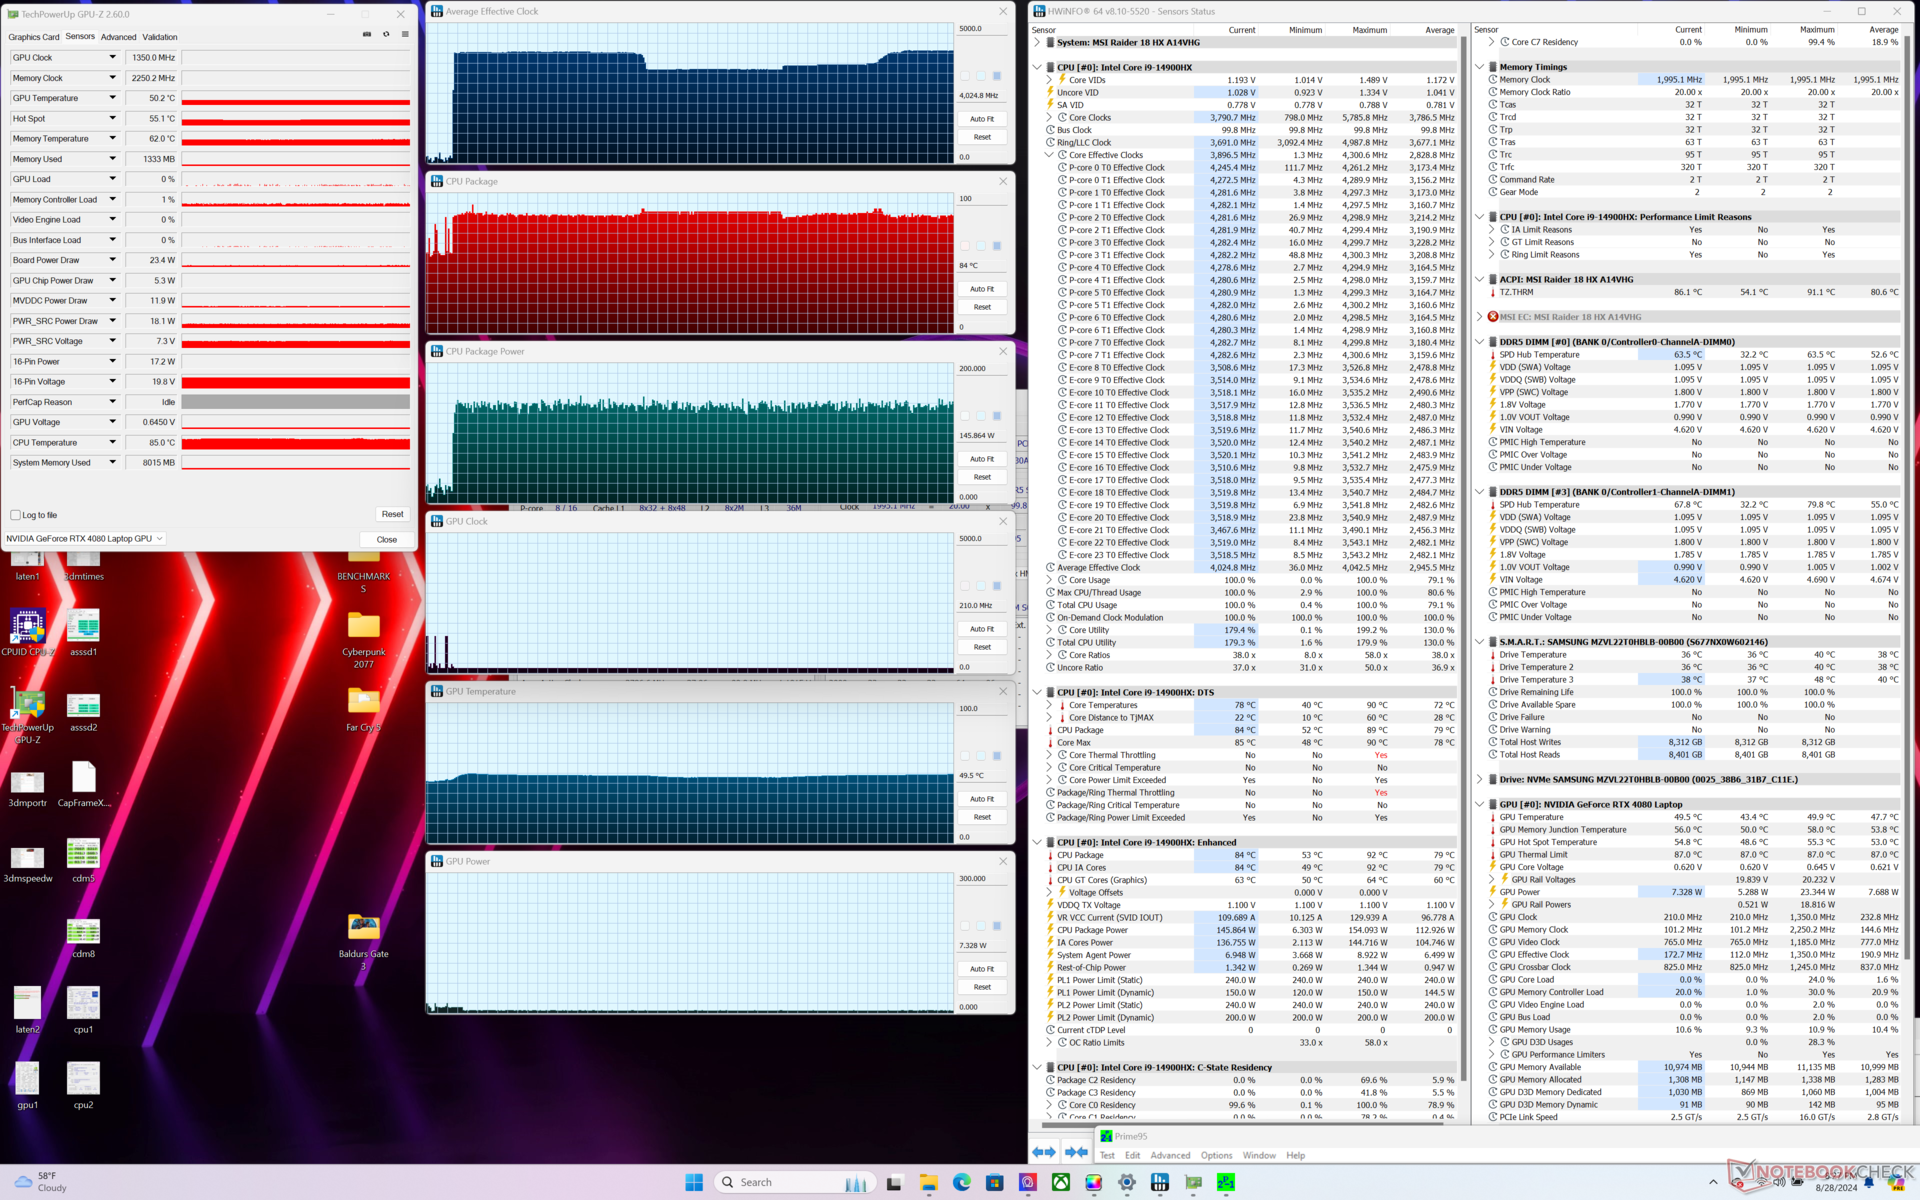
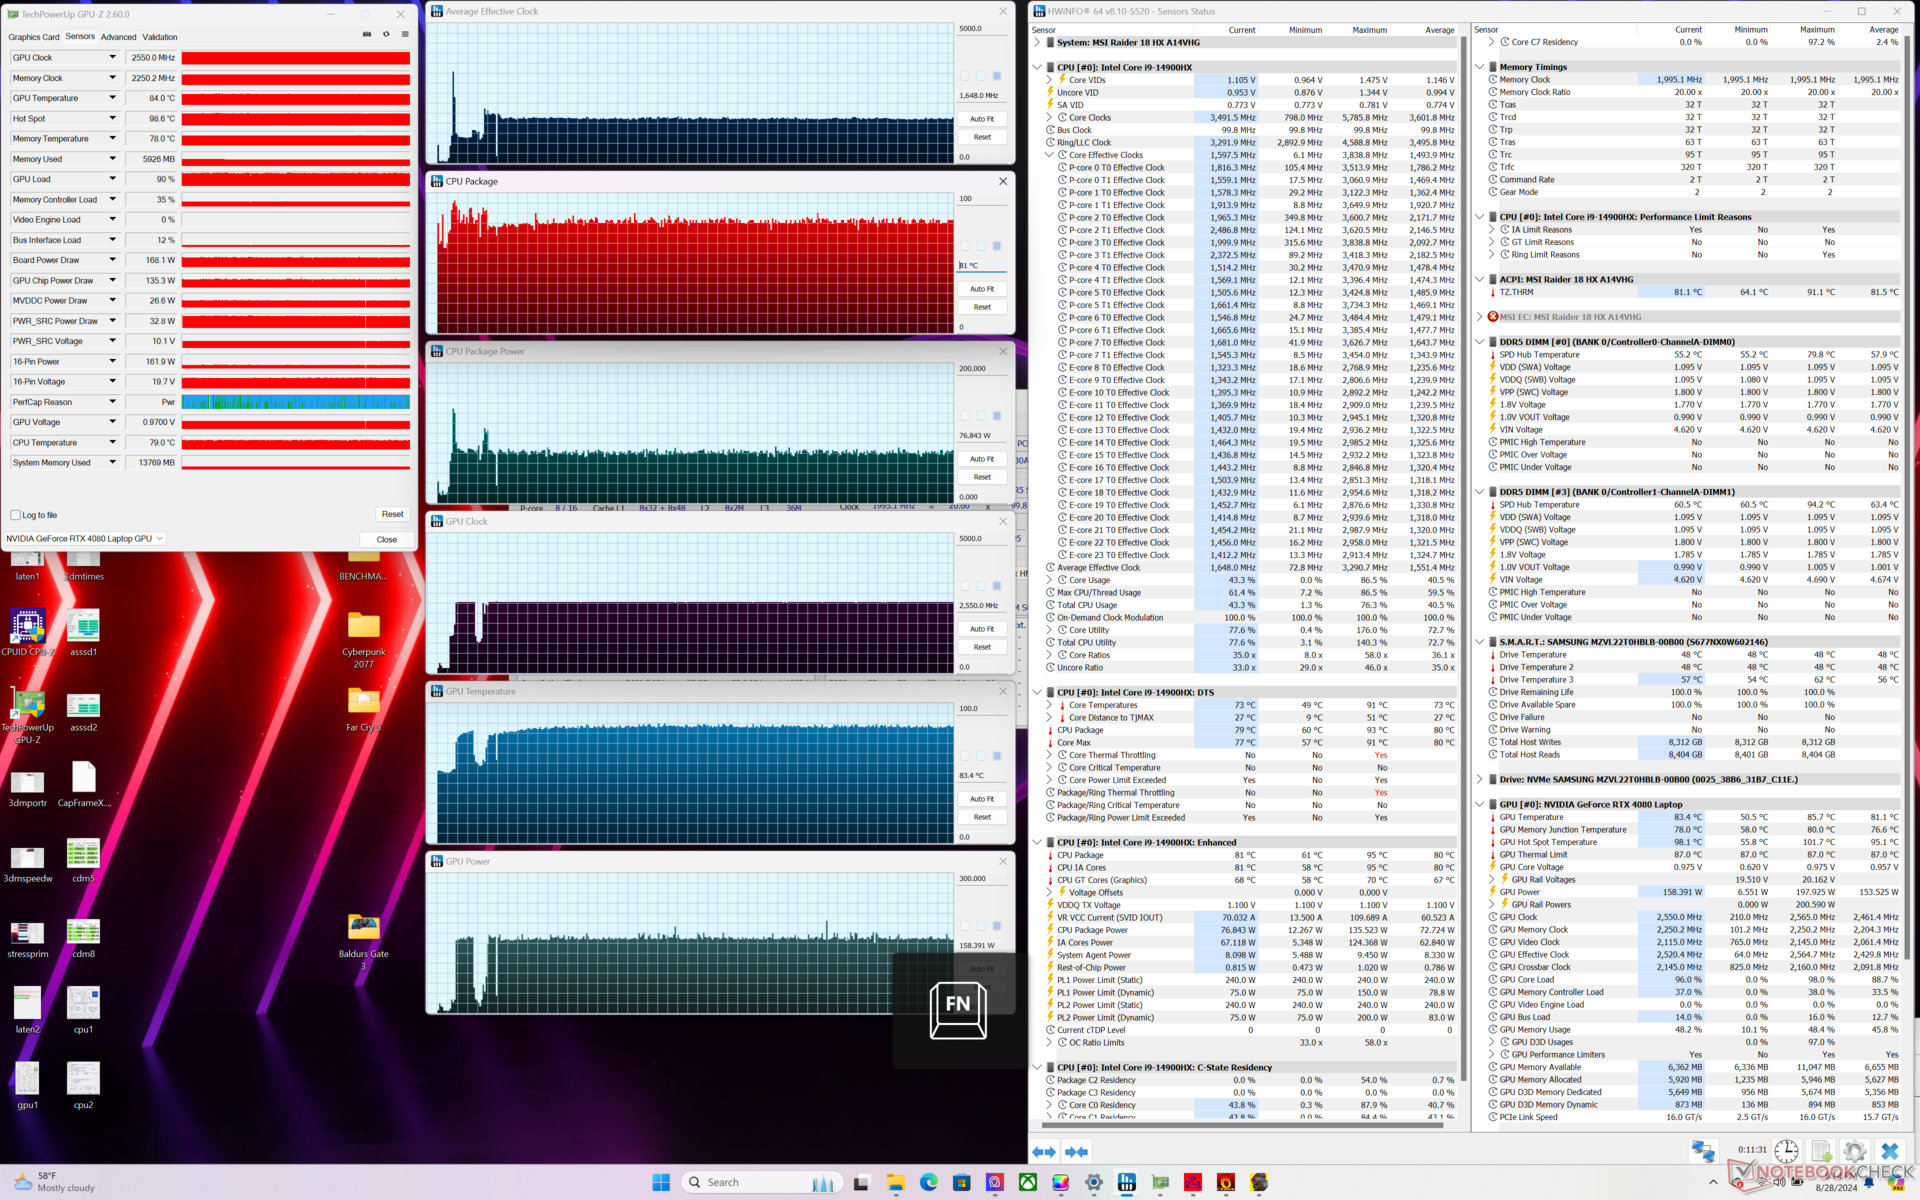
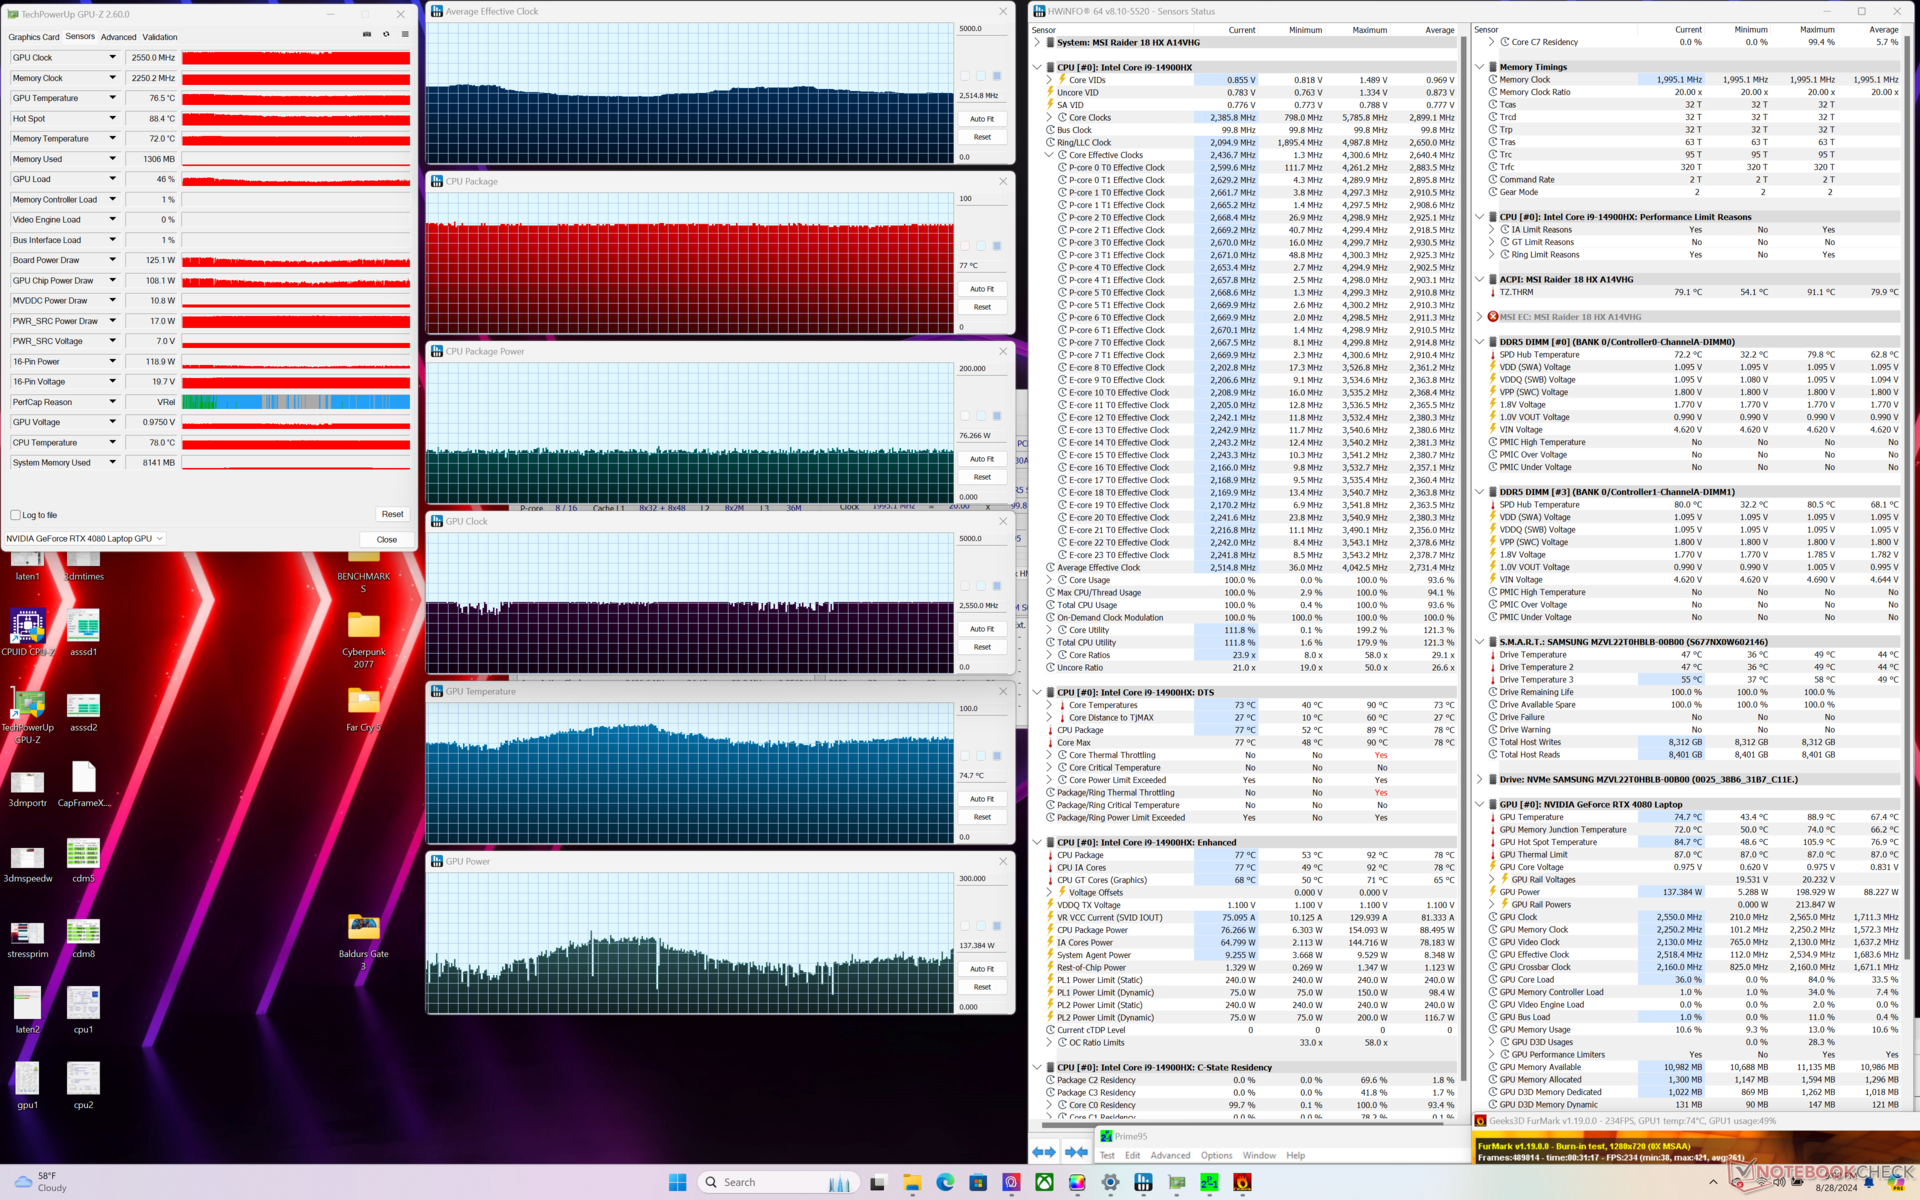
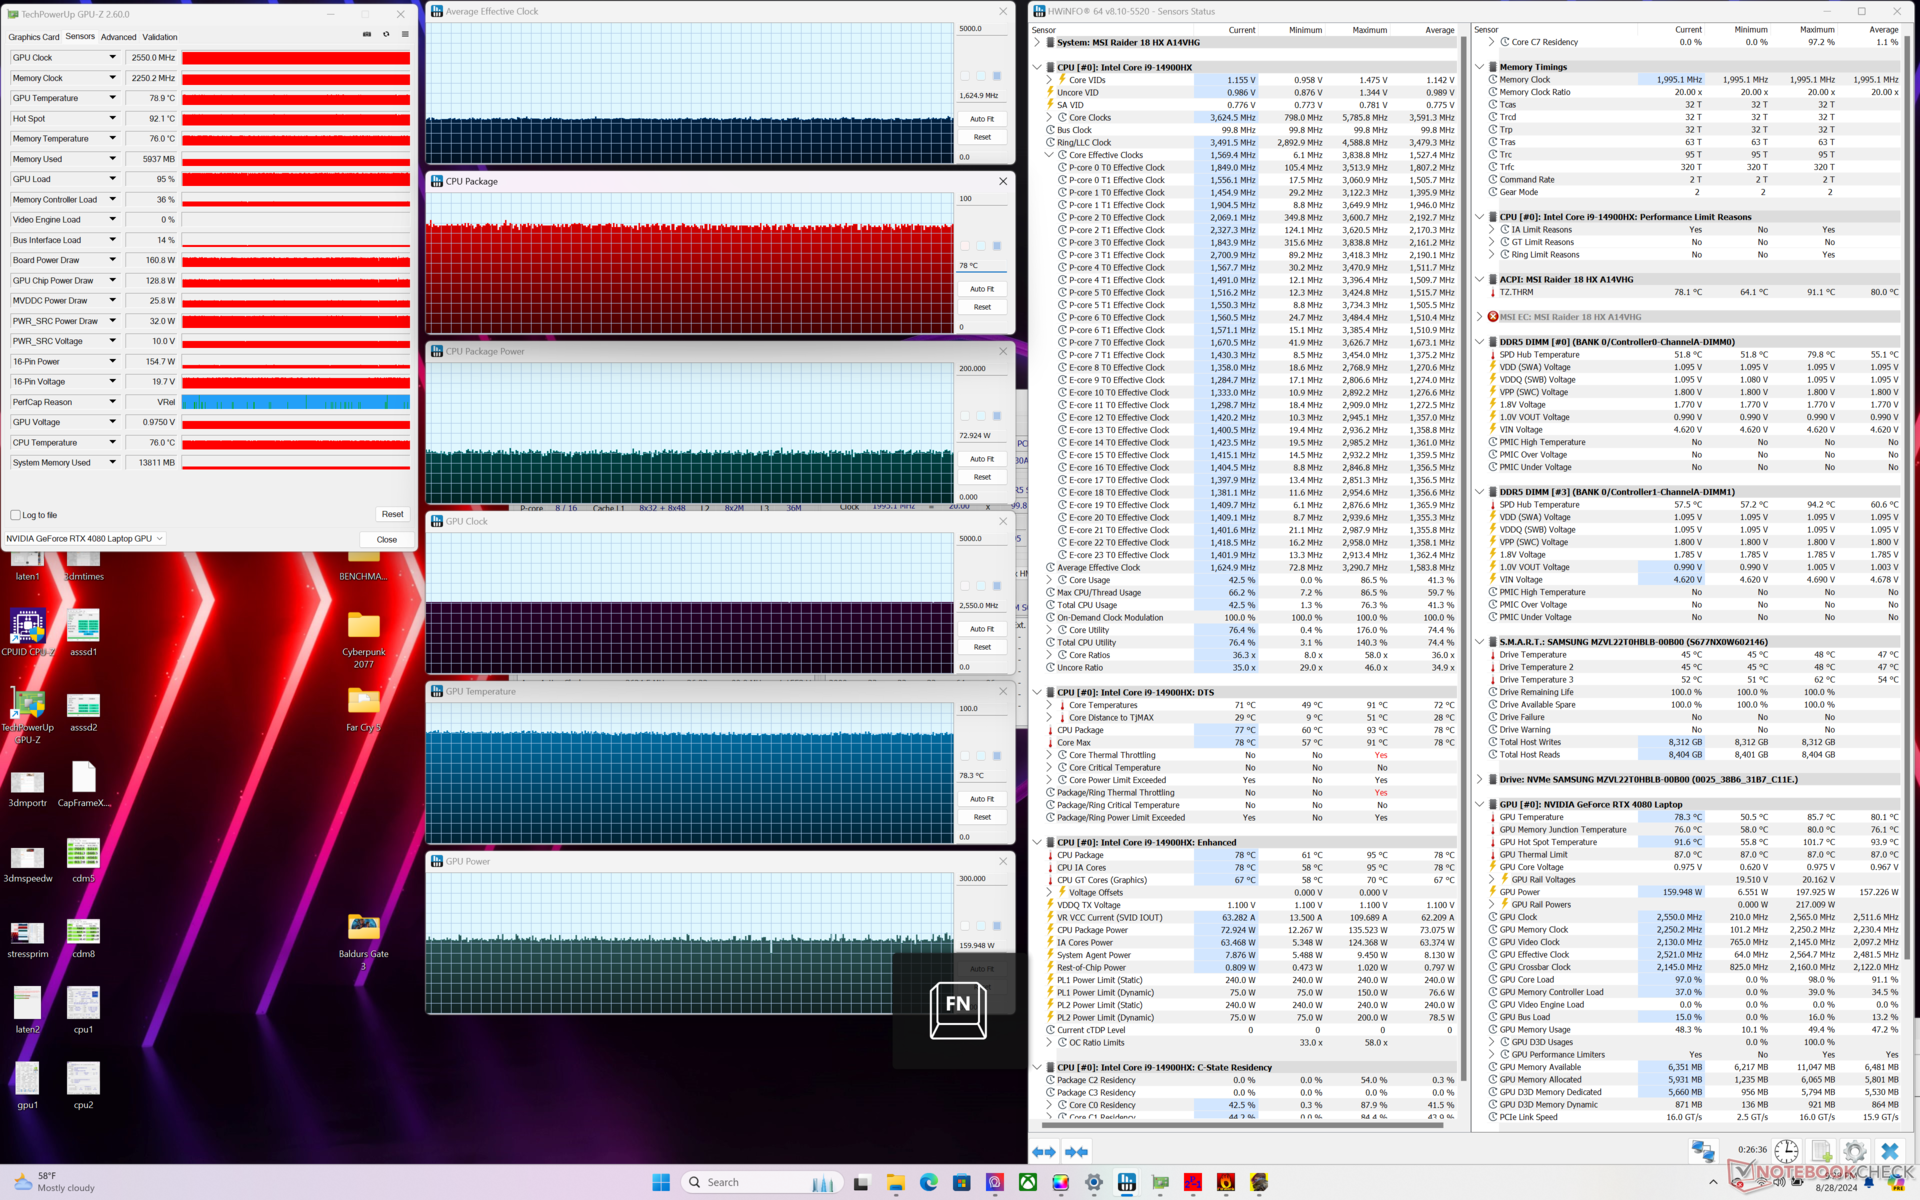
| Átlagos CPU órajel (GHz) | GPU órajel (MHz) | Átlagos CPU hőmérséklet (°C) | Átlagos GPU hőmérséklet (°C) | |
| Rendszer üresjárat | -- | -- | 54 | 43 |
| Prime95 Stressz | 4.0 | -- | 84 | 50 |
| Prime95 + FurMark Stressz | 2.5 | 2550 | 77 | 75 |
| Cyberpunk 2077 Stressz (kiegyensúlyozott mód) | 1,5 | 2295 | 78 | 85 |
| Cyberpunk 2077 Stressz (extrém teljesítmény w/ Cooler Boost off) | 1.7 | 2550 | 81 | 83 81 83 |
| Cyberpunk 2077 Stress (Extrém teljesítmény w/ Cooler Boost on) | 1.6 | 2550 | 78 | 78 |
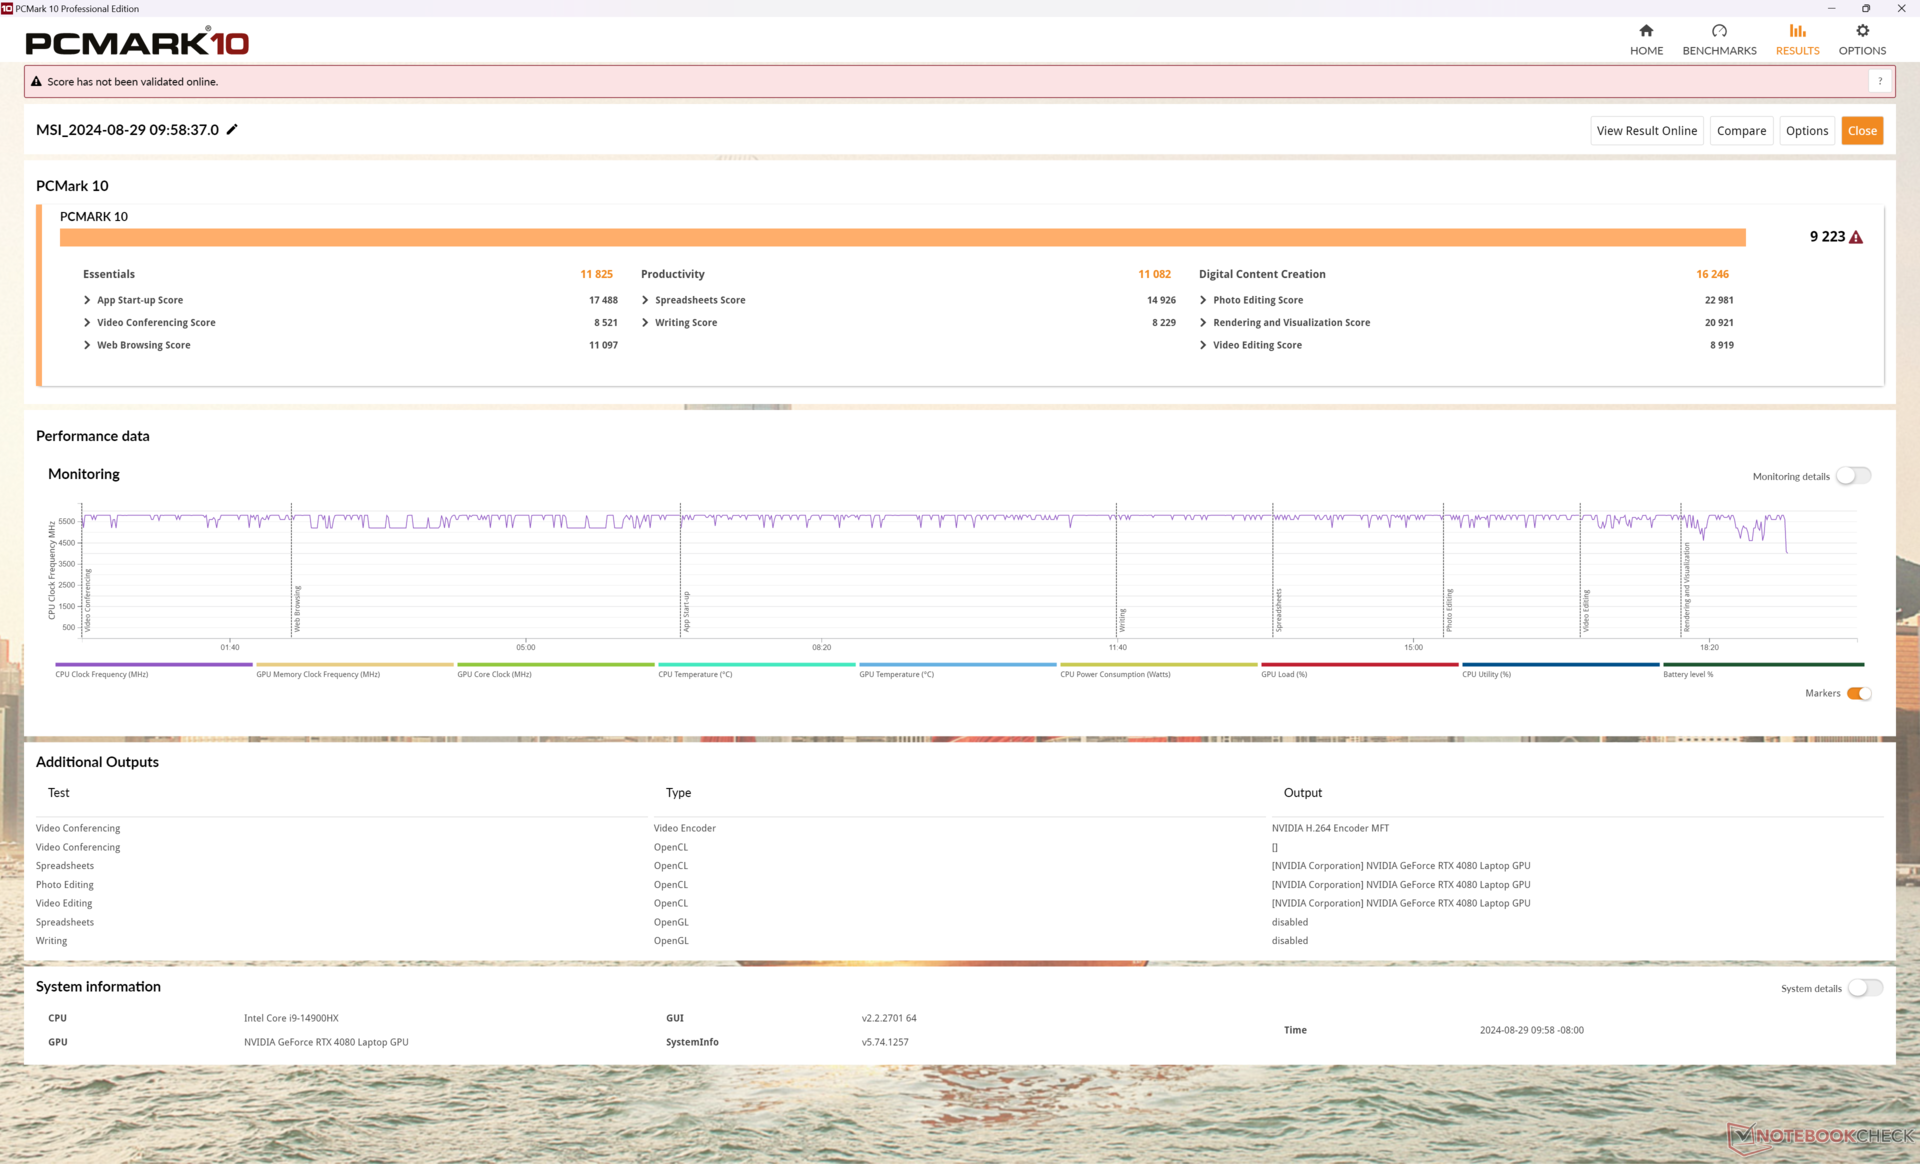
Rendszer teljesítménye
A PCMark 10 pontszámok az MSI Titan 18 HX-hez hasonlíthatók, ami azt mutatja, hogy a mindennapi feladatok nem igazán lassabbak a Raider 18 HX-en, annak ellenére, hogy lényegében egy tónusú Titanról van szó.
A dGPU és iGPU üzemmódok közötti váltáskor furcsa bejelentkezési problémákat tapasztaltunk tesztkészülékünkkel, amelyek minden alkalommal a PIN-kód visszaállítására kényszerítettek minket.
CrossMark: Overall | Productivity | Creativity | Responsiveness
WebXPRT 3: Overall
WebXPRT 4: Overall
Mozilla Kraken 1.1: Total
| PCMark 10 / Score | |
| Alienware m18 R2 | |
| MSI Raider 18 HX A14V | |
| MSI Titan 18 HX A14VIG | |
| Razer Blade 18 2024 RZ09-0509 | |
| Átlagos Intel Core i9-14900HX, NVIDIA GeForce RTX 4080 Laptop GPU (7703 - 9223, n=7) | |
| Acer Predator Helios 18 PH18-72-98MW | |
| Asus ROG Strix G18 G814JI | |
| PCMark 10 / Essentials | |
| MSI Raider 18 HX A14V | |
| Átlagos Intel Core i9-14900HX, NVIDIA GeForce RTX 4080 Laptop GPU (11255 - 12600, n=7) | |
| MSI Titan 18 HX A14VIG | |
| Alienware m18 R2 | |
| Razer Blade 18 2024 RZ09-0509 | |
| Acer Predator Helios 18 PH18-72-98MW | |
| Asus ROG Strix G18 G814JI | |
| PCMark 10 / Productivity | |
| Alienware m18 R2 | |
| MSI Raider 18 HX A14V | |
| Átlagos Intel Core i9-14900HX, NVIDIA GeForce RTX 4080 Laptop GPU (6662 - 11410, n=7) | |
| MSI Titan 18 HX A14VIG | |
| Razer Blade 18 2024 RZ09-0509 | |
| Acer Predator Helios 18 PH18-72-98MW | |
| Asus ROG Strix G18 G814JI | |
| PCMark 10 / Digital Content Creation | |
| MSI Titan 18 HX A14VIG | |
| Alienware m18 R2 | |
| MSI Raider 18 HX A14V | |
| Razer Blade 18 2024 RZ09-0509 | |
| Átlagos Intel Core i9-14900HX, NVIDIA GeForce RTX 4080 Laptop GPU (14211 - 16246, n=7) | |
| Acer Predator Helios 18 PH18-72-98MW | |
| Asus ROG Strix G18 G814JI | |
| CrossMark / Overall | |
| Átlagos Intel Core i9-14900HX, NVIDIA GeForce RTX 4080 Laptop GPU (1992 - 2334, n=7) | |
| MSI Raider 18 HX A14V | |
| Alienware m18 R2 | |
| Razer Blade 18 2024 RZ09-0509 | |
| MSI Titan 18 HX A14VIG | |
| CrossMark / Productivity | |
| Átlagos Intel Core i9-14900HX, NVIDIA GeForce RTX 4080 Laptop GPU (1812 - 2204, n=7) | |
| MSI Raider 18 HX A14V | |
| Razer Blade 18 2024 RZ09-0509 | |
| Alienware m18 R2 | |
| MSI Titan 18 HX A14VIG | |
| CrossMark / Creativity | |
| Átlagos Intel Core i9-14900HX, NVIDIA GeForce RTX 4080 Laptop GPU (2327 - 2500, n=7) | |
| Alienware m18 R2 | |
| MSI Raider 18 HX A14V | |
| Razer Blade 18 2024 RZ09-0509 | |
| MSI Titan 18 HX A14VIG | |
| CrossMark / Responsiveness | |
| Átlagos Intel Core i9-14900HX, NVIDIA GeForce RTX 4080 Laptop GPU (1520 - 2254, n=7) | |
| MSI Raider 18 HX A14V | |
| Alienware m18 R2 | |
| Razer Blade 18 2024 RZ09-0509 | |
| MSI Titan 18 HX A14VIG | |
| WebXPRT 3 / Overall | |
| Razer Blade 18 2024 RZ09-0509 | |
| MSI Raider 18 HX A14V | |
| Átlagos Intel Core i9-14900HX, NVIDIA GeForce RTX 4080 Laptop GPU (310 - 345, n=7) | |
| MSI Titan 18 HX A14VIG | |
| Alienware m18 R2 | |
| Asus ROG Strix G18 G814JI | |
| Asus ROG Strix G18 G814JI | |
| WebXPRT 4 / Overall | |
| MSI Raider 18 HX A14V | |
| Átlagos Intel Core i9-14900HX, NVIDIA GeForce RTX 4080 Laptop GPU (300 - 321, n=7) | |
| Alienware m18 R2 | |
| MSI Titan 18 HX A14VIG | |
| Asus ROG Strix G18 G814JI | |
| Asus ROG Strix G18 G814JI | |
| Mozilla Kraken 1.1 / Total | |
| Asus ROG Strix G18 G814JI | |
| Asus ROG Strix G18 G814JI | |
| MSI Titan 18 HX A14VIG | |
| Razer Blade 18 2024 RZ09-0509 | |
| MSI Raider 18 HX A14V | |
| Acer Predator Helios 18 PH18-72-98MW | |
| Átlagos Intel Core i9-14900HX, NVIDIA GeForce RTX 4080 Laptop GPU (437 - 446, n=7) | |
| Alienware m18 R2 | |
* ... a kisebb jobb
| PCMark 10 Score | 9223 pontok | |
Segítség | ||
| AIDA64 / Memory Copy | |
| Alienware m18 R2 | |
| Acer Predator Helios 18 PH18-72-98MW | |
| Razer Blade 18 2024 RZ09-0509 | |
| Átlagos Intel Core i9-14900HX (38028 - 83392, n=36) | |
| MSI Raider 18 HX A14V | |
| Asus ROG Strix G18 G814JI | |
| MSI Titan 18 HX A14VIG | |
| AIDA64 / Memory Read | |
| Alienware m18 R2 | |
| Acer Predator Helios 18 PH18-72-98MW | |
| Razer Blade 18 2024 RZ09-0509 | |
| Átlagos Intel Core i9-14900HX (43306 - 87568, n=36) | |
| Asus ROG Strix G18 G814JI | |
| MSI Raider 18 HX A14V | |
| MSI Titan 18 HX A14VIG | |
| AIDA64 / Memory Write | |
| Alienware m18 R2 | |
| Átlagos Intel Core i9-14900HX (37146 - 80589, n=36) | |
| Acer Predator Helios 18 PH18-72-98MW | |
| Razer Blade 18 2024 RZ09-0509 | |
| MSI Raider 18 HX A14V | |
| Asus ROG Strix G18 G814JI | |
| MSI Titan 18 HX A14VIG | |
| AIDA64 / Memory Latency | |
| MSI Titan 18 HX A14VIG | |
| MSI Raider 18 HX A14V | |
| Razer Blade 18 2024 RZ09-0509 | |
| Alienware m18 R2 | |
| Átlagos Intel Core i9-14900HX (76.1 - 105, n=36) | |
| Asus ROG Strix G18 G814JI | |
| Acer Predator Helios 18 PH18-72-98MW | |
* ... a kisebb jobb
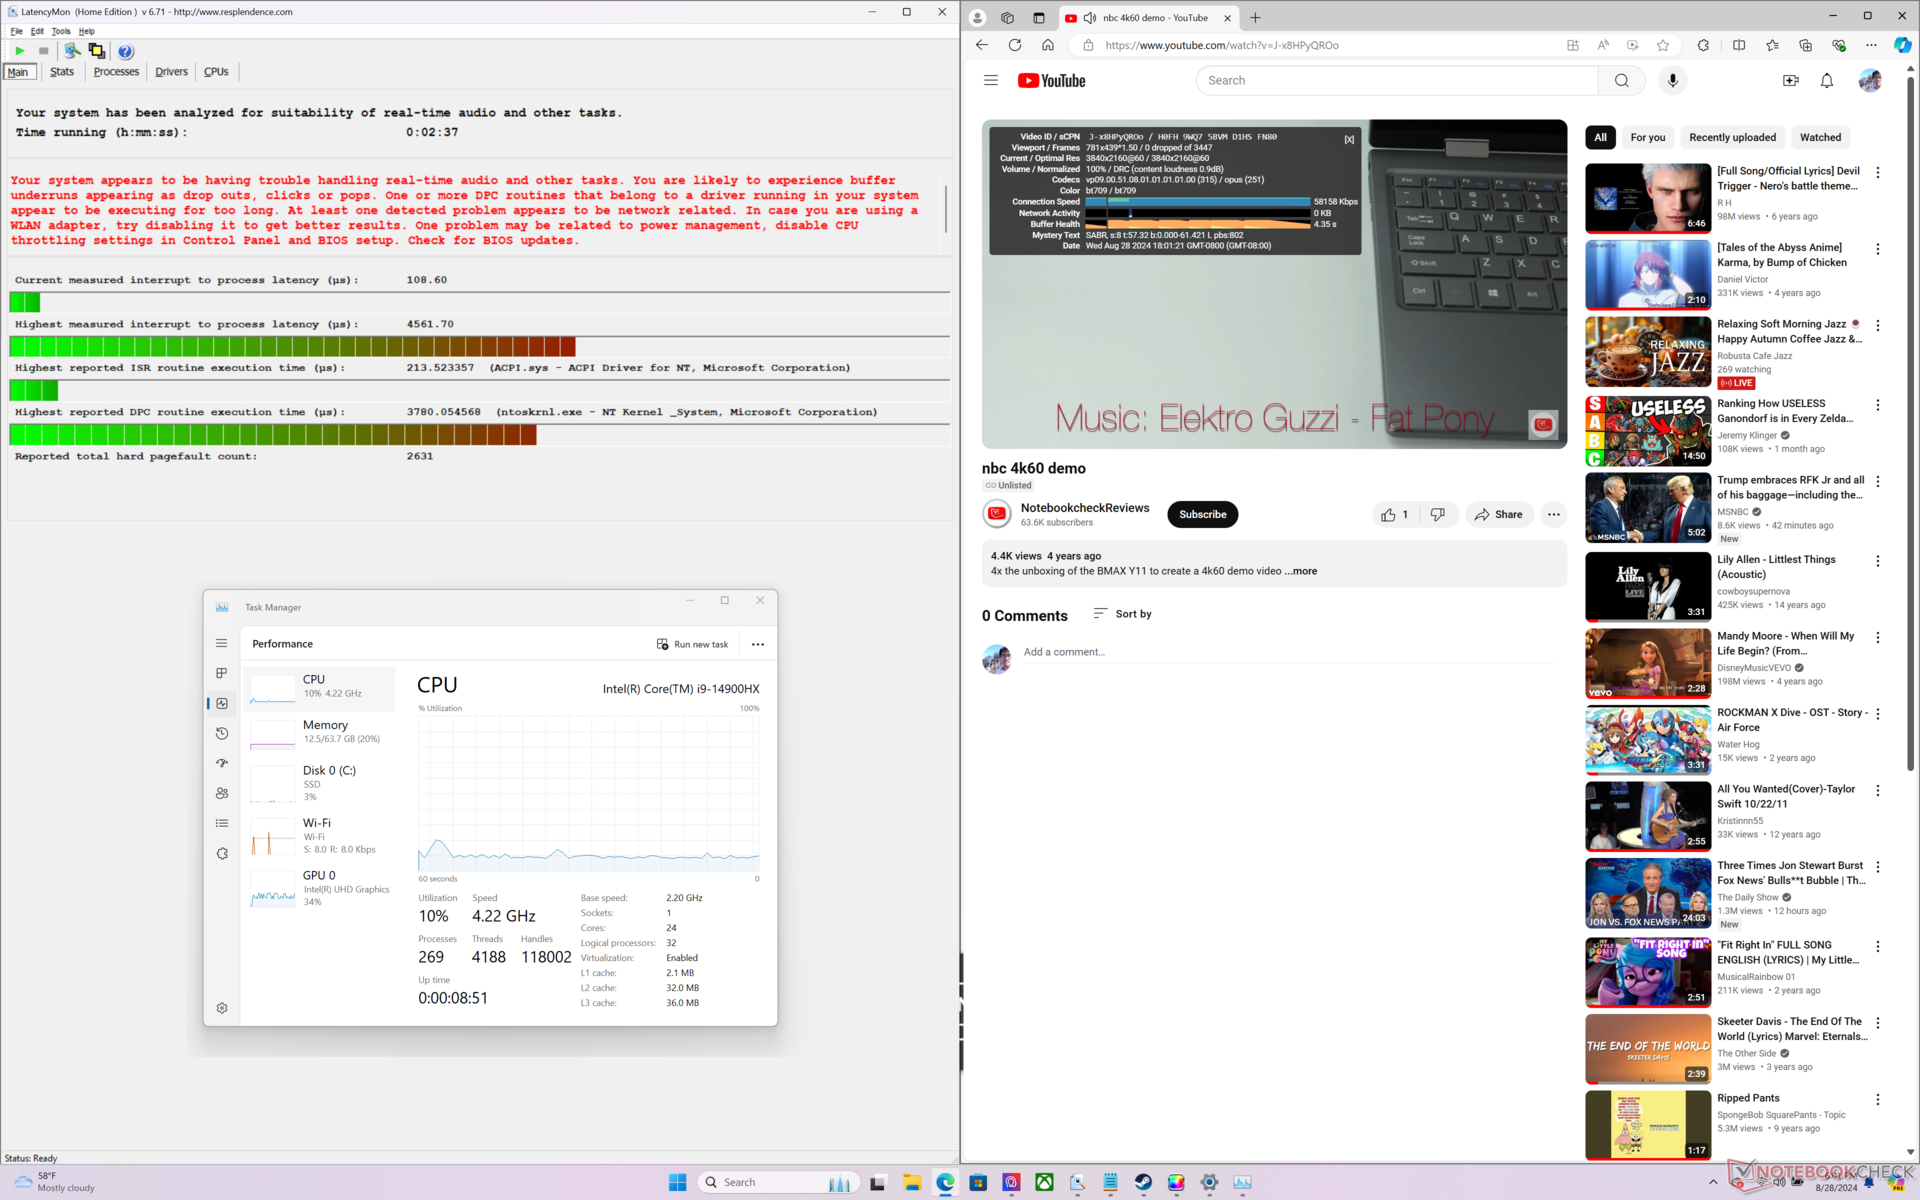
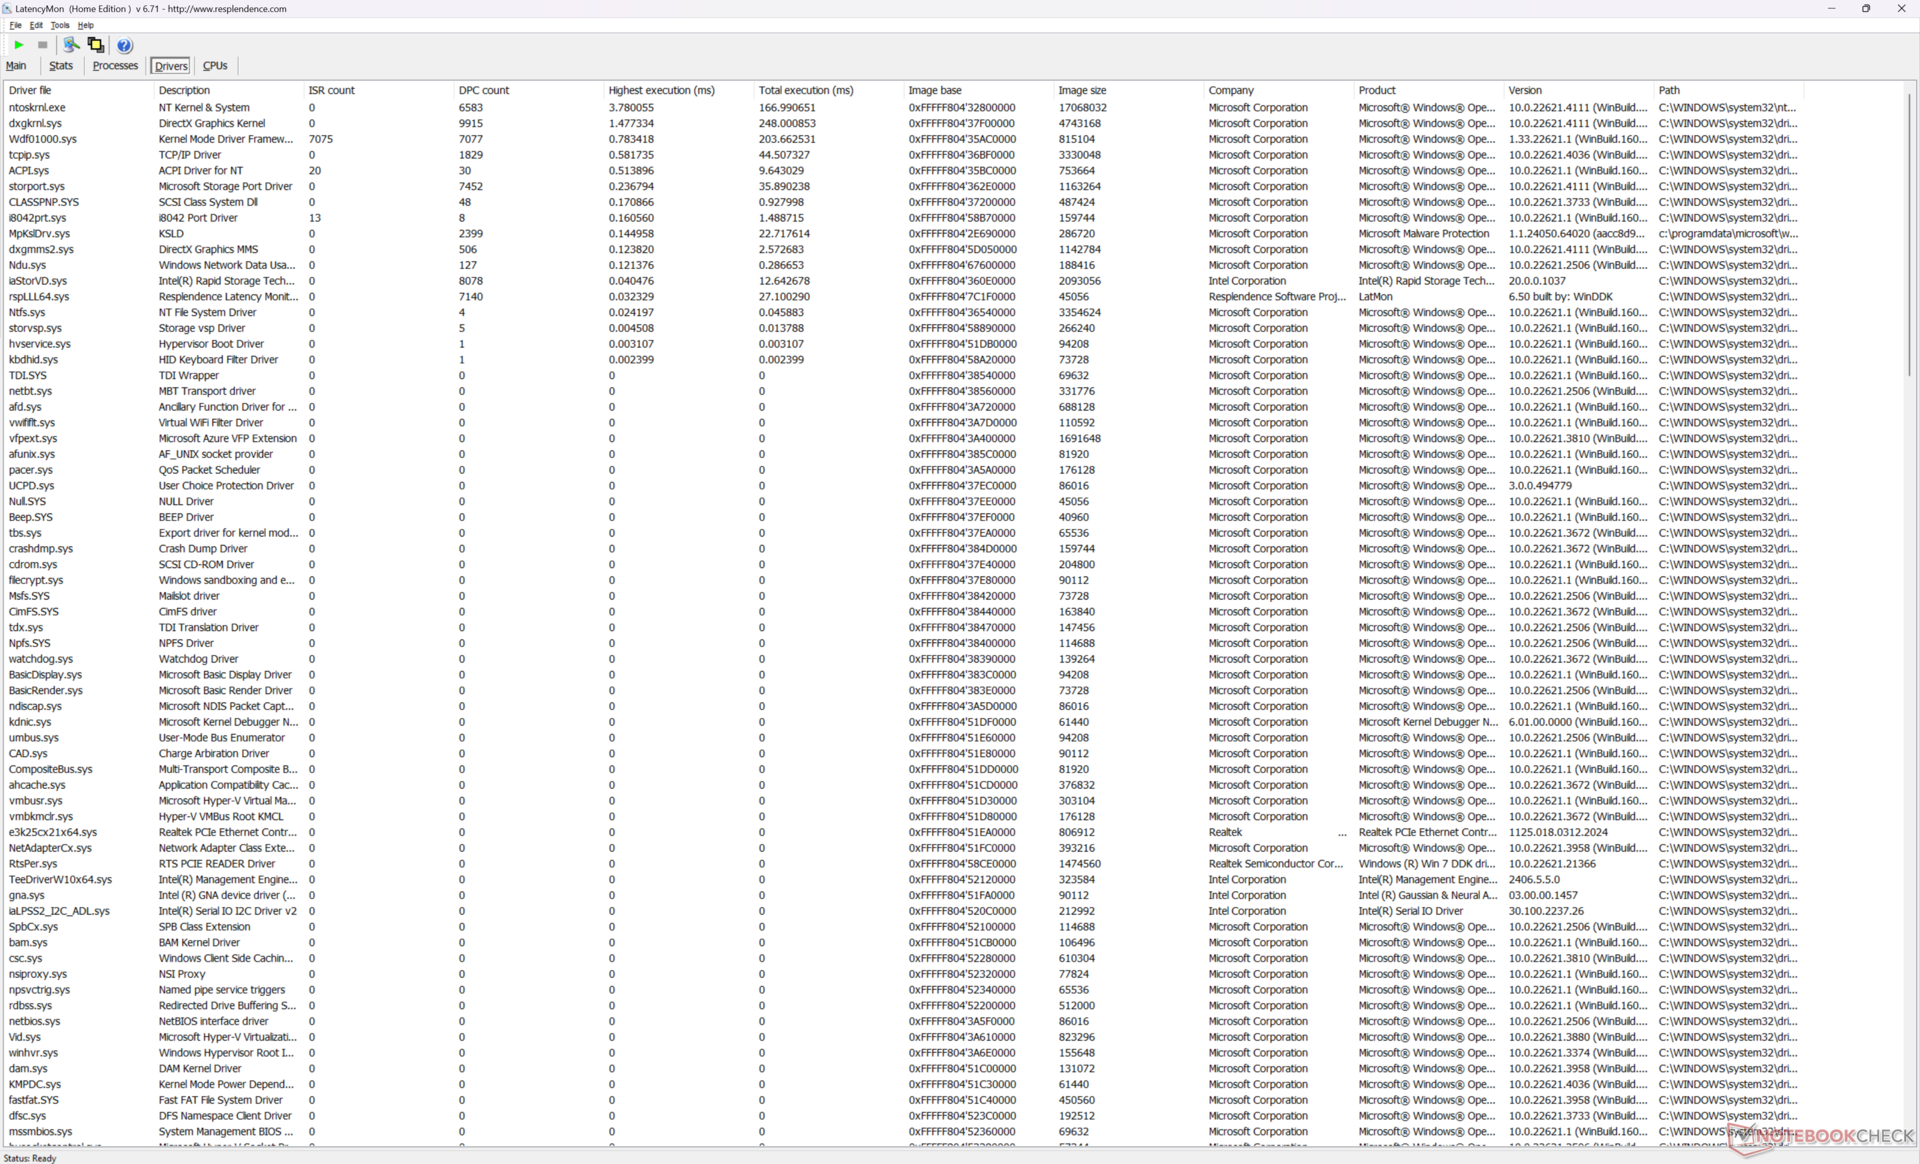
DPC késleltetés
A LatencyMon DPC-problémákat mutat a honlapunk több lapjának megnyitásakor, még akkor is, ha iGPU módban van beállítva. a 4K videolejátszás 60 FPS mellett egyébként tökéletes, és nem rögzítettünk kiesett képkockákat.
| DPC Latencies / LatencyMon - interrupt to process latency (max), Web, Youtube, Prime95 | |
| MSI Raider 18 HX A14V | |
| Acer Predator Helios 18 PH18-72-98MW | |
| Alienware m18 R2 | |
| MSI Titan 18 HX A14VIG | |
| Razer Blade 18 2024 RZ09-0509 | |
| Asus ROG Strix G18 G814JI | |
* ... a kisebb jobb
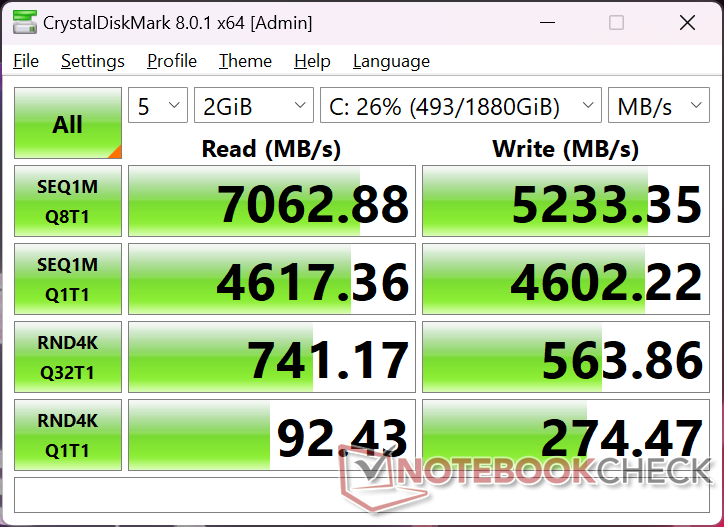
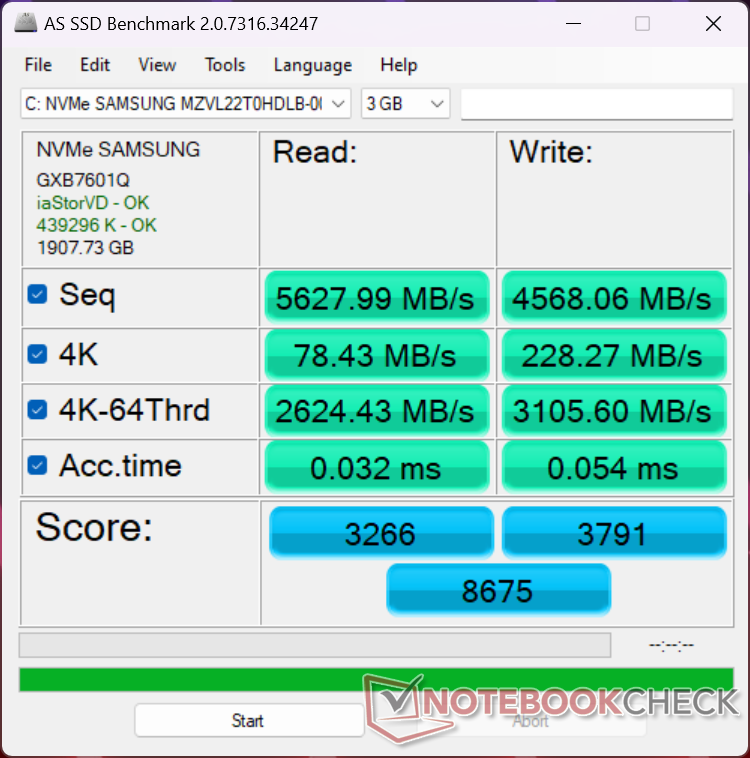
Tárolóeszközök
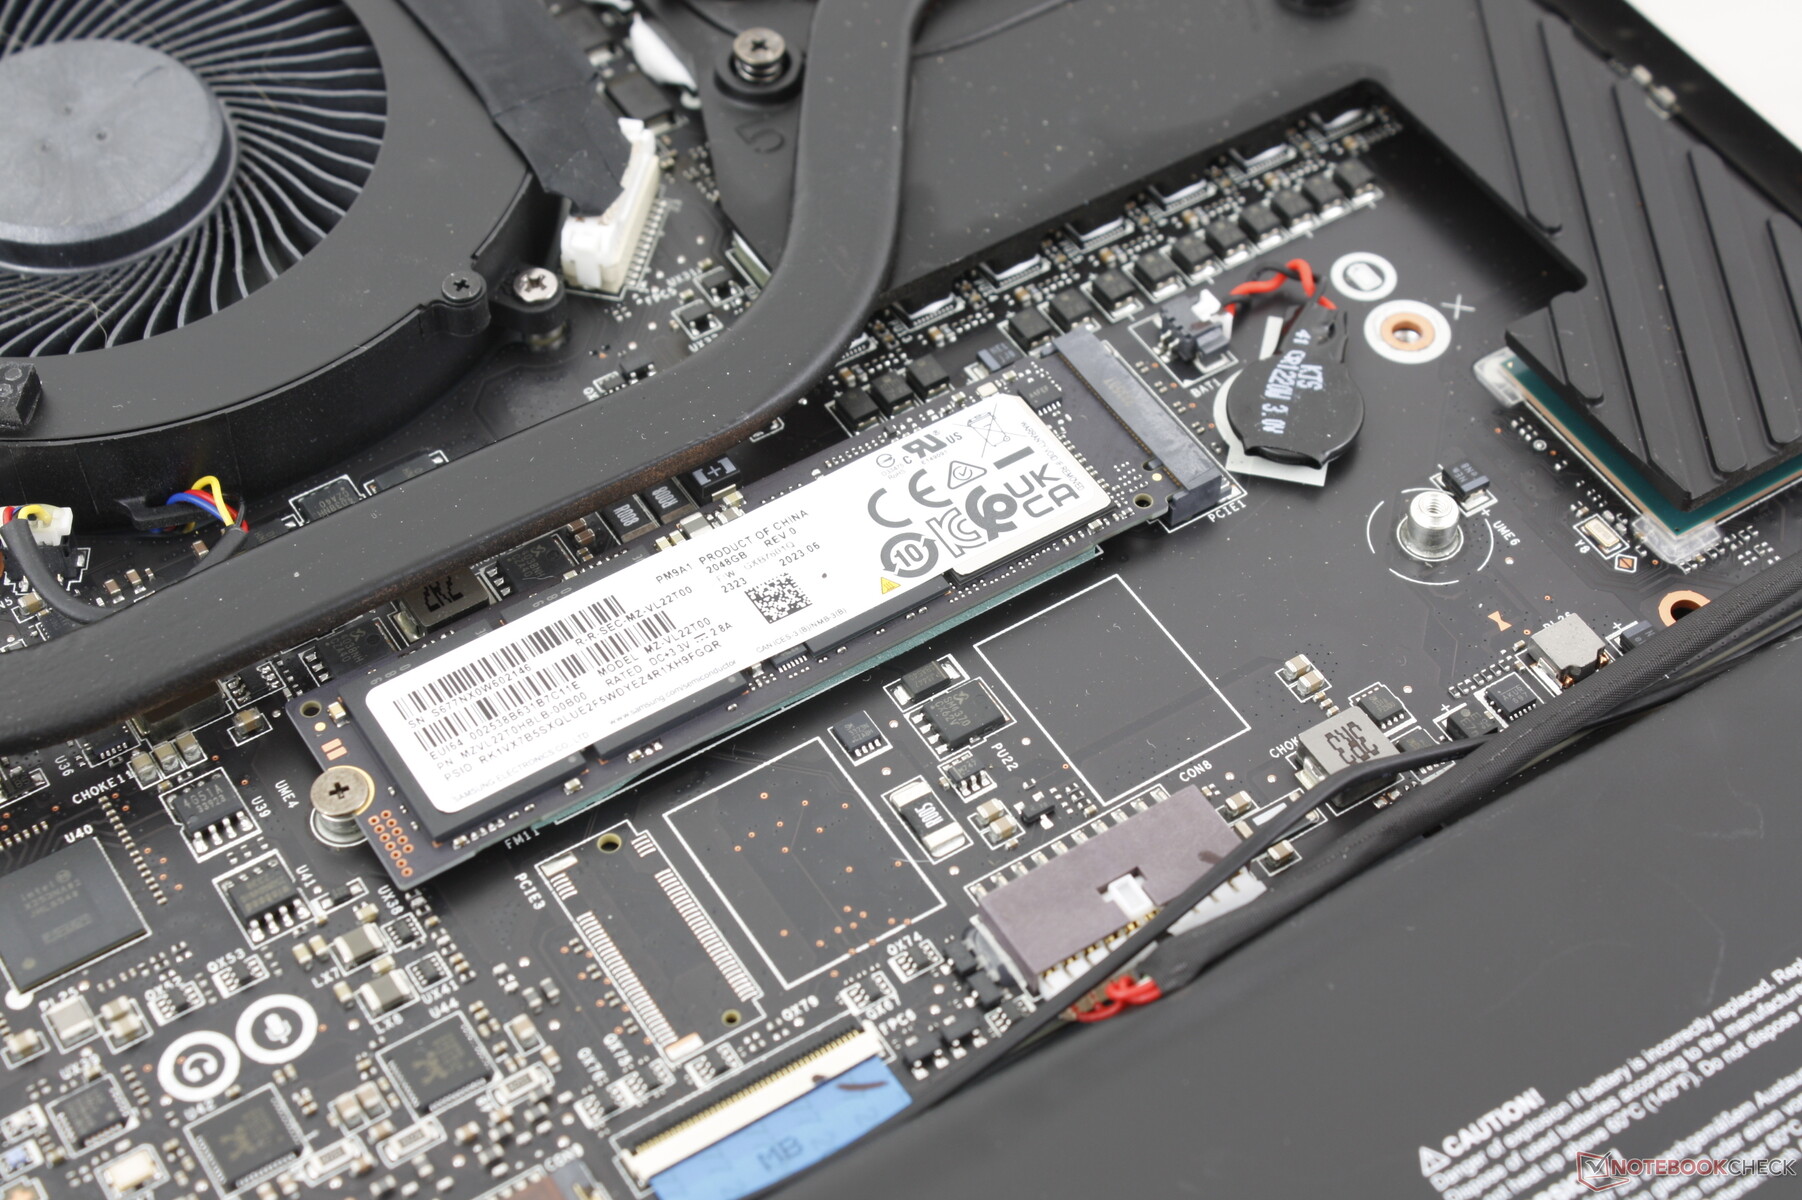
A mi készülékünk a Samsung PM9A1a MZVL22T0HDLB PCIe4 SSD-vel, amely általában a csúcskategóriás laptopokban található. Az átviteli sebesség stabilan ~7000 MB/s még terhelés esetén is, és még gyorsabb lehet, ha PCIe5 meghajtóval konfiguráljuk. A beépített hőelosztó hiánya azonban azt jelentheti, hogy a PCIe5 meghajtók nagyobb eséllyel torlódnak fel.

| Drive Performance rating - Percent | |
| Alienware m18 R2 | |
| MSI Raider 18 HX A14V | |
| Acer Predator Helios 18 PH18-72-98MW | |
| MSI Titan 18 HX A14VIG | |
| Razer Blade 18 2024 RZ09-0509 | |
| Asus ROG Strix G18 G814JI | |
* ... a kisebb jobb
Disk Throttling: DiskSpd Read Loop, Queue Depth 8
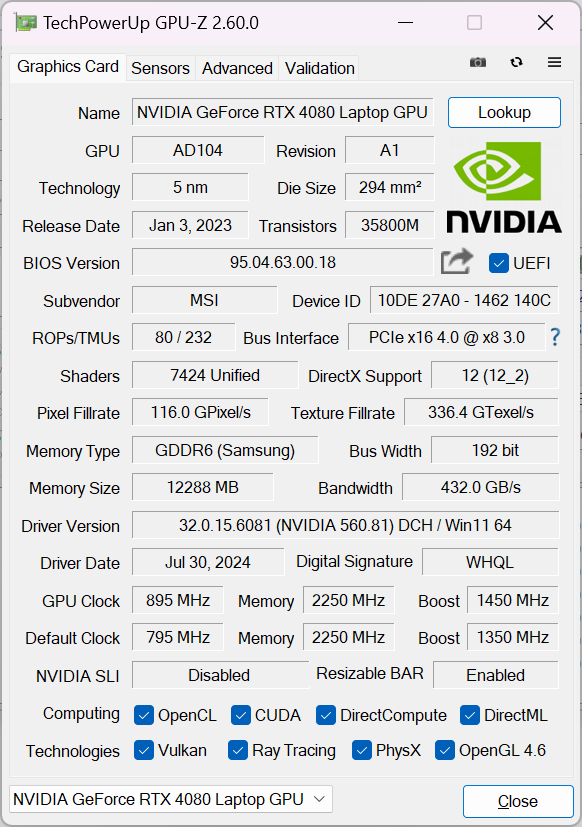
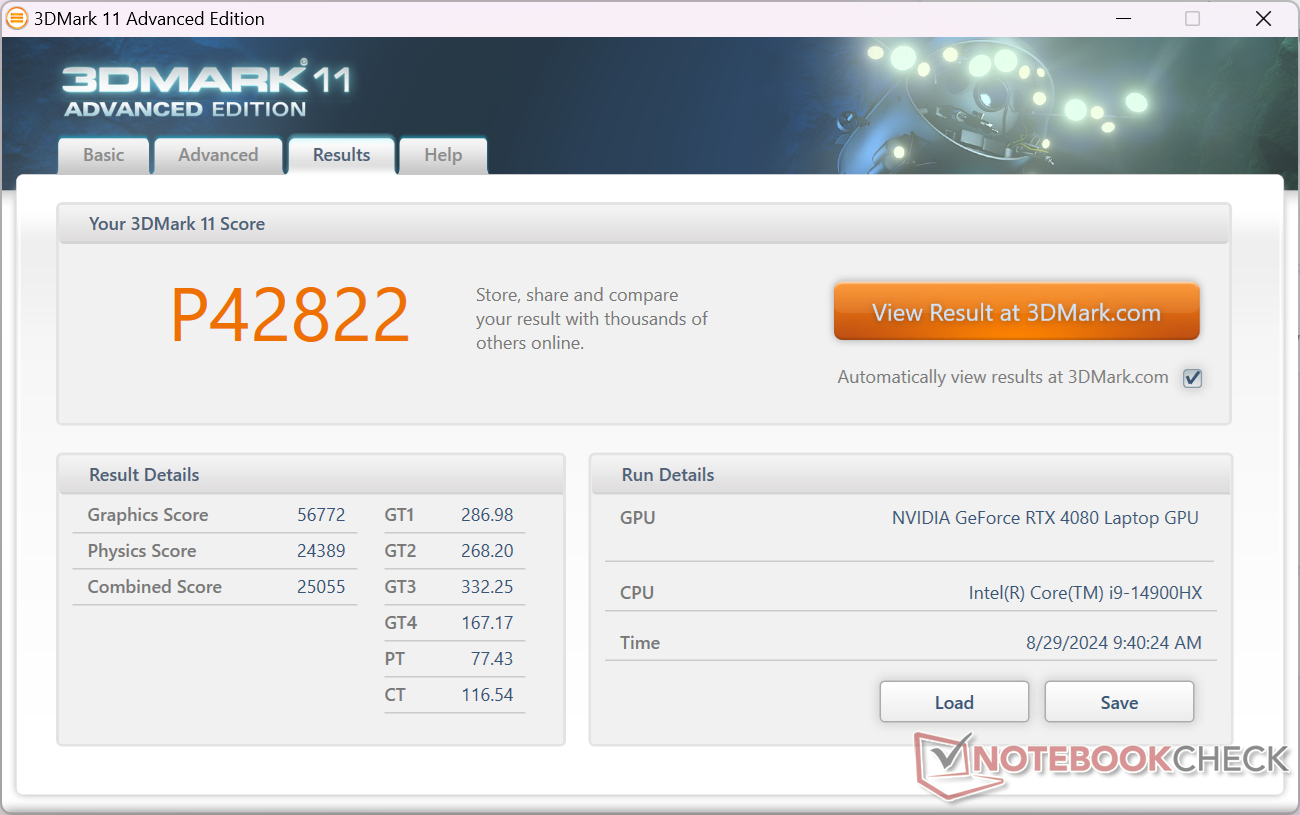
GPU teljesítmény - 175 W TGP grafika
Ellentétben a vékonyabb laptopokkal, amelyek a hajóban gyengébb 80 W-os GeForce RTX 4080 grafikus kártyákkal, a nagyobb Raider 18 HX egy erősebb, 175 W-os (150 W + 25 W dinamikus boost) verzióval érkezik. A teljesítmény körülbelül 5 százalékkal gyorsabb, mint az adatbázisunkban szereplő átlagos laptopoknál a gPU-val míg az RTX 4090-re való frissítés további 10 százalékkal növeli a teljesítményt.
Ne feledje, hogy az általános teljesítmény még mindig 30-35 százalékkal lassabb, mint a a GeForce RTX 4080 asztali verziójához képest még akkor is, ha a mobil változat ugyanazt a nevet viseli. A mi mobil RTX 4080-asunk tehát teljesítményben közelebb áll a asztali RTX 4070-hez.
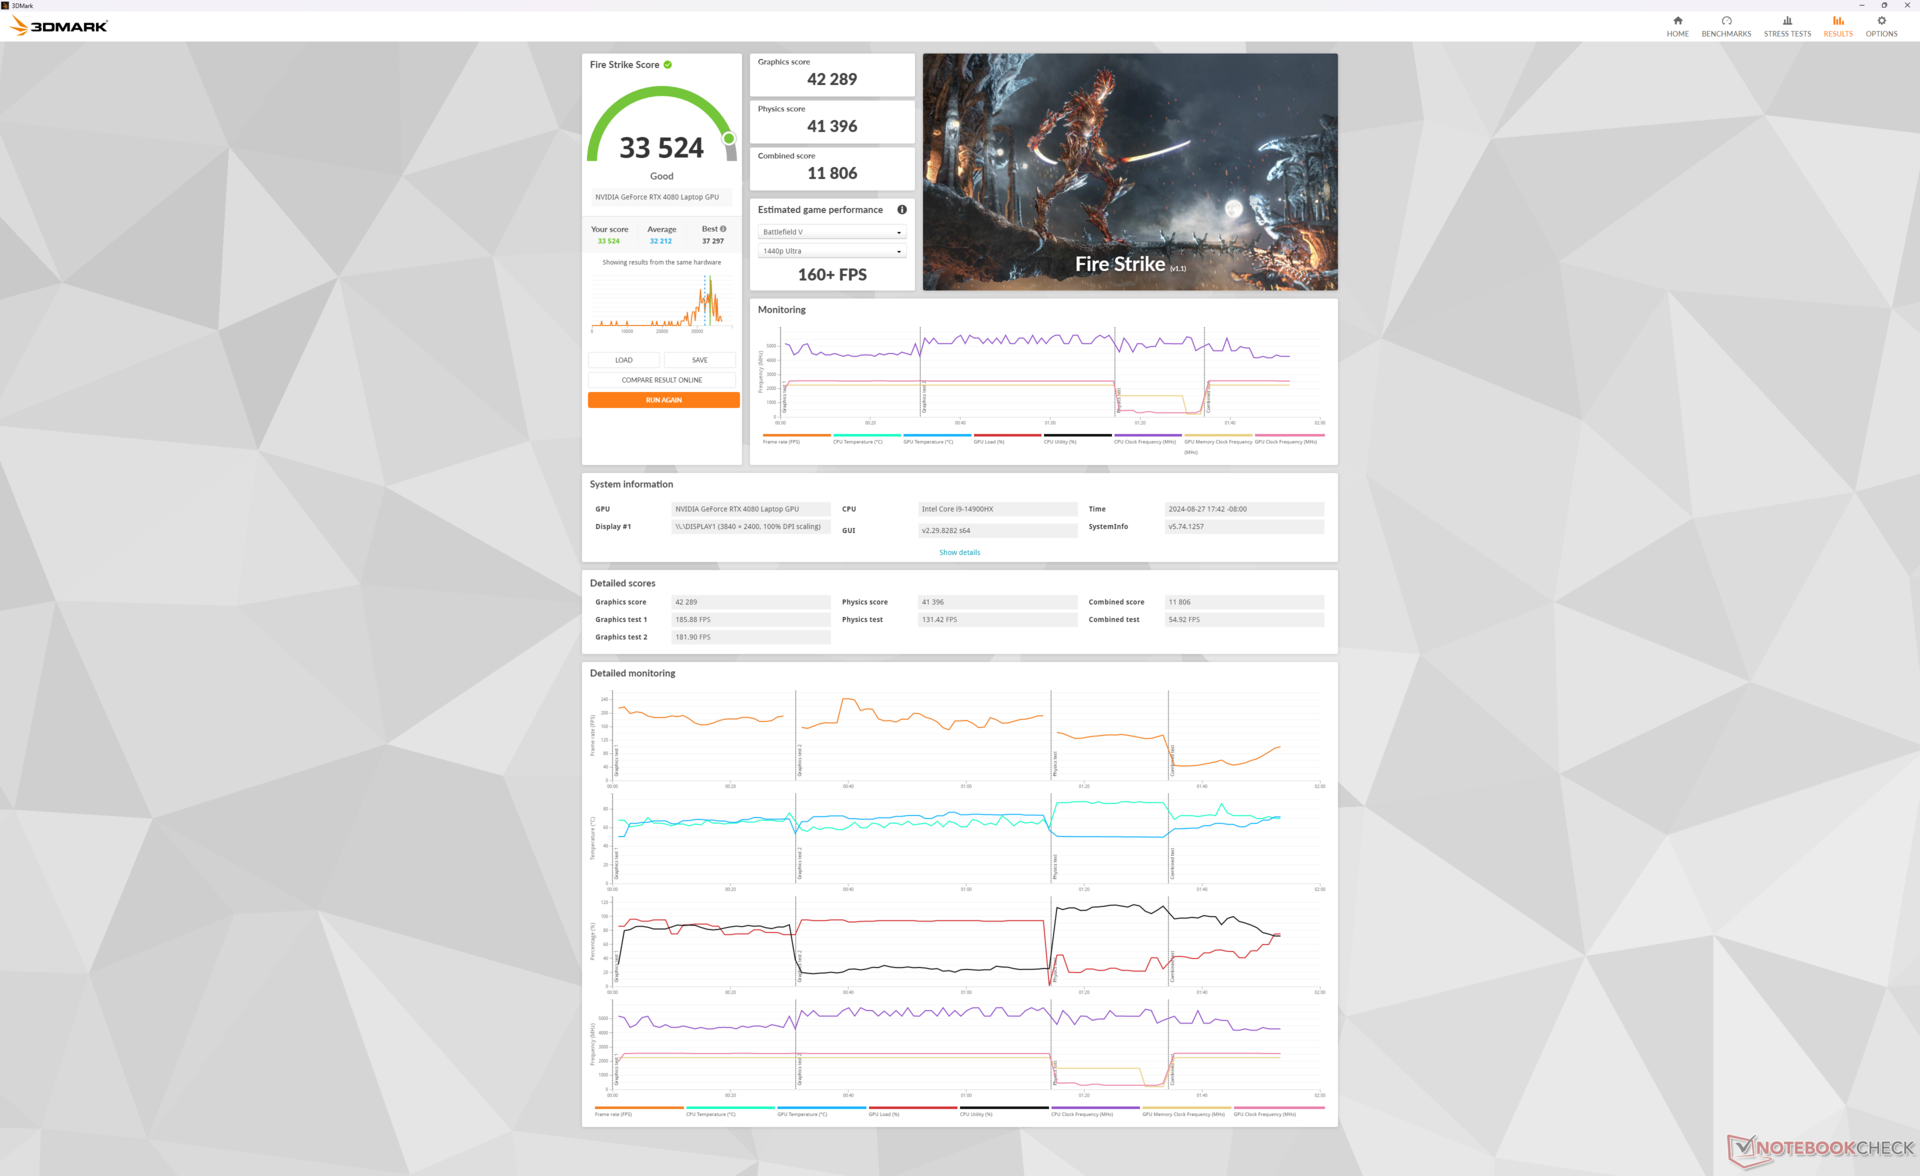
| Teljesítményprofil | Grafikus pontszám | Fizika pontszám | Kombinált pontszám |
| Extrém teljesítmény (Cooler Boost bekapcsolva) | 42289 | 41396 | 11806 |
| Extrém teljesítmény (Cooler Boost kikapcsolva) | 41778 (-1%) | 40723 (-2%) | 11968 (-1%) |
| Kiegyensúlyozott üzemmód | 41673 (-2%) | 41013 (-1%) | 10404 (-12%) |
| Akkumulátor teljesítmény | 21731 (-49%) | 17988 (-57%) | 5809 (-51%) |
Az extrém teljesítményű üzemmódból a kiegyensúlyozott üzemmódba való átváltás csak kis mértékben befolyásolja a teljesítményt, ami összhangban van a fenti stresszteszt megfigyeléseivel. A Cooler Boost bekapcsolása szintén nem sok különbséget jelent, kivéve a maghőmérséklet csökkentését, mivel a ventilátorok zajszintje jelentősen megnövekedett.

| 3DMark Performance rating - Percent | |
| NVIDIA GeForce RTX 4080 Founders Edition -1! | |
| Alienware m18 R2 -1! | |
| Razer Blade 18 2024 RZ09-0509 -1! | |
| MSI Raider 18 HX A14V | |
| Alienware m18 R1 AMD -2! | |
| Átlagos NVIDIA GeForce RTX 4080 Laptop GPU | |
| Zotac Gaming GeForce RTX 4070 AMP Airo -1! | |
| Asus ROG Strix Scar 17 SE G733CX-LL014W -1! | |
| Alienware x17 RTX 3080 P48E -2! | |
| Asus ROG Strix G18 G814JI -2! | |
| Schenker XMG Ultra 17 Comet Lake -2! | |
| MSI Pulse GL76 12UGK -1! | |
| 3DMark 11 - 1280x720 Performance GPU | |
| NVIDIA GeForce RTX 4080 Founders Edition | |
| Alienware m18 R2 | |
| Razer Blade 18 2024 RZ09-0509 | |
| Alienware m18 R1 AMD | |
| Zotac Gaming GeForce RTX 4070 AMP Airo | |
| Átlagos NVIDIA GeForce RTX 4080 Laptop GPU (45199 - 63128, n=24) | |
| MSI Raider 18 HX A14V | |
| Asus ROG Strix Scar 17 SE G733CX-LL014W | |
| Alienware x17 RTX 3080 P48E | |
| Asus ROG Strix G18 G814JI | |
| Schenker XMG Ultra 17 Comet Lake | |
| MSI Pulse GL76 12UGK | |
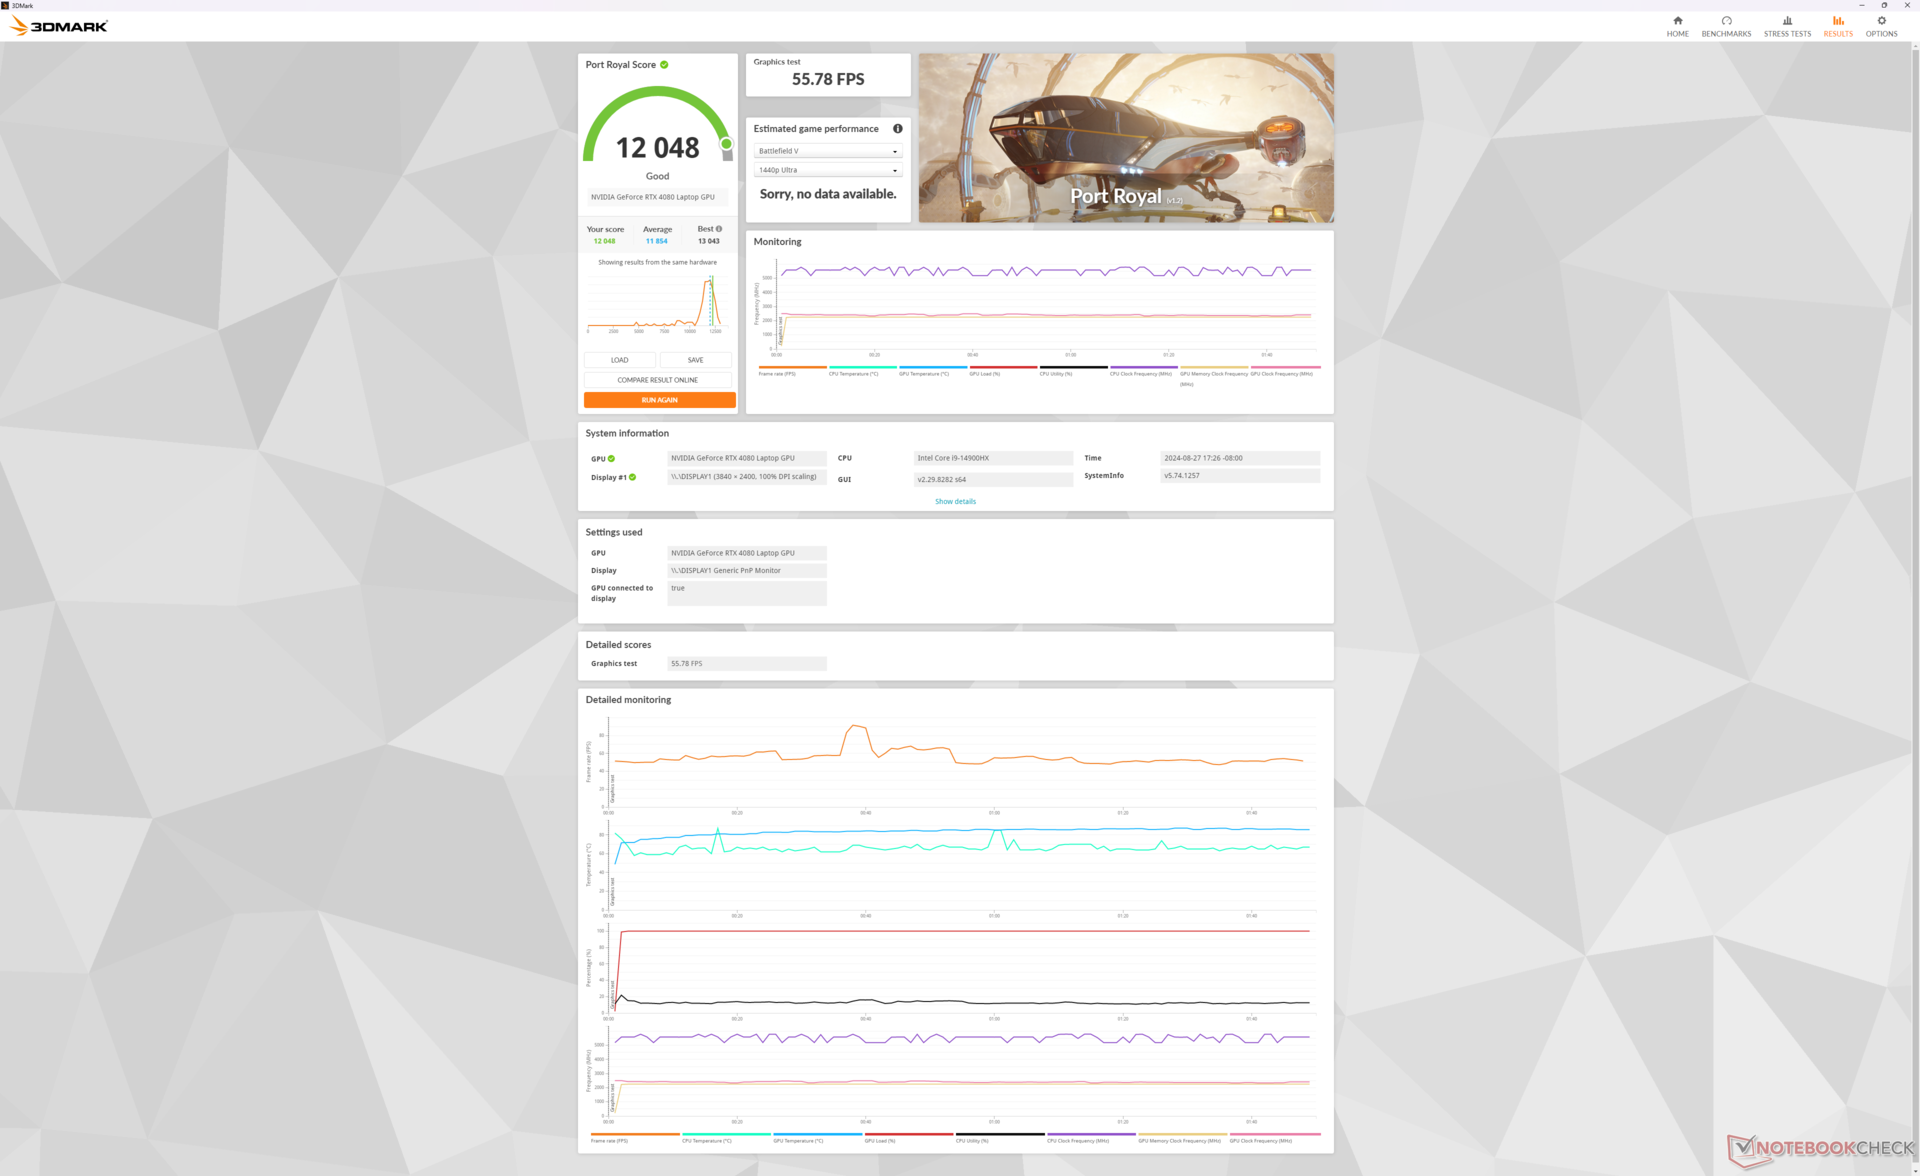
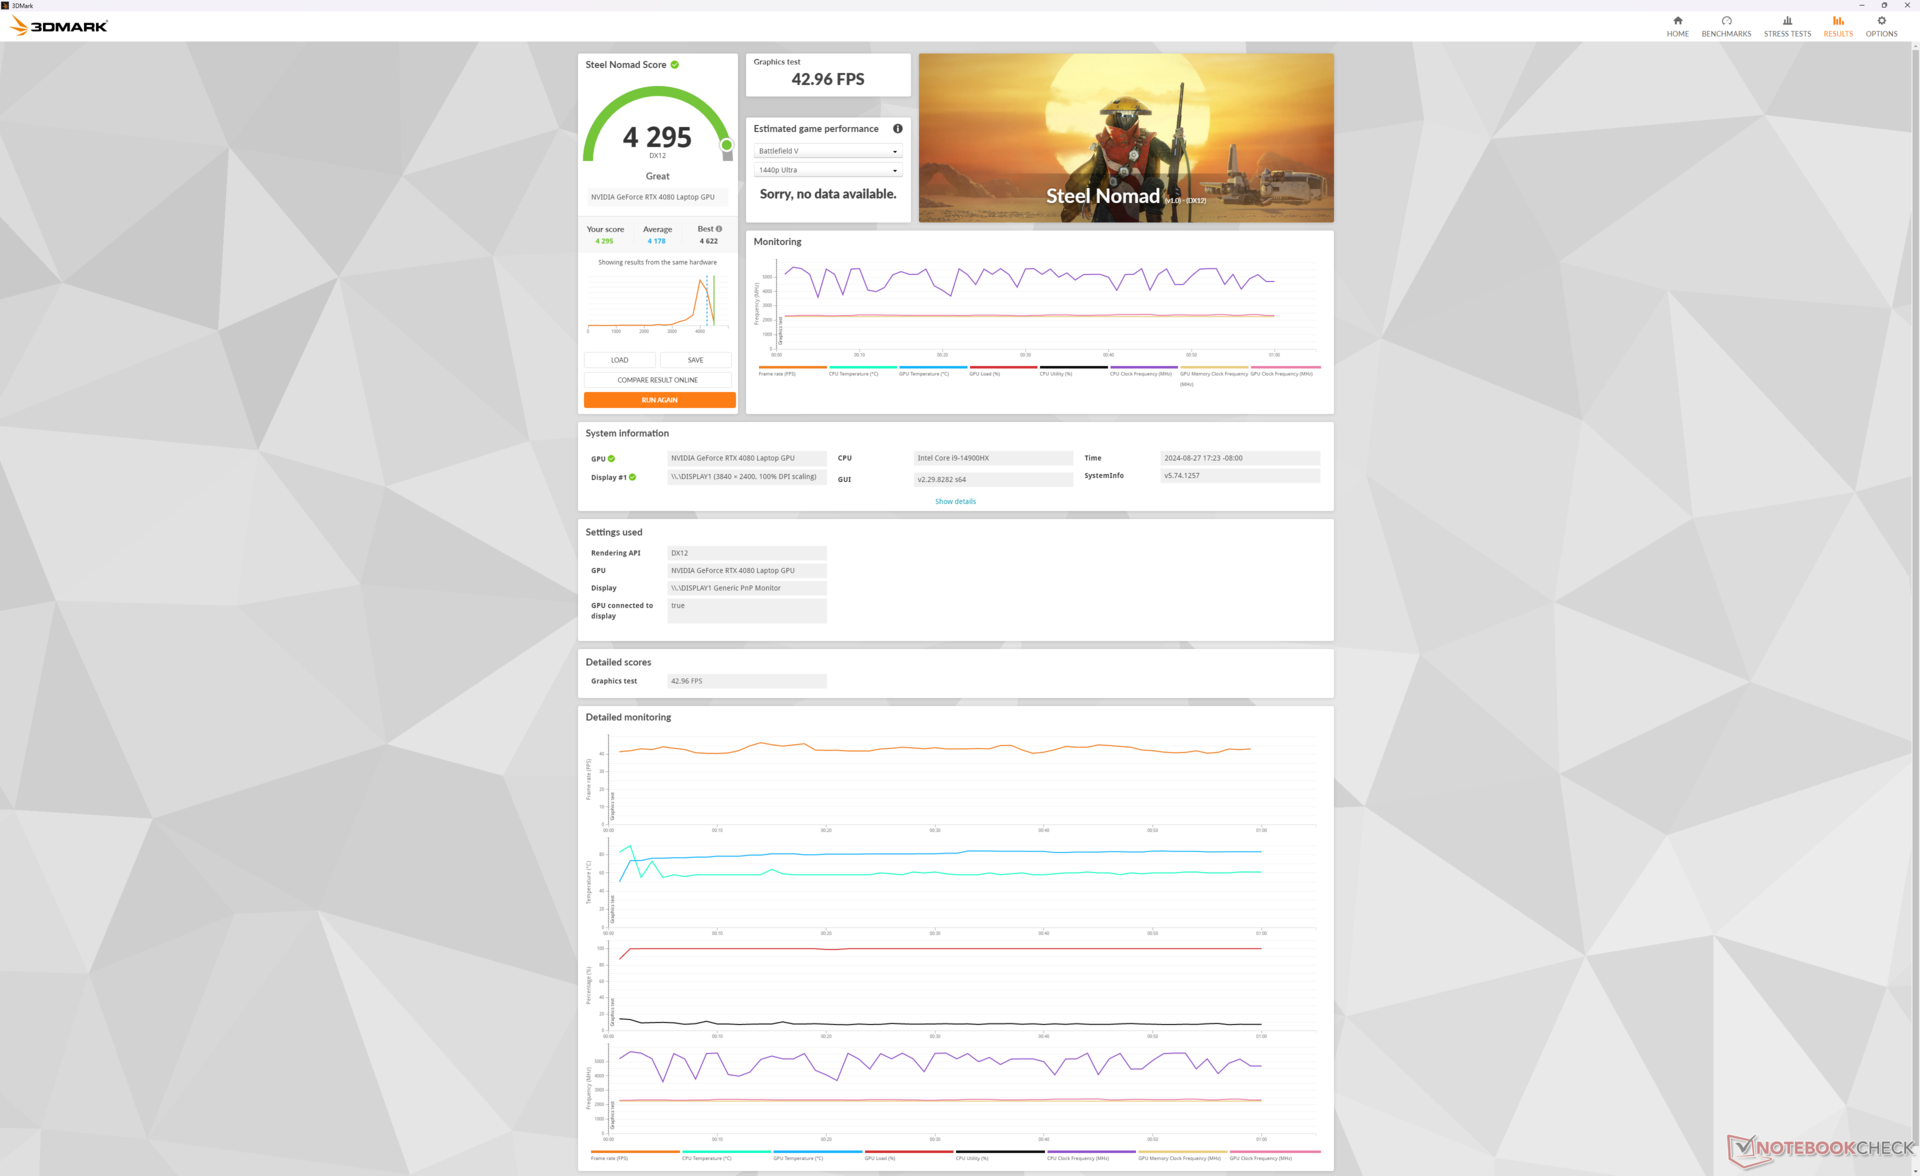
| 3DMark 11 Performance | 42822 pontok | |
| 3DMark Fire Strike Score | 33524 pontok | |
| 3DMark Time Spy Score | 18608 pontok | |
| 3DMark Steel Nomad Score | 4295 pontok | |
Segítség | ||
| Blender | |
| v3.3 Classroom OPTIX/RTX | |
| MSI Pulse GL76 12UGK | |
| Asus ROG Strix G18 G814JI | |
| Asus ROG Strix Scar 17 SE G733CX-LL014W | |
| Átlagos NVIDIA GeForce RTX 4080 Laptop GPU (13 - 20, n=22) | |
| Razer Blade 18 2024 RZ09-0509 | |
| MSI Raider 18 HX A14V | |
| Alienware m18 R2 | |
| NVIDIA GeForce RTX 4080 Founders Edition | |
| v3.3 Classroom CUDA | |
| MSI Pulse GL76 12UGK | |
| Asus ROG Strix G18 G814JI | |
| Asus ROG Strix Scar 17 SE G733CX-LL014W | |
| Átlagos NVIDIA GeForce RTX 4080 Laptop GPU (21 - 28, n=23) | |
| MSI Raider 18 HX A14V | |
| Razer Blade 18 2024 RZ09-0509 | |
| Alienware m18 R2 | |
| v3.3 Classroom CPU | |
| MSI Pulse GL76 12UGK | |
| Asus ROG Strix Scar 17 SE G733CX-LL014W | |
| Asus ROG Strix G18 G814JI | |
| Átlagos NVIDIA GeForce RTX 4080 Laptop GPU (177 - 337, n=23) | |
| Razer Blade 18 2024 RZ09-0509 | |
| MSI Raider 18 HX A14V | |
| Alienware m18 R2 | |
| Alienware m18 R1 AMD | |
| NVIDIA GeForce RTX 4080 Founders Edition | |
* ... a kisebb jobb
Játékteljesítmény
A modern címek a natív 4K UHD+ felbontáson is tisztességesen futnak. Az igényesebb címek, például a Cyberpunk 2077 futtatásakor a DLSS ajánlott, hogy a képkockasebességet 60 FPS-hez közelebb emelje.
Furcsa módon a Baldur's Gate 3 még többszöri rendszer-visszaállítás után sem indult el készülékünkön DX11 vagy DX12 módban.
| Performance rating - Percent | |
| Alienware m18 R2 | |
| MSI Titan 18 HX A14VIG | |
| MSI Raider 18 HX A14V | |
| Razer Blade 18 2024 RZ09-0509 -1! | |
| Acer Predator Helios 18 PH18-72-98MW | |
| Asus ROG Strix G18 G814JI | |
| GTA V - 1920x1080 Highest AA:4xMSAA + FX AF:16x | |
| MSI Raider 18 HX A14V | |
| MSI Titan 18 HX A14VIG | |
| Alienware m18 R2 | |
| Acer Predator Helios 18 PH18-72-98MW | |
| Razer Blade 18 2024 RZ09-0509 | |
| Asus ROG Strix G18 G814JI | |
| Final Fantasy XV Benchmark - 1920x1080 High Quality | |
| Alienware m18 R2 | |
| MSI Titan 18 HX A14VIG | |
| MSI Raider 18 HX A14V | |
| Acer Predator Helios 18 PH18-72-98MW | |
| Razer Blade 18 2024 RZ09-0509 | |
| Asus ROG Strix G18 G814JI | |
| Strange Brigade - 1920x1080 ultra AA:ultra AF:16 | |
| MSI Titan 18 HX A14VIG | |
| Alienware m18 R2 | |
| MSI Raider 18 HX A14V | |
| Razer Blade 18 2024 RZ09-0509 | |
| Acer Predator Helios 18 PH18-72-98MW | |
| Asus ROG Strix G18 G814JI | |
| Dota 2 Reborn - 1920x1080 ultra (3/3) best looking | |
| Acer Predator Helios 18 PH18-72-98MW | |
| MSI Titan 18 HX A14VIG | |
| MSI Raider 18 HX A14V | |
| Alienware m18 R2 | |
| Razer Blade 18 2024 RZ09-0509 | |
| Asus ROG Strix G18 G814JI | |
| X-Plane 11.11 - 1920x1080 high (fps_test=3) | |
| MSI Raider 18 HX A14V | |
| Alienware m18 R2 | |
| Razer Blade 18 2024 RZ09-0509 | |
| MSI Titan 18 HX A14VIG | |
| Acer Predator Helios 18 PH18-72-98MW | |
| Asus ROG Strix G18 G814JI | |
| Far Cry 5 - 1920x1080 Ultra Preset AA:T | |
| Alienware m18 R2 | |
| MSI Titan 18 HX A14VIG | |
| MSI Raider 18 HX A14V | |
| Asus ROG Strix G18 G814JI | |
| Acer Predator Helios 18 PH18-72-98MW | |
| Tiny Tina's Wonderlands | |
| 1920x1080 High Preset (DX12) | |
| Alienware m18 R2 | |
| MSI Raider 18 HX A14V | |
| Átlagos NVIDIA GeForce RTX 4080 Laptop GPU (166.7 - 213, n=6) | |
| 1920x1080 Badass Preset (DX12) | |
| Alienware m18 R2 | |
| MSI Raider 18 HX A14V | |
| Alienware m18 R1 AMD | |
| Átlagos NVIDIA GeForce RTX 4080 Laptop GPU (112.9 - 167.1, n=9) | |
| 2560x1440 Badass Preset (DX12) | |
| Alienware m18 R2 | |
| MSI Raider 18 HX A14V | |
| Alienware m18 R1 AMD | |
| Átlagos NVIDIA GeForce RTX 4080 Laptop GPU (85 - 114.8, n=9) | |
| 3840x2160 Badass Preset (DX12) | |
| Alienware m18 R2 | |
| MSI Raider 18 HX A14V | |
| Alienware m18 R1 AMD | |
| Átlagos NVIDIA GeForce RTX 4080 Laptop GPU (46.4 - 60.9, n=9) | |
| Final Fantasy XV Benchmark | |
| 1920x1080 High Quality | |
| NVIDIA GeForce RTX 4080 Founders Edition | |
| Alienware m18 R2 | |
| MSI Raider 18 HX A14V | |
| Zotac Gaming GeForce RTX 4070 AMP Airo | |
| Átlagos NVIDIA GeForce RTX 4080 Laptop GPU (129 - 182.1, n=23) | |
| Razer Blade 18 2024 RZ09-0509 | |
| Alienware m18 R1 AMD | |
| Asus ROG Strix Scar 17 SE G733CX-LL014W | |
| Asus ROG Strix G18 G814JI | |
| Alienware x17 RTX 3080 P48E | |
| MSI Pulse GL76 12UGK | |
| 2560x1440 High Quality | |
| NVIDIA GeForce RTX 4080 Founders Edition | |
| Alienware m18 R2 | |
| MSI Raider 18 HX A14V | |
| Razer Blade 18 2024 RZ09-0509 | |
| Zotac Gaming GeForce RTX 4070 AMP Airo | |
| Átlagos NVIDIA GeForce RTX 4080 Laptop GPU (98 - 142, n=22) | |
| Alienware m18 R1 AMD | |
| Asus ROG Strix Scar 17 SE G733CX-LL014W | |
| Alienware x17 RTX 3080 P48E | |
| 3840x2160 High Quality | |
| NVIDIA GeForce RTX 4080 Founders Edition | |
| Alienware m18 R2 | |
| Razer Blade 18 2024 RZ09-0509 | |
| MSI Raider 18 HX A14V | |
| Zotac Gaming GeForce RTX 4070 AMP Airo | |
| Átlagos NVIDIA GeForce RTX 4080 Laptop GPU (60.8 - 79.5, n=13) | |
| Alienware m18 R1 AMD | |
| Alienware x17 RTX 3080 P48E | |
| Far Cry 5 | |
| 1920x1080 Ultra Preset AA:T | |
| NVIDIA GeForce RTX 4080 Founders Edition | |
| Alienware m18 R2 | |
| MSI Raider 18 HX A14V | |
| Átlagos NVIDIA GeForce RTX 4080 Laptop GPU (114 - 162, n=11) | |
| Asus ROG Strix G18 G814JI | |
| Alienware m18 R1 AMD | |
| Alienware x17 RTX 3080 P48E | |
| 2560x1440 Ultra Preset AA:T | |
| NVIDIA GeForce RTX 4080 Founders Edition | |
| Alienware m18 R2 | |
| MSI Raider 18 HX A14V | |
| Átlagos NVIDIA GeForce RTX 4080 Laptop GPU (114 - 157, n=10) | |
| Alienware m18 R1 AMD | |
| Alienware x17 RTX 3080 P48E | |
| 3840x2160 Ultra Preset AA:T | |
| NVIDIA GeForce RTX 4080 Founders Edition | |
| Alienware m18 R2 | |
| Alienware m18 R1 AMD | |
| MSI Raider 18 HX A14V | |
| Átlagos NVIDIA GeForce RTX 4080 Laptop GPU (71 - 97, n=6) | |
| Alienware x17 RTX 3080 P48E | |
Cyberpunk 2077 ultra FPS Chart
| alacsony | közepes | magas | ultra | QHD | 4K | |
|---|---|---|---|---|---|---|
| GTA V (2015) | 185.1 | 183.8 | 181.6 | 143.4 | 134.6 | 158.3 |
| Dota 2 Reborn (2015) | 218 | 193.1 | 184.6 | 172.5 | 166.4 | |
| Final Fantasy XV Benchmark (2018) | 223 | 212 | 177 | 141.8 | 78.6 | |
| X-Plane 11.11 (2018) | 199 | 178.5 | 143.5 | 119.3 | ||
| Far Cry 5 (2018) | 173 | 163 | 151 | 149 | 96 | |
| Strange Brigade (2018) | 504 | 408 | 378 | 349 | 246 | 122.6 |
| Tiny Tina's Wonderlands (2022) | 352.5 | 292.6 | 203.3 | 159.4 | 111.2 | 60.9 |
| F1 22 (2022) | 305 | 299 | 271 | 121.2 | 77.8 | 39.8 |
| Cyberpunk 2077 (2023) | 150.6 | 150 | 140.7 | 125.5 | 82.5 | 35.1 |
Kibocsátás - Csendes üresjáratban, hangos játék közben
Rendszerzaj
A ventilátor zaja és viselkedése hasonló a Titan 18 HX a hűtési megoldások különbségei ellenére. A ventilátorok hajlamosak pulzálni még webböngészés közben is Kiegyensúlyozott módban vagy Csendes módban, hasonlóan a Titanhoz, de a zajnövekedés szerencsére nem elég éles ahhoz, hogy zavaró legyen.
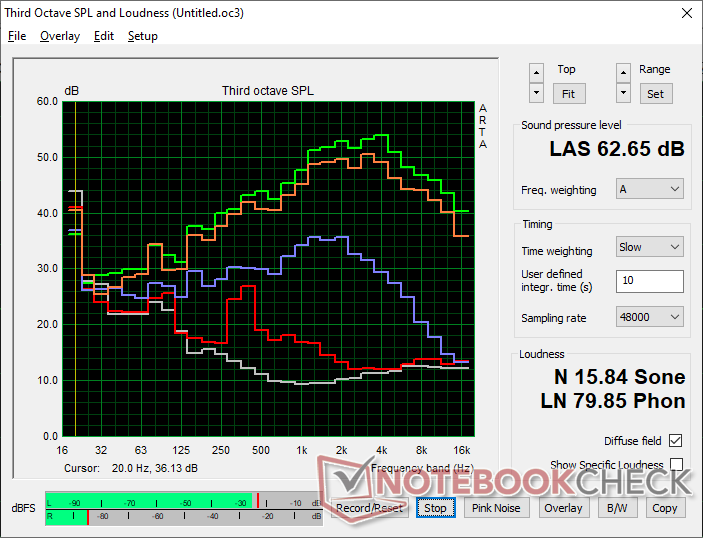
Az MSI Center közvetlenül befolyásolja a játékélményt, mivel a ventilátorok zaja szorosan kapcsolódik a kiválasztott teljesítményprofilhoz. A Cyberpunk 2077 futtatása Kiegyensúlyozott módban, Extrém teljesítmény módban kikapcsolt Cooler Boosttal és Extrém teljesítmény módban bekapcsolt Cooler Boosttal stabilan 52,8 dB(A), 59,4 dB(A), illetve 62,7 dB(A) ventilátorzajt eredményez. A Kiegyensúlyozott és az Extrém teljesítmény üzemmódok közötti zajkülönbség jelentős, még akkor is, ha a köztük lévő teljesítménybeli lemaradás kicsi, ami azt jelenti, hogy a Kiegyensúlyozott üzemmód a legtöbb játékforgatókönyvhöz ajánlott. A Cooler Boost tehát leginkább a kézi túlhajtásnál hasznos, mivel egyébként nem nyújt jelentős játékbeli előnyöket a stock beállítások mellett.
Az alacsony és közepes 50 dB(A) tartomány játék közben leginkább a Blade 18 vagy a Alienware m18 R2. A fejhallgató különösen akkor ajánlott, ha Extreme Performance módban játszunk.
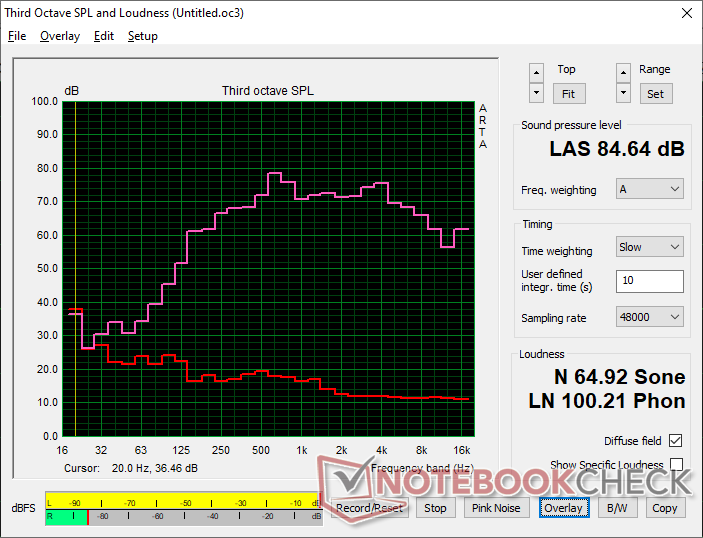
Zajszint
| Üresjárat |
| 28.6 / 28.6 / 31.3 dB(A) |
| Terhelés |
| 44.1 / 62.7 dB(A) |
 | ||
30 dB csendes 40 dB(A) hallható 50 dB(A) hangos |
||
min: | ||
| MSI Raider 18 HX A14V GeForce RTX 4080 Laptop GPU, i9-14900HX, Samsung PM9A1 MZVL22T0HBLB | Razer Blade 18 2024 RZ09-0509 GeForce RTX 4090 Laptop GPU, i9-14900HX | Alienware m18 R2 GeForce RTX 4090 Laptop GPU, i9-14900HX, SK Hynix PC811 HFS002TEM9X152N | MSI Titan 18 HX A14VIG GeForce RTX 4090 Laptop GPU, i9-14900HX, 2x Samsung PM9A1a MZVL22T0HDLB (RAID 0) | Asus ROG Strix G18 G814JI GeForce RTX 4070 Laptop GPU, i7-13650HX, Micron 2400 MTFDKBA1T0QFM | Acer Predator Helios 18 PH18-72-98MW GeForce RTX 4090 Laptop GPU, i9-14900HX, 2x SK Hynix HFS001TEJ9X115N (RAID 0) | |
|---|---|---|---|---|---|---|
| Noise | 7% | 11% | 10% | 8% | -12% | |
| off / környezet * (dB) | 23.3 | 23.4 -0% | 23.6 -1% | 22.8 2% | 25 -7% | 25 -7% |
| Idle Minimum * (dB) | 28.6 | 23.9 16% | 23.8 17% | 23.8 17% | 26 9% | 30 -5% |
| Idle Average * (dB) | 28.6 | 28.2 1% | 26.1 9% | 23.8 17% | 28 2% | 36 -26% |
| Idle Maximum * (dB) | 31.3 | 29 7% | 31.5 -1% | 28 11% | 29 7% | 44 -41% |
| Load Average * (dB) | 44.1 | 36.8 17% | 31.5 29% | 38 14% | 41 7% | 48 -9% |
| Cyberpunk 2077 ultra * (dB) | 59.4 | |||||
| Load Maximum * (dB) | 62.7 | 61.1 3% | 56.6 10% | 62.8 -0% | 46 27% | 51 19% |
| Witcher 3 ultra * (dB) | 54.1 | 52.1 | 57.3 | 44 | 49 |
* ... a kisebb jobb
Hőmérséklet
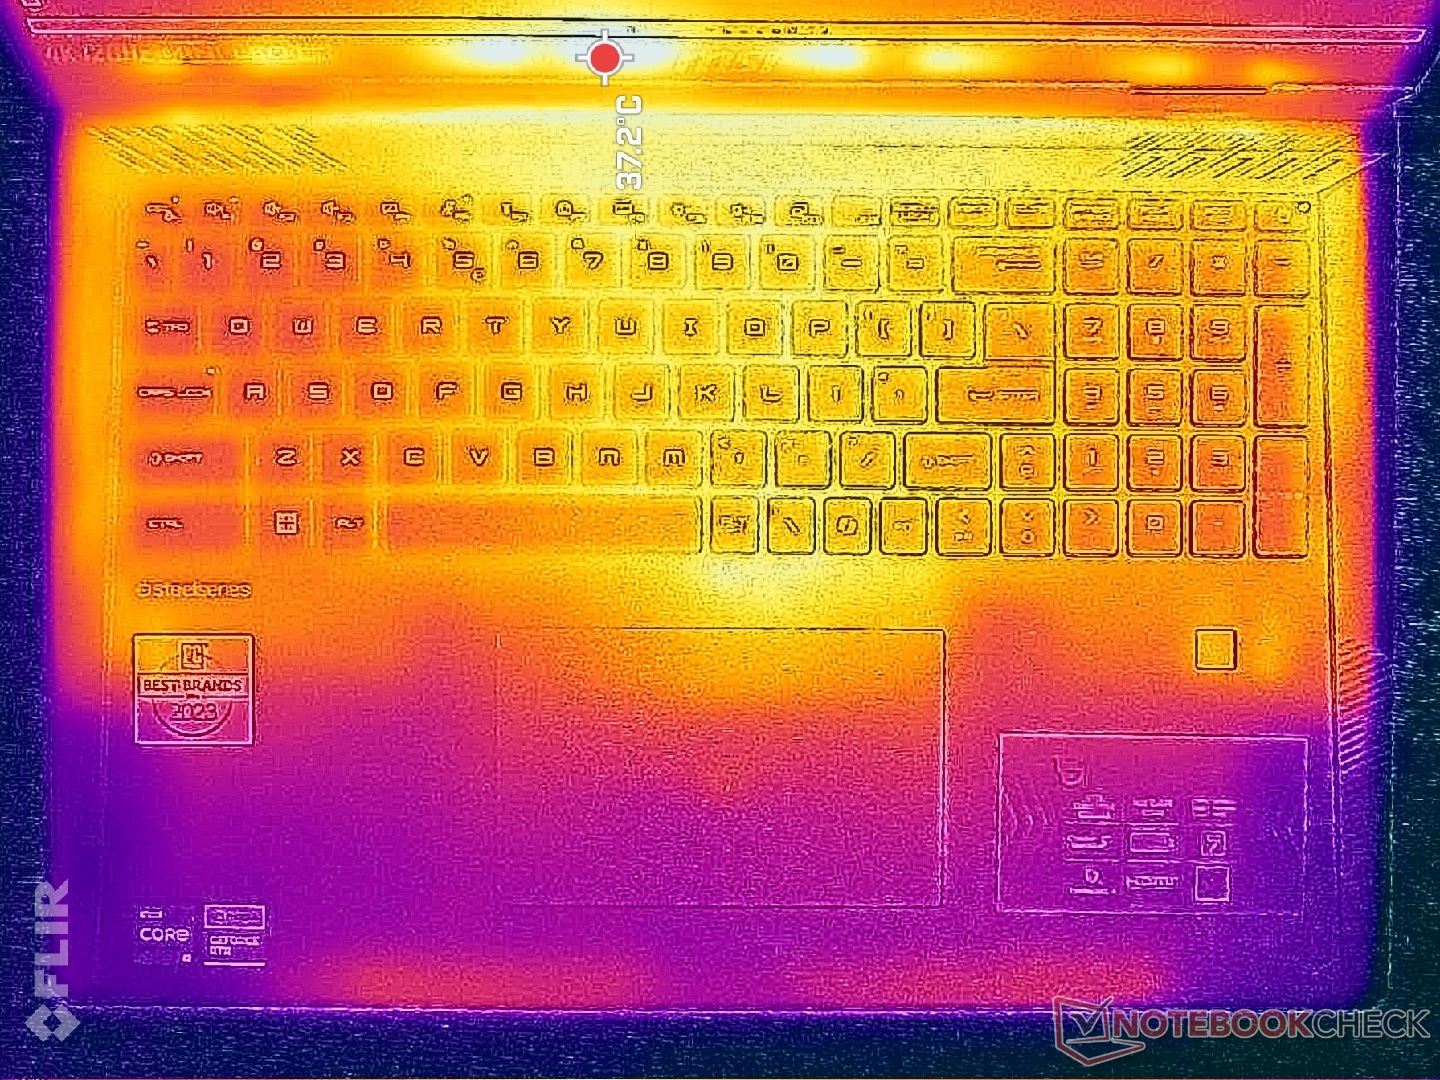
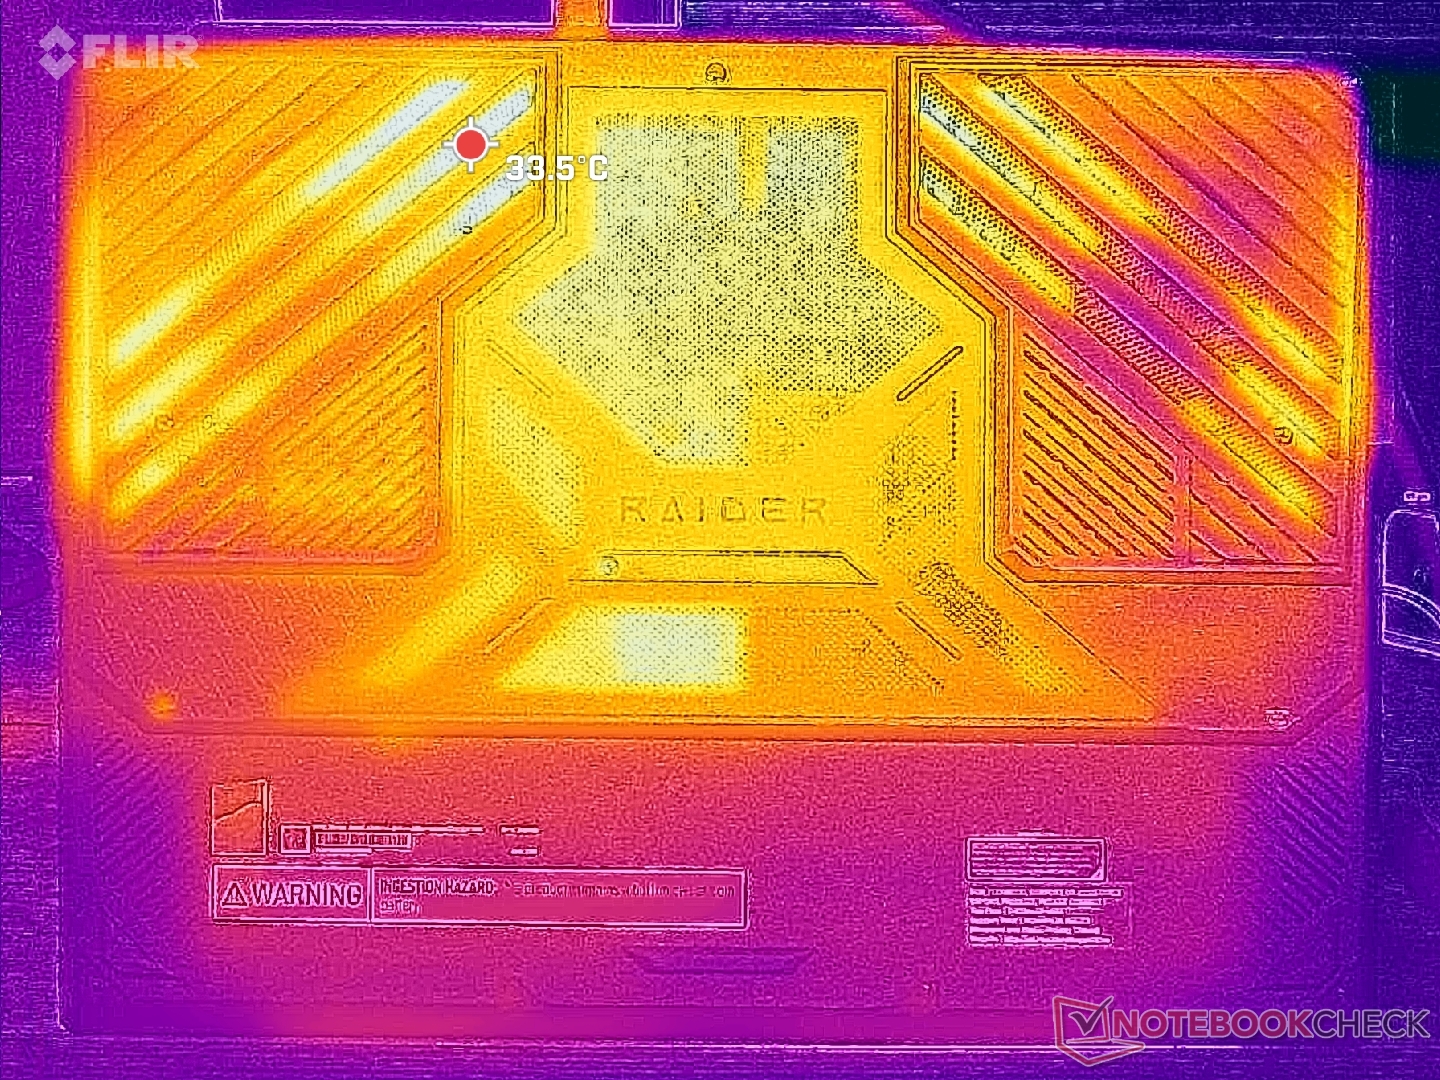
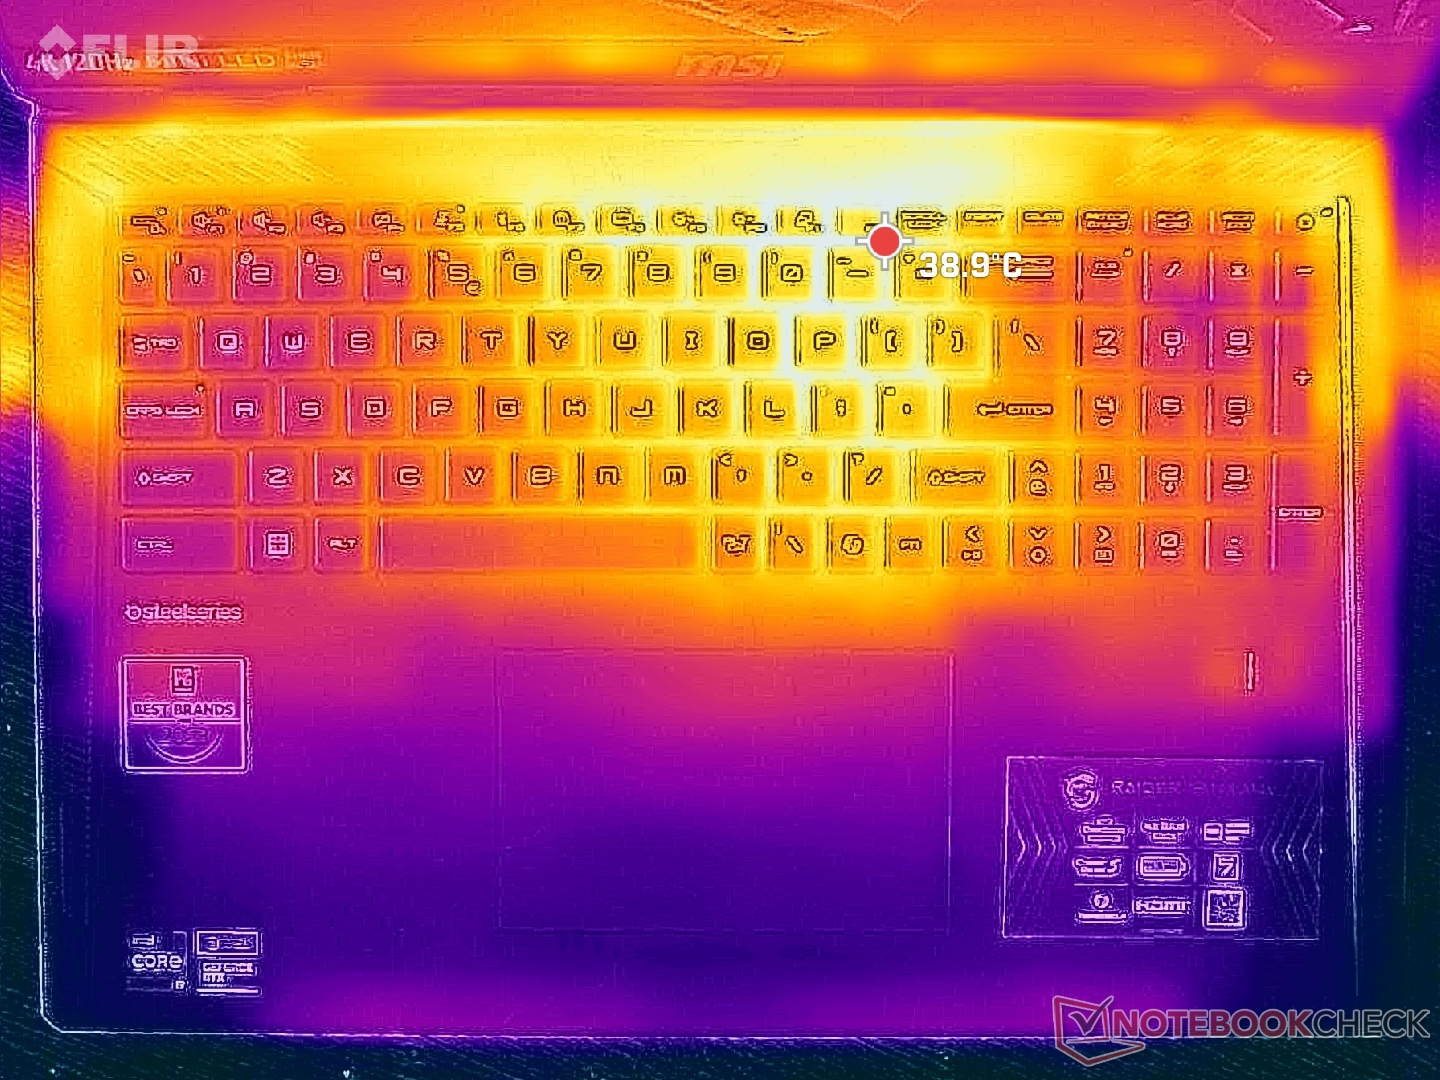
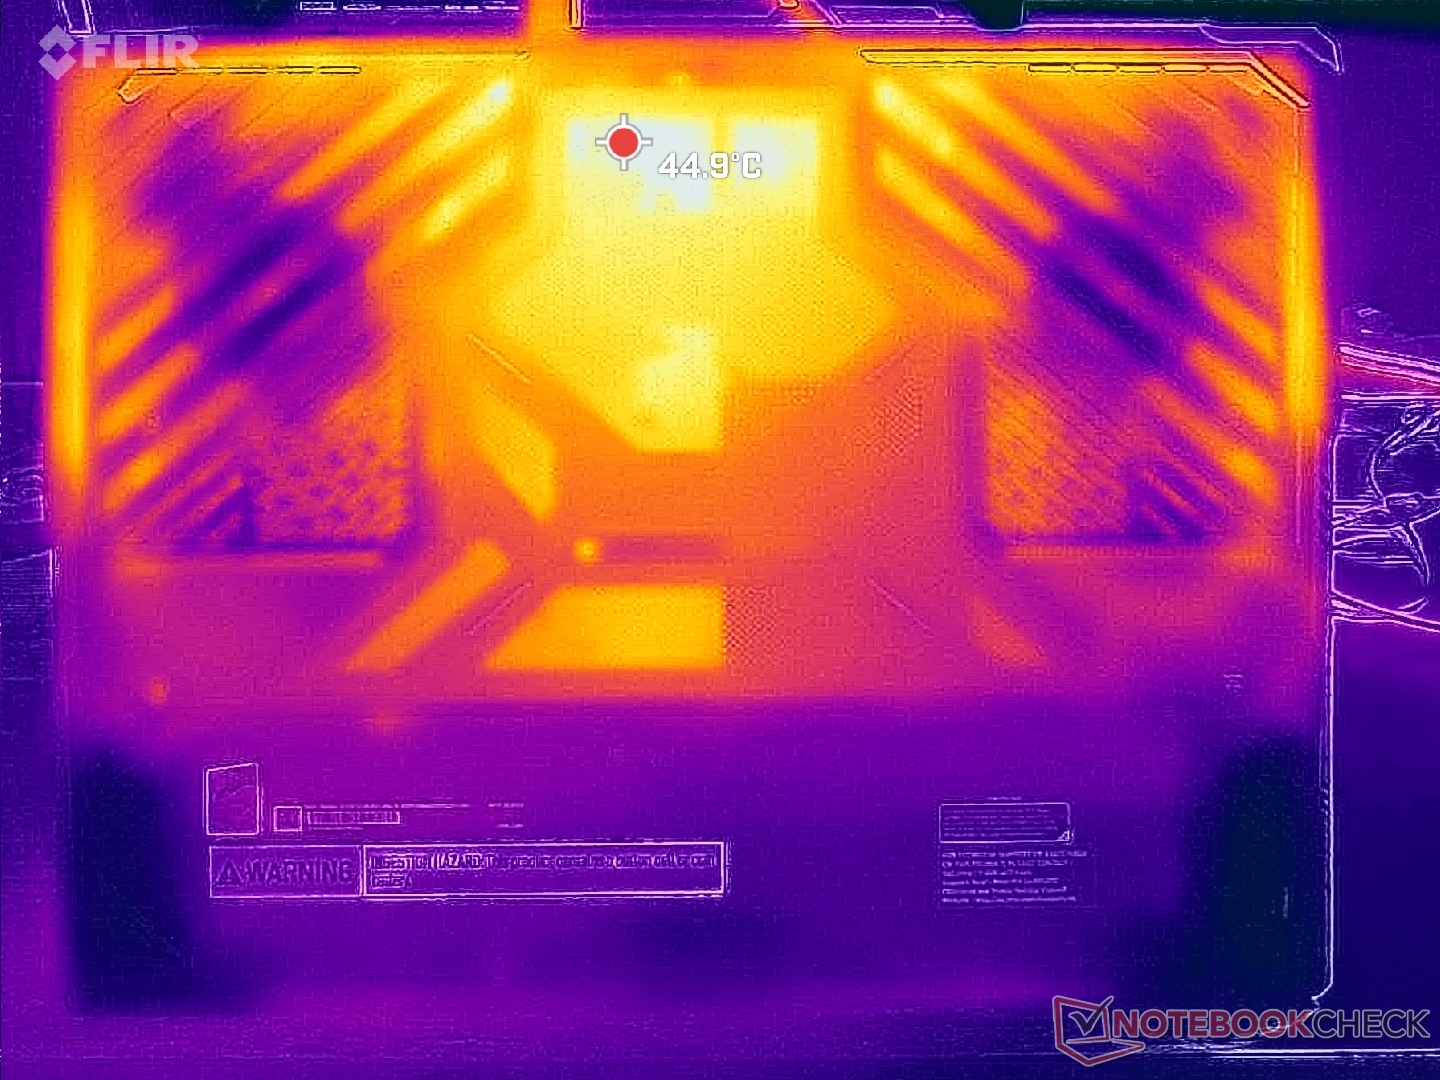
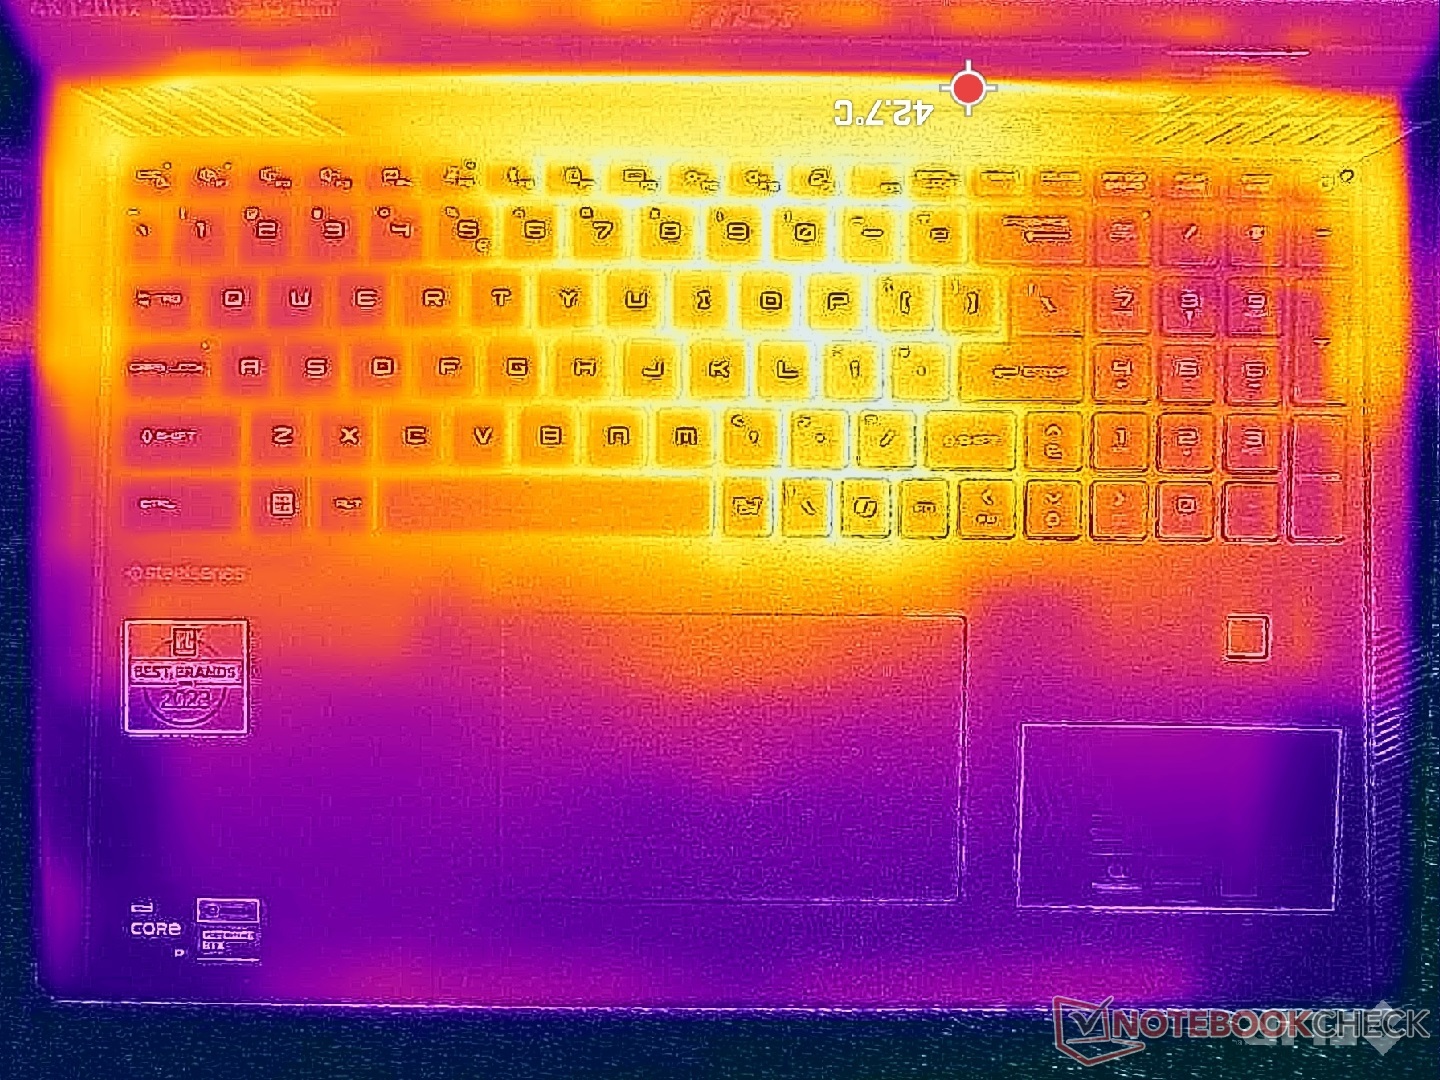
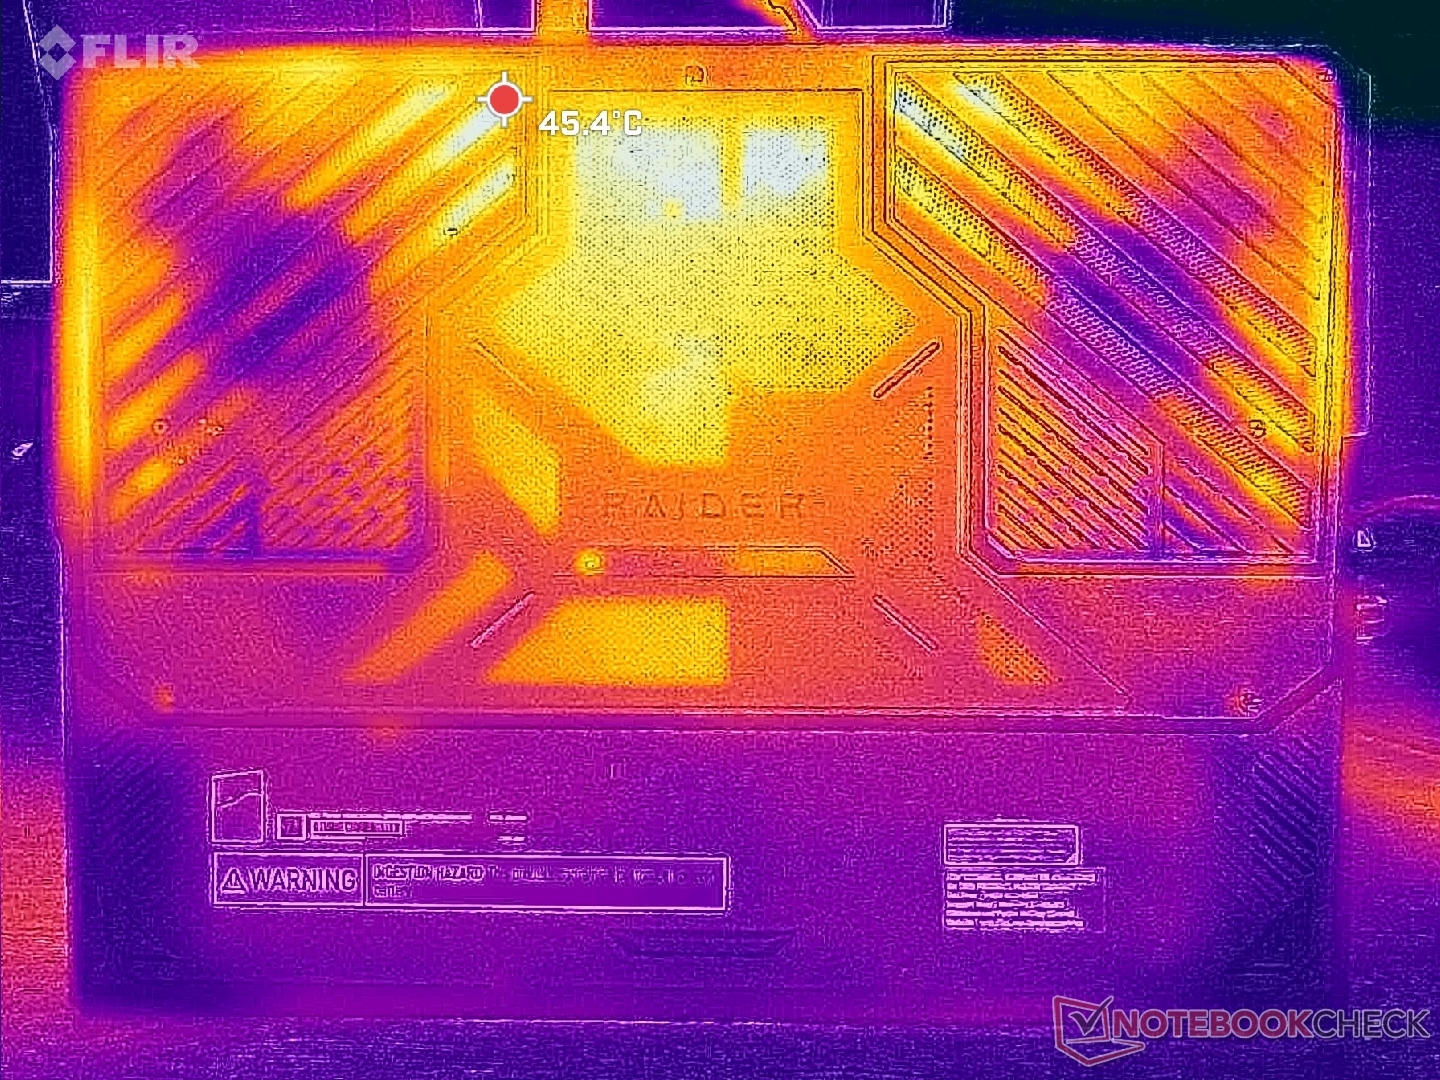
A forró pontok játék közben a Titan 18 HX-hez hasonlóan elérhetik a 40 °C-ot. A forróbb területek a billentyűzet közepe felé vannak, így a WASD billentyűk, a numpad és a tenyértámaszok sokkal hűvösebbek és kényelmesebbek a bőr számára.
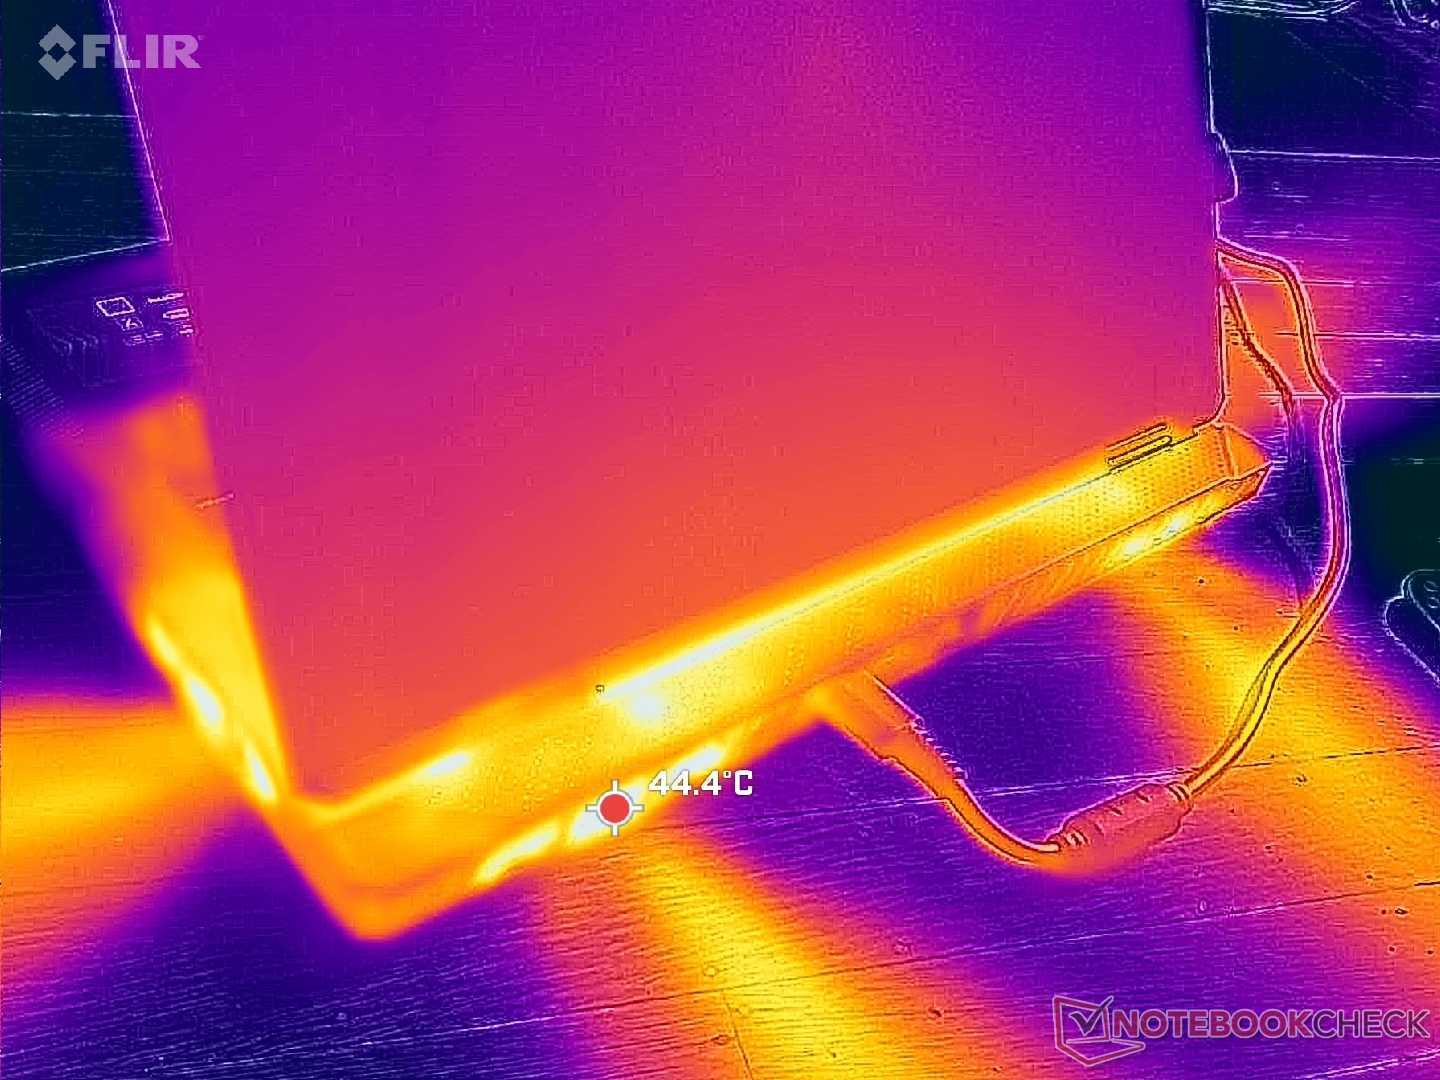
(±) A felső oldalon a maximális hőmérséklet 40.8 °C / 105 F, összehasonlítva a 40.4 °C / 105 F átlagával , 21.2 és 68.8 °C között a Gaming osztálynál.
(±) Az alsó maximum 43.4 °C / 110 F-ig melegszik fel, összehasonlítva a 43.3 °C / 110 F átlagával
(±) Üresjáratban a felső oldal átlagos hőmérséklete 33.7 °C / 93 F, összehasonlítva a 33.9 °C / ### eszközátlaggal class_avg_f### F.
(±) 3: The average temperature for the upper side is 34.4 °C / 94 F, compared to the average of 33.9 °C / 93 F for the class Gaming.
(+) A csuklótámasz és az érintőpad eléri a bőr maximális hőmérsékletét (32.6 °C / 90.7 F), ezért nem forrók.
(-) A hasonló eszközök csuklótámasz területének átlagos hőmérséklete 28.8 °C / 83.8 F volt (-3.8 °C / -6.9 F).
| MSI Raider 18 HX A14V Intel Core i9-14900HX, NVIDIA GeForce RTX 4080 Laptop GPU | Razer Blade 18 2024 RZ09-0509 Intel Core i9-14900HX, NVIDIA GeForce RTX 4090 Laptop GPU | Alienware m18 R2 Intel Core i9-14900HX, NVIDIA GeForce RTX 4090 Laptop GPU | MSI Titan 18 HX A14VIG Intel Core i9-14900HX, NVIDIA GeForce RTX 4090 Laptop GPU | Asus ROG Strix G18 G814JI Intel Core i7-13650HX, NVIDIA GeForce RTX 4070 Laptop GPU | Acer Predator Helios 18 PH18-72-98MW Intel Core i9-14900HX, NVIDIA GeForce RTX 4090 Laptop GPU | |
|---|---|---|---|---|---|---|
| Heat | -1% | -5% | 6% | 5% | -6% | |
| Maximum Upper Side * (°C) | 40.8 | 43.2 -6% | 41.2 -1% | 37.8 7% | 45 -10% | 43 -5% |
| Maximum Bottom * (°C) | 43.4 | 42.6 2% | 34.6 20% | 37.6 13% | 47 -8% | 59 -36% |
| Idle Upper Side * (°C) | 36.4 | 36 1% | 42.8 -18% | 34.8 4% | 28 23% | 32 12% |
| Idle Bottom * (°C) | 36.4 | 36.4 -0% | 43.6 -20% | 36 1% | 31 15% | 34 7% |
* ... a kisebb jobb
Hangszórók
MSI Raider 18 HX A14V hangelemzés
(+) | a hangszórók viszonylag hangosan tudnak játszani (84.6 dB)
Basszus 100 - 315 Hz
(±) | csökkentett basszus – átlagosan 9.2%-kal alacsonyabb, mint a medián
(±) | a basszus linearitása átlagos (9.2% delta az előző frekvenciához)
Közepes 400-2000 Hz
(+) | kiegyensúlyozott középpontok – csak 4.3% választja el a mediántól
(+) | a középpontok lineárisak (5.1% delta az előző frekvenciához)
Maximum 2-16 kHz
(+) | kiegyensúlyozott csúcsok – csak 3.8% választja el a mediántól
(+) | a csúcsok lineárisak (4.9% delta az előző frekvenciához képest)
Összességében 100 - 16.000 Hz
(+) | általános hangzás lineáris (11.9% eltérés a mediánhoz képest)
Ugyanazon osztályhoz képest
» 12%Ebben az osztályban az összes tesztelt eszköz %-a jobb volt, 4% hasonló, 85%-kal rosszabb
» A legjobb delta értéke 6%, az átlag 18%, a legrosszabb 132% volt
Az összes tesztelt eszközzel összehasonlítva
» 9% az összes tesztelt eszköz jobb volt, 2% hasonló, 89%-kal rosszabb
» A legjobb delta értéke 4%, az átlag 24%, a legrosszabb 134% volt
Apple MacBook Pro 16 2021 M1 Pro hangelemzés
(+) | a hangszórók viszonylag hangosan tudnak játszani (84.7 dB)
Basszus 100 - 315 Hz
(+) | jó basszus – csak 3.8% választja el a mediántól
(+) | a basszus lineáris (5.2% delta az előző frekvenciához)
Közepes 400-2000 Hz
(+) | kiegyensúlyozott középpontok – csak 1.3% választja el a mediántól
(+) | a középpontok lineárisak (2.1% delta az előző frekvenciához)
Maximum 2-16 kHz
(+) | kiegyensúlyozott csúcsok – csak 1.9% választja el a mediántól
(+) | a csúcsok lineárisak (2.7% delta az előző frekvenciához képest)
Összességében 100 - 16.000 Hz
(+) | általános hangzás lineáris (4.6% eltérés a mediánhoz képest)
Ugyanazon osztályhoz képest
» 0%Ebben az osztályban az összes tesztelt eszköz %-a jobb volt, 0% hasonló, 100%-kal rosszabb
» A legjobb delta értéke 5%, az átlag 17%, a legrosszabb 45% volt
Az összes tesztelt eszközzel összehasonlítva
» 0% az összes tesztelt eszköz jobb volt, 0% hasonló, 100%-kal rosszabb
» A legjobb delta értéke 4%, az átlag 24%, a legrosszabb 134% volt
Energiagazdálkodás
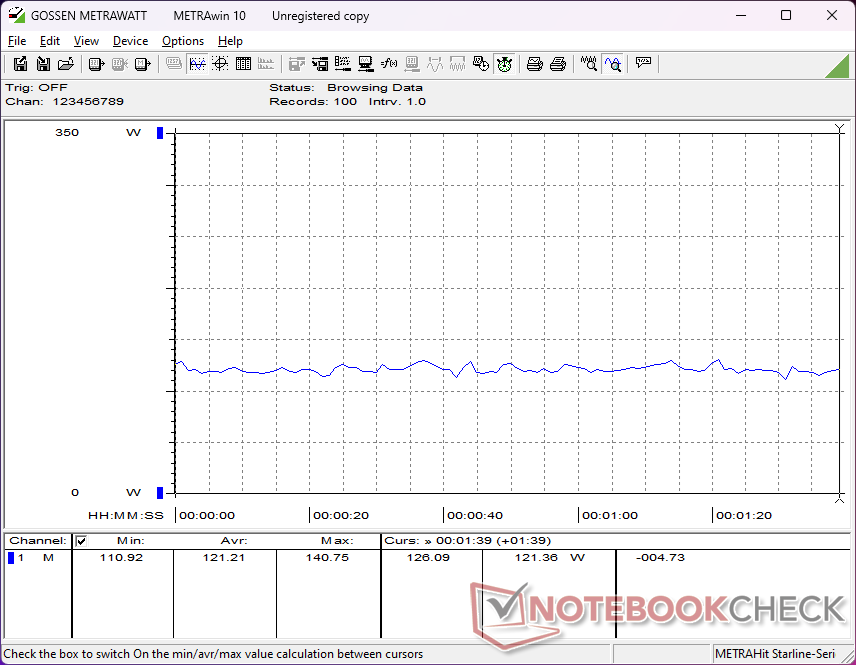
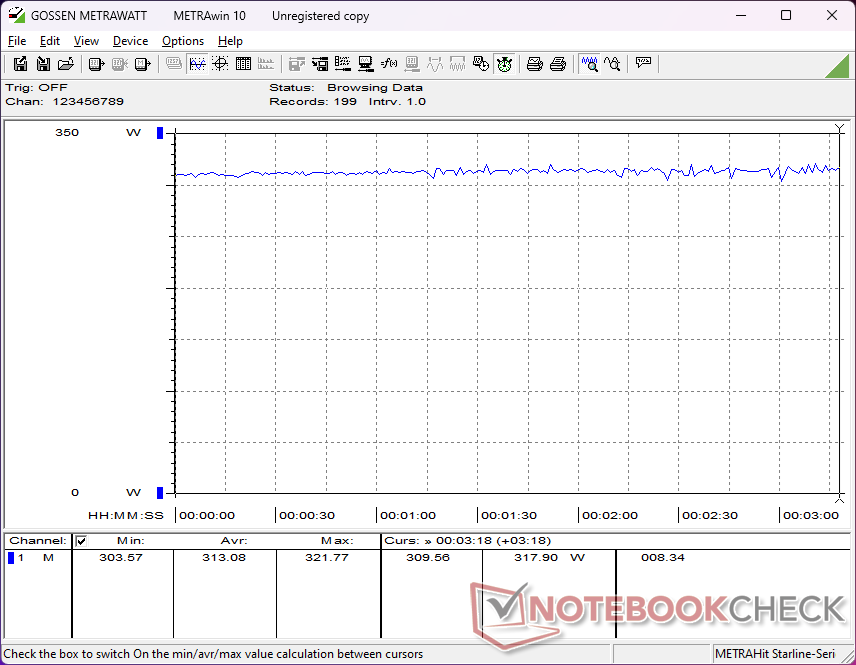
Energiafogyasztás
A teljes fogyasztás nagyon magas, ahogy az egy igényes 4K mini-LED panellel felszerelt 18 hüvelykes DTR-től elvárható. Az asztali gépen az üresjárat 27 W és 48 W között fogyaszt a fényerő beállításától, a GPU beállításától és az energiaprofil beállításától függően. A játékhoz valamivel több mint 300 W szükséges, míg a csak 220 W-ot igénylő Acer Predator Helios 18.
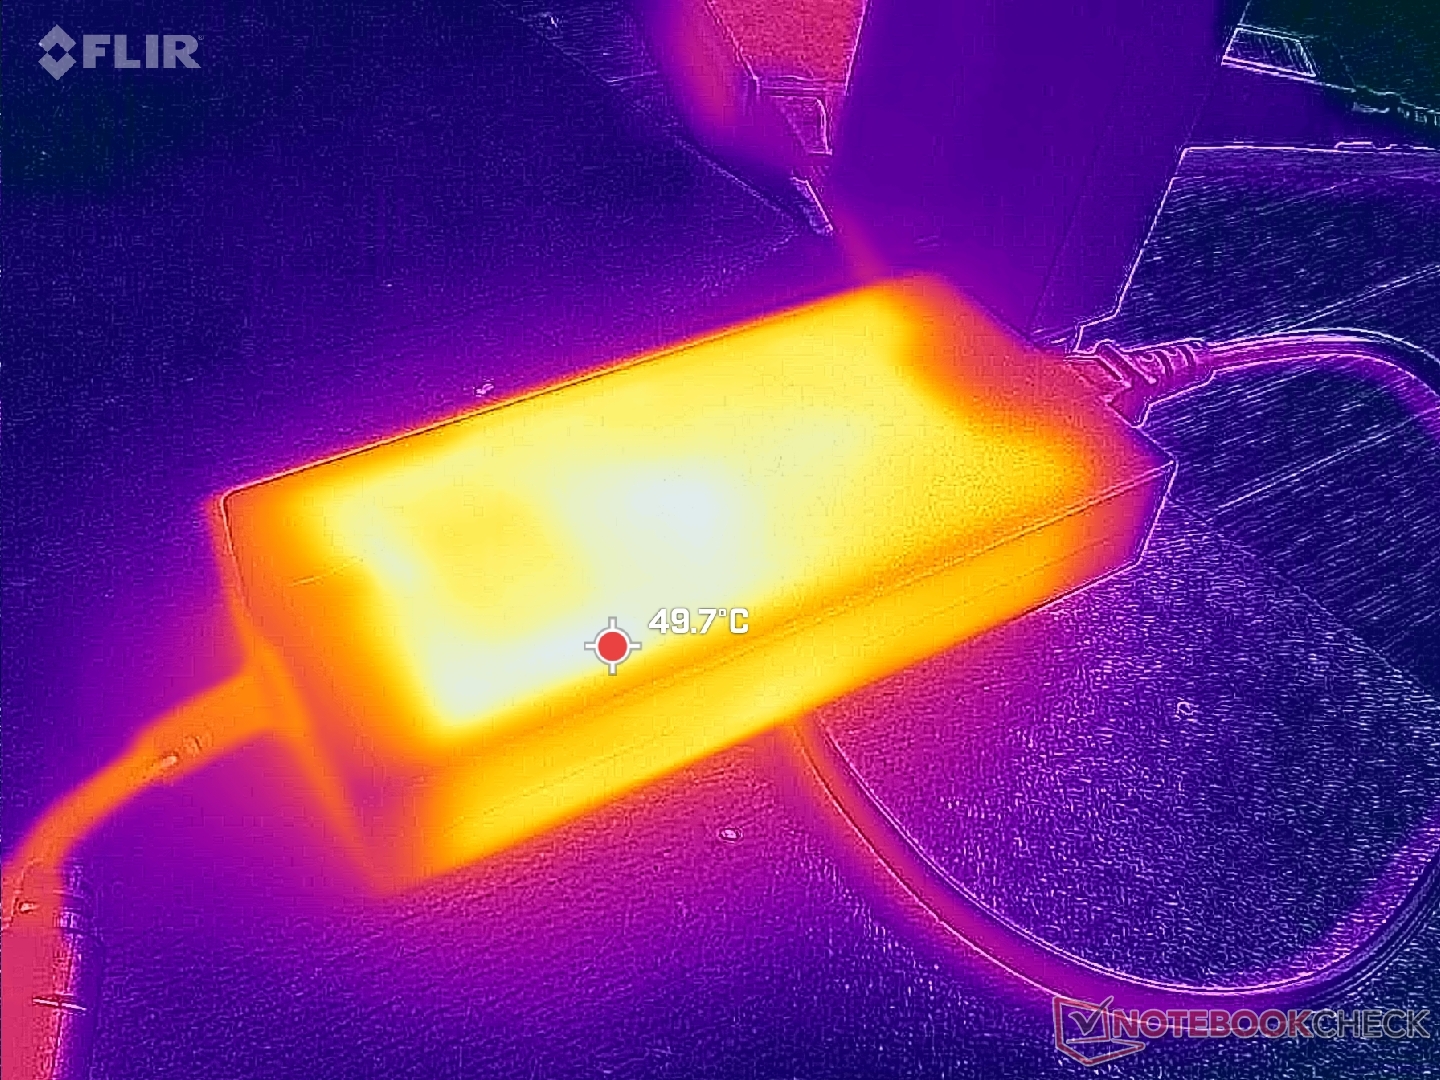
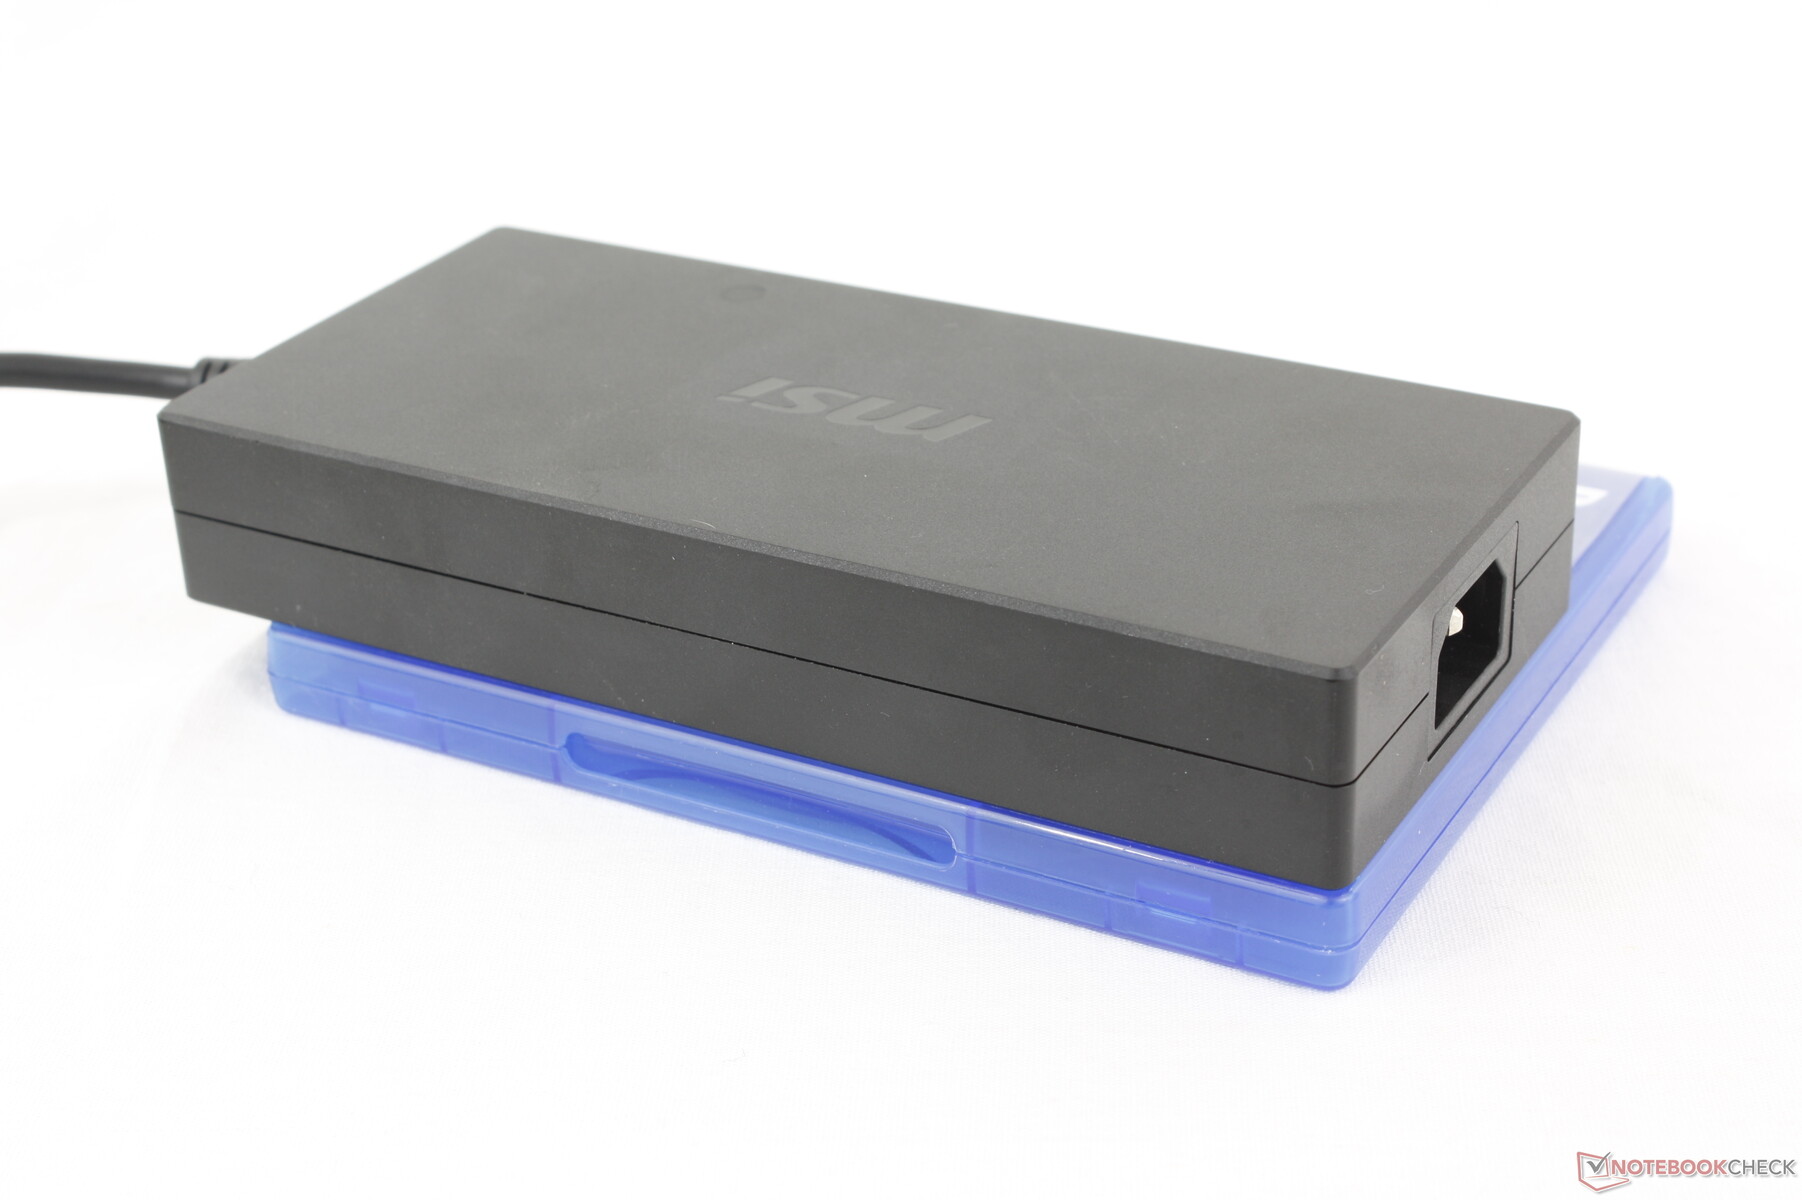
A nagyméretű, 330 W-os hálózati adapterrel akár 322 W-os fogyasztást is feljegyezhetünk. A Titan 18 HX 400 W-os hálózati adapteréhez képest a 330 W-os valamivel kisebb (~18,4 x 8,4 x 3,1 cm vs. ~18,8 x 8,8 x 3,2 cm). A CPU-intenzív feladatok futtatása során a fogyasztás általában alacsonyabb a Raider 18 HX esetében, annak ellenére, hogy ugyanazzal a CPU-val szállítják, mint a Titan 18 HX-et, ami összhangban van a fenti CineBench szakaszban rögzített, kissé lassabb CPU-teljesítménnyel.
| Kikapcsolt állapot / Készenlét | |
| Üresjárat | |
| Terhelés |
|
Kulcs:
min: | |
| MSI Raider 18 HX A14V i9-14900HX, GeForce RTX 4080 Laptop GPU, Samsung PM9A1 MZVL22T0HBLB, Mini-LED, 3840x2400, 18" | Razer Blade 18 2024 RZ09-0509 i9-14900HX, GeForce RTX 4090 Laptop GPU, , Mini-LED, 2560x1600, 18" | Alienware m18 R2 i9-14900HX, GeForce RTX 4090 Laptop GPU, SK Hynix PC811 HFS002TEM9X152N, IPS, 2560x1600, 18" | MSI Titan 18 HX A14VIG i9-14900HX, GeForce RTX 4090 Laptop GPU, 2x Samsung PM9A1a MZVL22T0HDLB (RAID 0), Mini-LED, 3840x2400, 18" | Asus ROG Strix G18 G814JI i7-13650HX, GeForce RTX 4070 Laptop GPU, Micron 2400 MTFDKBA1T0QFM, IPS, 2560x1600, 18" | Acer Predator Helios 18 PH18-72-98MW i9-14900HX, GeForce RTX 4090 Laptop GPU, 2x SK Hynix HFS001TEJ9X115N (RAID 0), Mini-LED, 2560x1600, 18" | |
|---|---|---|---|---|---|---|
| Power Consumption | -2% | 8% | 5% | 42% | -2% | |
| Idle Minimum * (Watt) | 27.7 | 25.4 8% | 10.6 62% | 13.2 52% | 8 71% | 31 -12% |
| Idle Average * (Watt) | 38.3 | 37.7 2% | 20.9 45% | 25.4 34% | 15 61% | 35 9% |
| Idle Maximum * (Watt) | 47.1 | 57.9 -23% | 40 15% | 53.5 -14% | 26 45% | 43 9% |
| Load Average * (Watt) | 121.2 | 128.4 -6% | 201.1 -66% | 151.4 -25% | 102 16% | 144 -19% |
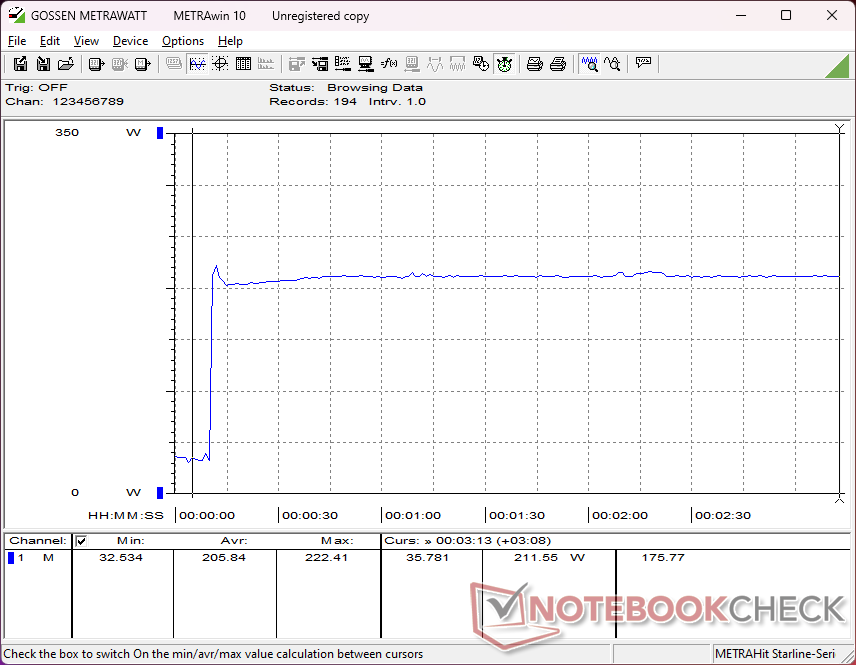
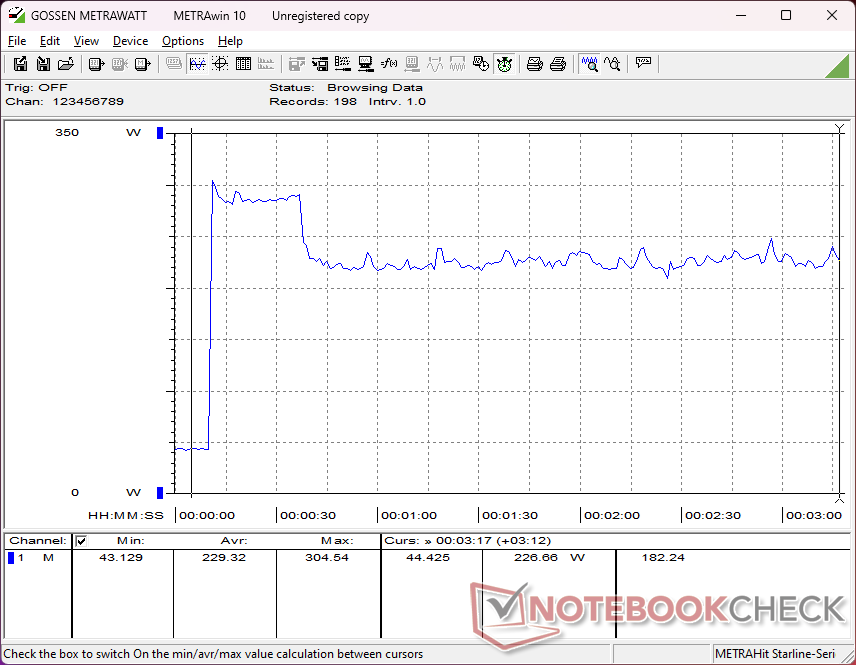
| Cyberpunk 2077 ultra * (Watt) | 313 | |||||
| Cyberpunk 2077 ultra external monitor * (Watt) | 306 | |||||
| Load Maximum * (Watt) | 321.8 | 297.9 7% | 378.9 -18% | 395.2 -23% | 267 17% | 318 1% |
| Witcher 3 ultra * (Watt) | 273.1 | 358 | 336 | 178.6 | 228 |
* ... a kisebb jobb
Power Consumption Cyberpunk / Stress Test
Power Consumption external Monitor
Az akkumulátor élettartama
A futási idők rövidek az igényes hardver miatt. Valós WLAN-használatot alig több mint 3 órán keresztül tudunk rögzíteni, még akkor is, ha akkumulátor-kímélő üzemmódban és iGPU módban vagyunk, míg a ROG Strix G18 iPS-kijelzőjével több mint kétszer ennyi ideig bírja. Az akkumulátor kapacitása már eléri a törvényes maximumot, 99,9 Wh-t.
A töltés üres állapotból a teljes kapacitásig majdnem 2,5 órát vesz igénybe, ami egy kicsit hosszabb, mint a legtöbb más laptopnál. A harmadik féltől származó USB-C hálózati adapterekkel történő töltés még lassabb lesz.
| MSI Raider 18 HX A14V i9-14900HX, GeForce RTX 4080 Laptop GPU, 99.9 Wh | Razer Blade 18 2024 RZ09-0509 i9-14900HX, GeForce RTX 4090 Laptop GPU, 91.7 Wh | Alienware m18 R2 i9-14900HX, GeForce RTX 4090 Laptop GPU, 97 Wh | MSI Titan 18 HX A14VIG i9-14900HX, GeForce RTX 4090 Laptop GPU, 99.9 Wh | Asus ROG Strix G18 G814JI i7-13650HX, GeForce RTX 4070 Laptop GPU, 90 Wh | Acer Predator Helios 18 PH18-72-98MW i9-14900HX, GeForce RTX 4090 Laptop GPU, 90 Wh | |
|---|---|---|---|---|---|---|
| Akkumulátor üzemidő | 20% | 45% | 18% | 101% | -9% | |
| Reader / Idle (h) | 4.4 | 6.6 50% | 5.9 34% | 11.7 166% | ||
| WiFi v1.3 (h) | 3.3 | 4.4 33% | 4.8 45% | 4.2 27% | 8.1 145% | 3.2 -3% |
| Load (h) | 1.3 | 1 -23% | 1.2 -8% | 1.2 -8% | 1.1 -15% |
Pro
Kontra
Ítélet - A Titan At Heart
Amikor áttekintettük a Titan 18 HX az év elején, dicsértük a teljesítményét, de megdöbbentünk, amikor megtudtuk, hogy több mint 5000 USD-t kérnek érte. Az a tény, hogy a CPU és a GPU gyakorlatilag semmi újdonságot nem tartalmazott, csak még kevésbé tette vonzóvá a modellt. A Raider 18 HX a Titan 18 HX túlságosan magas árát a zsír levágásával orvosolja, miközben megtartja ugyanazt a CPU-t, GPU-t és kijelzőt. A Raider-tulajdonosok lemondanak a háttérvilágítású kattintópadról, a gőzkamrás hűtésről, a mechanikus billentyűkről és a harmadlagos M.2 SSD-támogatásról, de az ilyen luxusfunkcióktól könnyű megválni, ha a játékélmény a Raider és a Titan között egyébként pontosan ugyanaz. Sőt, azt is állíthatjuk, hogy a Raider használata kényelmesebb, mivel a hagyományos clickpad és a membránalapú billentyűzet sokkal ismerősebbnek tűnik, mint a Titan atipikus megközelítése.
A Raider 18 HX a Core i9 CPU-ból és a 175 W-os GPU-ból minden lehetséges teljesítményt kiprésel, még akkor is, ha nagyobb, nehezebb és gyakran hangosabb, mint sok versenytársa.
Más 18 hüvelykes gamer laptopokkal összehasonlítva a Raider 18 HX tágasabb gépelési élményt és négy SODIMM-helyet kínál, míg az olyan alternatívák, mint a Blade 18 vagy a ROG Strix G18 egyáltalán nem rendelkeznek számlapokkal, vagy csak két SODIMM-modult támogatnak. Az MSI rendszere azonban még mindig érezhetően nagyobb és nehezebb, mint a legtöbb versenytársé, és nem feltétlenül fut halkabban, hogy ezt ellensúlyozza. A CPU és a GPU teljesítménye valamivel gyorsabb lehet, de sok felhasználó a gyakorlatban talán észre sem veszi. Ebben az esetben a Raider könnyebb szervizelését és 4K-s mini-LED lehetőségeit kell értékelni, hogy igazolja a súlyát.
Ár és elérhetőség
Az MSI Raider 18 HX a felülvizsgálatunkban szereplő konfigurációban már elérhető az Amazonon 3190 dollárért. Alternatívaként az IPS változat is elérhető 3290 dollárért.
Megjegyzés: Nemrégiben frissítettük a minősítési rendszerünket, és a 8-as verzió eredményei nem hasonlíthatók össze a 7-es verzió eredményeivel. További információk elérhetők itt .
MSI Raider 18 HX A14V
- 09/03/2024 v8
Allen Ngo
 Total Sustainability Score:
 Átláthatóság
A felülvizsgálandó készülékek kiválasztását szerkesztőségünk végzi. A tesztmintát a gyártó vagy a kiskereskedő kölcsönként bocsátotta a szerző rendelkezésére a felülvizsgálat céljából. A hitelezőnek nem volt befolyása erre a felülvizsgálatra, és a gyártó sem kapott másolatot erről a felülvizsgálatról a közzététel előtt. Nem volt kötelesség ezt az ismertetőt közzétenni. Független médiavállalatként a Notebookcheck nincs alávetve a gyártók, kiskereskedők vagy kiadók felhatalmazásának.
Így tesztel a Notebookcheck
A Notebookcheck minden évben független, laptopok és okostelefonok százait vizsgálja meg szabványosított eljárások alkalmazásával annak érdekében, hogy minden eredmény összehasonlítható legyen. Körülbelül 20 éve folyamatosan fejlesztjük vizsgálati módszereinket, és ennek során iparági szabványokat állítottunk fel. Tesztlaboratóriumainkban kiváló minőségű mérőberendezéseket használnak tapasztalt technikusok és szerkesztők. Ezek a tesztek többlépcsős validációs folyamatot foglalnak magukban. Komplex minősítési rendszerünk több száz megalapozott mérésen és benchmarkon alapul, ami megőrzi az objektivitást.Price comparison

